| Param | Original file | Final file |
|---|---|---|
| Filename | modeM0/AS1A05_013T01_9000005822_42745cztM0_level2.fits | modeM0/AS1A05_013T01_9000005822_42745cztM0_level2_quad_clean.evt |
| Size (bytes) | 401,788,800 | 86,057,280 |
| Size | 383.2 MB | 82.1 MB |
| Events in quadrant A | 3,036,178 | 597,133 |
| Events in quadrant B | 2,409,203 | 601,110 |
| Events in quadrant C | 5,574,525 | 505,975 |
| Events in quadrant D | 3,438,616 | 528,747 |
| Mode M0 | |||
|---|---|---|---|
| Quadrant | BADHDUFLAG | Total packets | Discarded packets |
| A | 0 | 12175 | 2 |
| B | 0 | 10921 | 2 |
| C | 0 | 20144 | 2 |
| D | 0 | 13970 | 2 |
| Mode M9 | |||
|---|---|---|---|
| Quadrant | BADHDUFLAG | Total packets | Discarded packets |
| A | 0 | 17 | 0 |
| B | 0 | 17 | 0 |
| C | 0 | 17 | 0 |
| D | 0 | 17 | 0 |
| Mode SS | |||
|---|---|---|---|
| Quadrant | BADHDUFLAG | Total packets | Discarded packets |
| A | 0 | 108 | 0 |
| B | 0 | 108 | 0 |
| C | 0 | 108 | 0 |
| D | 0 | 108 | 0 |
| Quadrant | Total seconds | Saturated seconds | Saturation percentage |
|---|---|---|---|
| A | 5322 | 53 | 0.995866% |
| B | 5323 | 12 | 0.225437% |
| C | 5323 | 917 | 17.227128% |
| D | 5323 | 231 | 4.339658% |
Noise dominated data is calculated using 1-second bins in cleaned event files. If a bin has >2000 counts, and if more than 50% of those come from <1% of pixels, then it is considered to be noise-dominated and hence unusable.
| Quadrant | # 1 sec bins | Bins with >0 counts | Bins with >2000 counts | High rate bins dominated by noise | Noise dominated (total time) | Noise dominated (detector-on time) | Marked lightcurve |
|---|---|---|---|---|---|---|---|
| A | 7024 | 5323 | 39 | 39 | 0.56% | 0.73% | 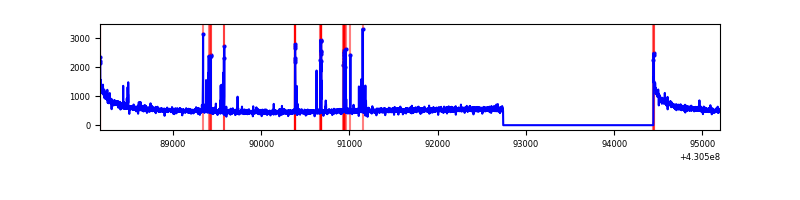 |
| B | 7025 | 5324 | 6 | 6 | 0.09% | 0.11% | 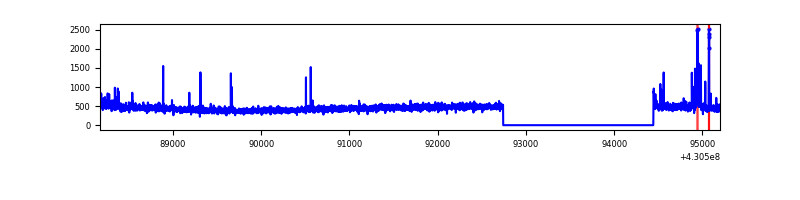 |
| C | 7025 | 5324 | 804 | 804 | 11.44% | 15.10% | 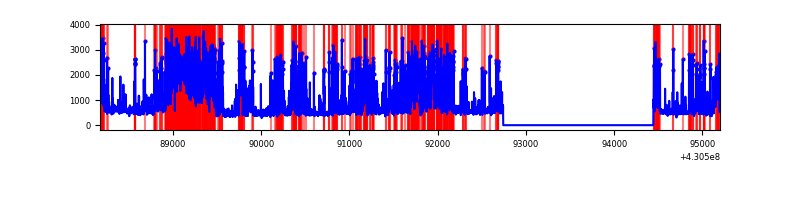 |
| D | 7025 | 5324 | 236 | 236 | 3.36% | 4.43% | 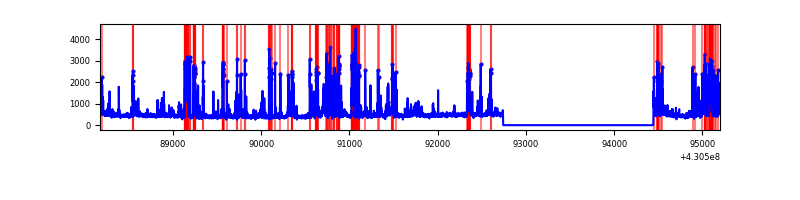 |
Top three noisy pixels from each quadrant. If the there are fewer than three noisy pixels in the level2.evt file, extra rows are filled as -1
| Pixel properties | Quadrant properties | ||||||
|---|---|---|---|---|---|---|---|
| Quadrant | DetID | PixID | Counts | Sigma | Mean | Median | Sigma |
| A | 10 | 83 | 590863 | 4871.23 | 587 | 574 | 121.2 |
| A | 15 | 237 | 96951 | 795.33 | 587 | 574 | 121.2 |
| A | 13 | 248 | 56369 | 460.44 | 587 | 574 | 121.2 |
| B | 4 | 141 | 41378 | 358.94 | 581 | 565 | 113.7 |
| B | 5 | 172 | 31837 | 275.03 | 581 | 565 | 113.7 |
| B | 0 | 230 | 28094 | 242.11 | 581 | 565 | 113.7 |
| C | 4 | 254 | 1614168 | 12898.32 | 530 | 533 | 125.1 |
| C | 0 | 239 | 1193824 | 9538.37 | 530 | 533 | 125.1 |
| C | 14 | 254 | 424837 | 3391.6 | 530 | 533 | 125.1 |
| D | 13 | 249 | 883190 | 6424.11 | 561 | 546 | 137.4 |
| D | 2 | 249 | 256477 | 1862.73 | 561 | 546 | 137.4 |
| D | 5 | 171 | 62565 | 451.39 | 561 | 546 | 137.4 |
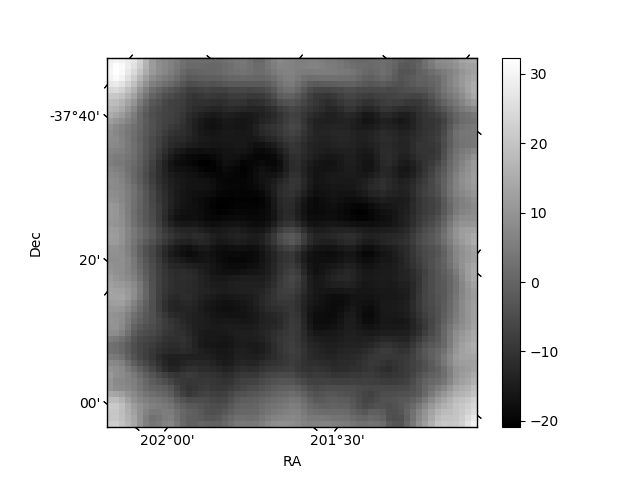
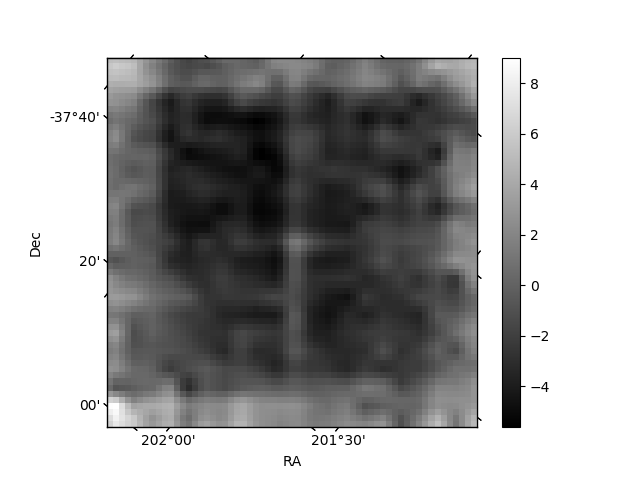
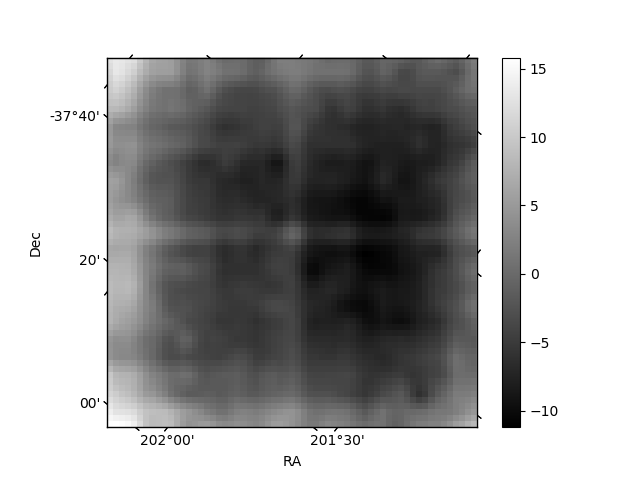
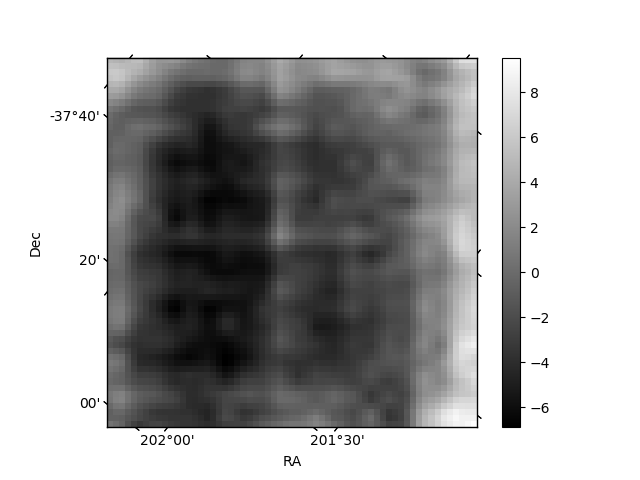
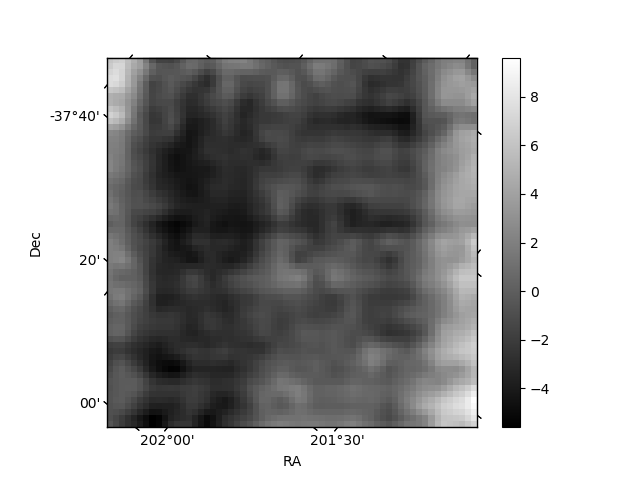
Histogram calculated using DETX and DETY for each event in the final _common_clean file
| Quadrant A | 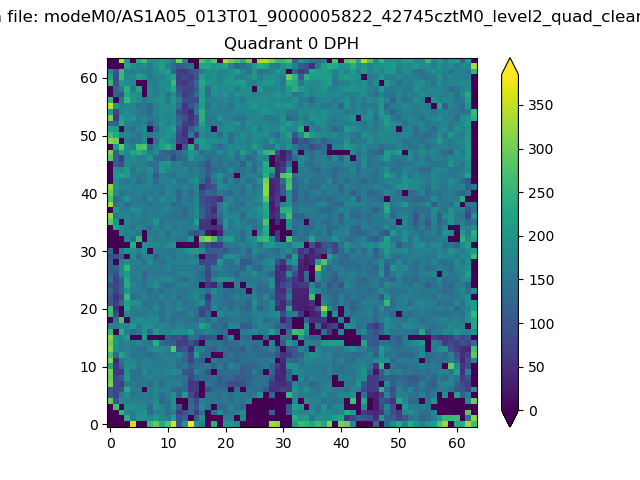 |
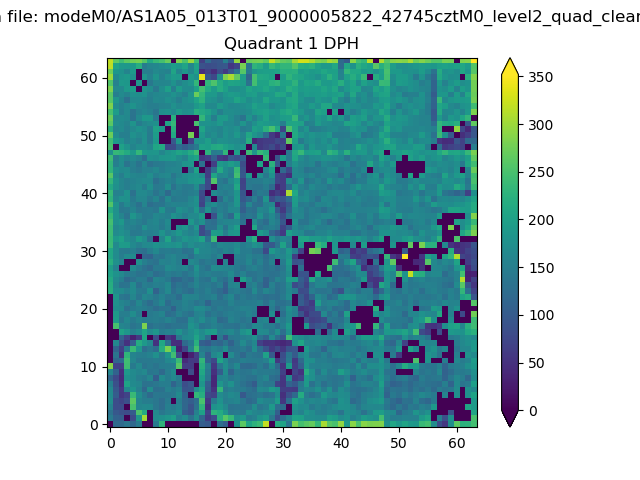 |
Quadrant B |
|---|---|---|---|
| Quadrant D | 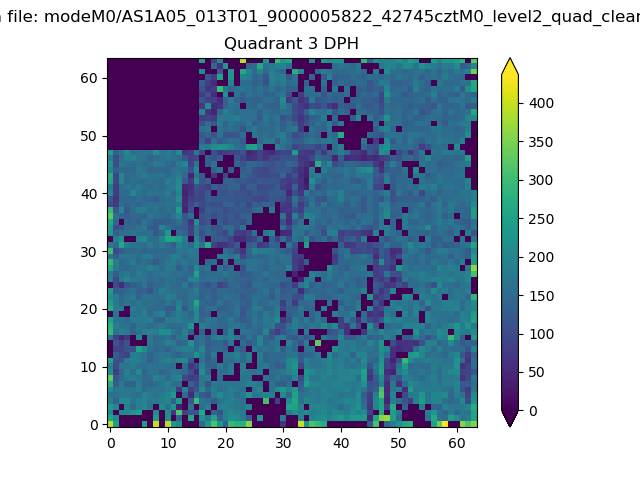 |
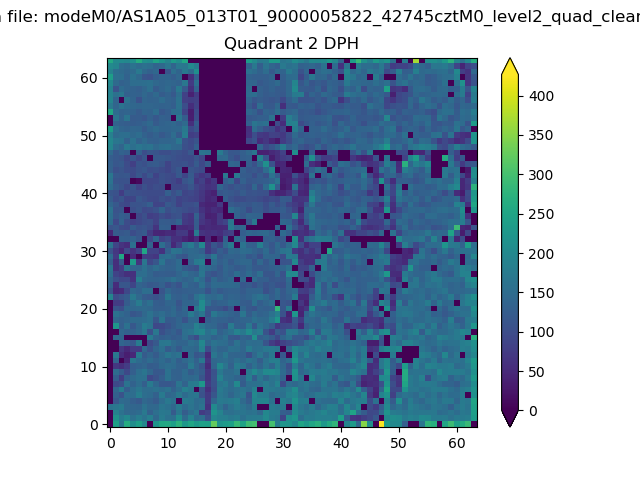 |
Quadrant C |
| Plot type | Count rate plots | Images |
|---|---|---|
| Comparison with Poisson distribution Blue bars denote a histogram of data divided into 1 sec bins. Red curve is a Poisson curve with rate = median count rate of data. |
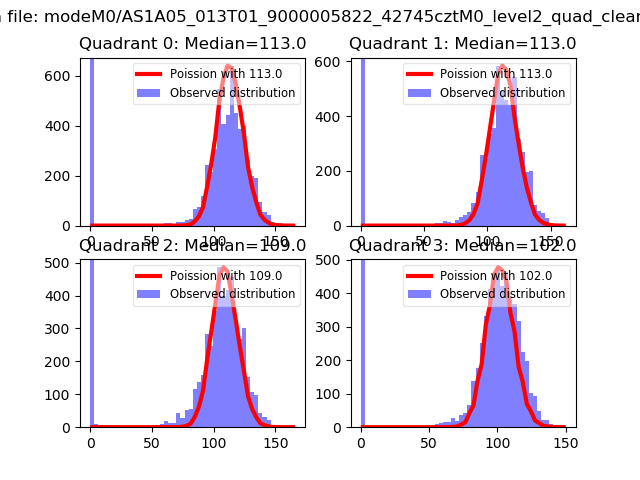 |
 |
| Quadrant-wise count rates Data is divided into 100 sec bins |
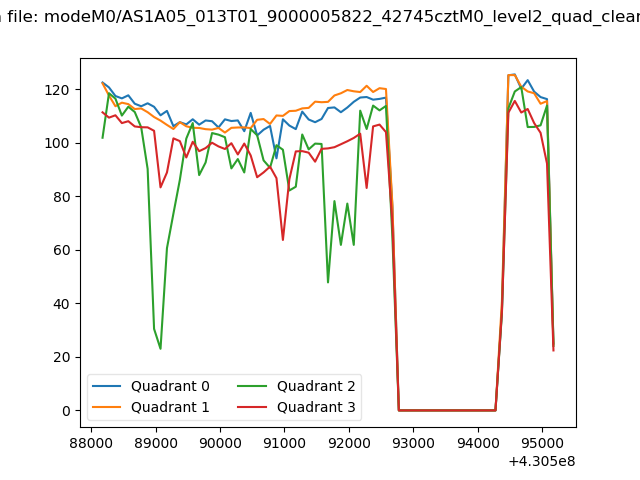 |
|
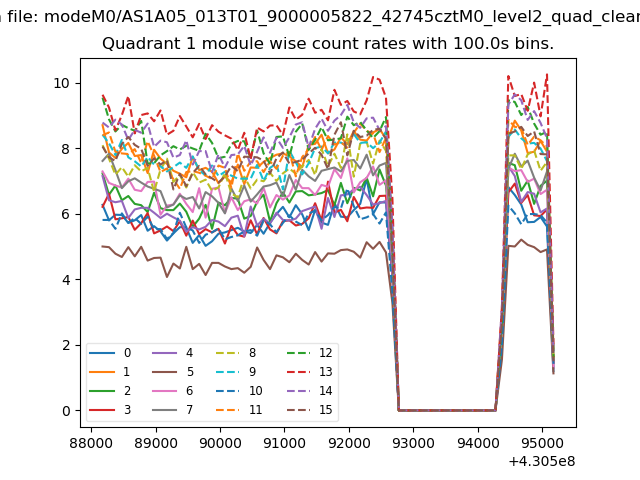
| Module-wise count rates for Quadrant A Data is divided into 100 sec bins |
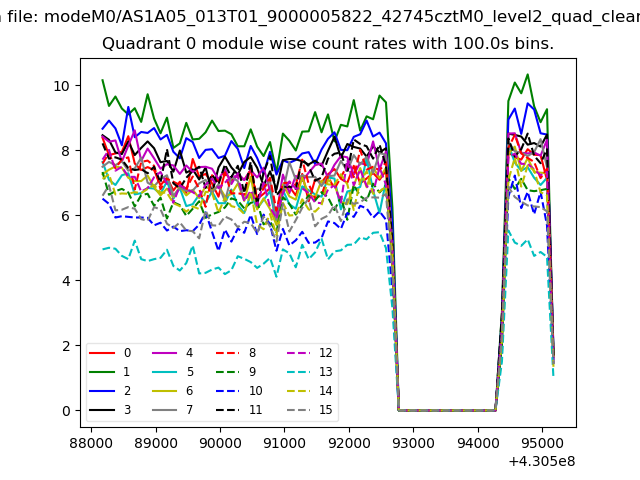 |
 |
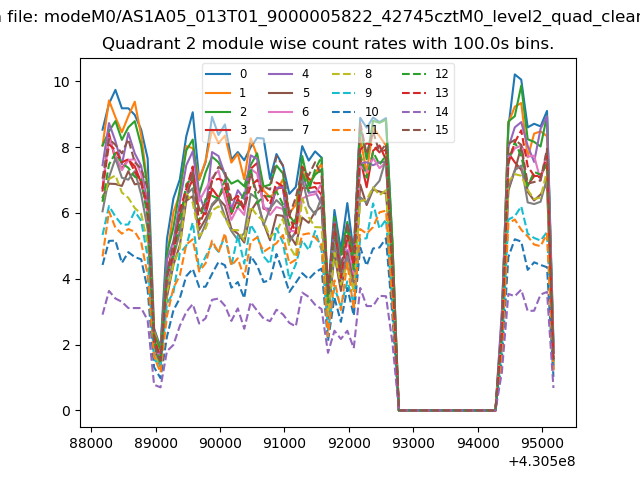
| Module-wise count rates for Quadrant B Data is divided into 100 sec bins |
 |
 |
| Module-wise count rates for Quadrant C Data is divided into 100 sec bins |
 |
 |
| Module-wise count rates for Quadrant D Data is divided into 100 sec bins |
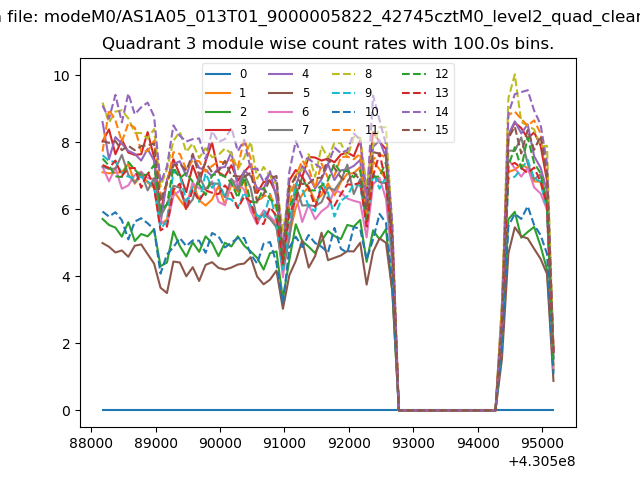 |
 |
| Parameter | Plot |
|---|---|
| CZT HV Monitor | 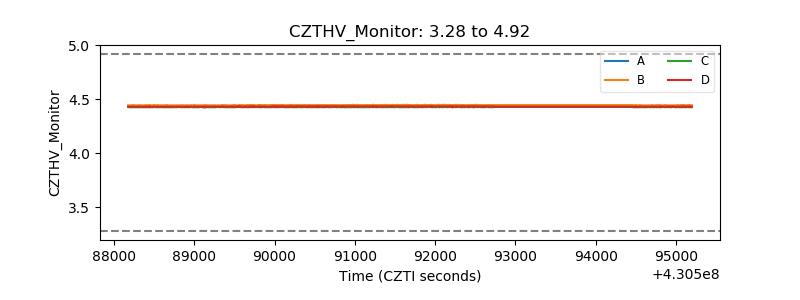 |
| D_VDD | 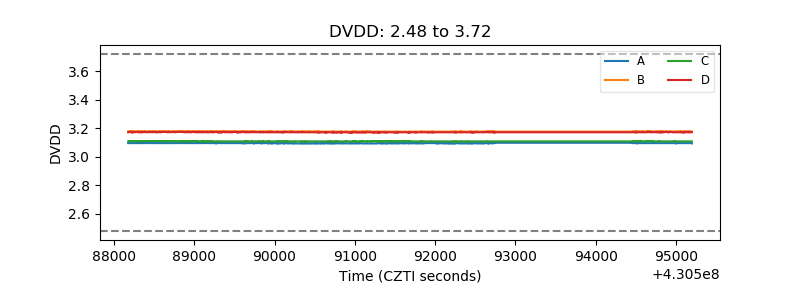 |
| Temperature 1 | 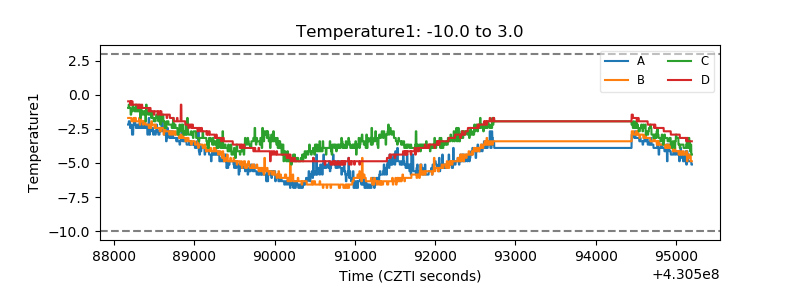 |
| Veto HV Monitor | 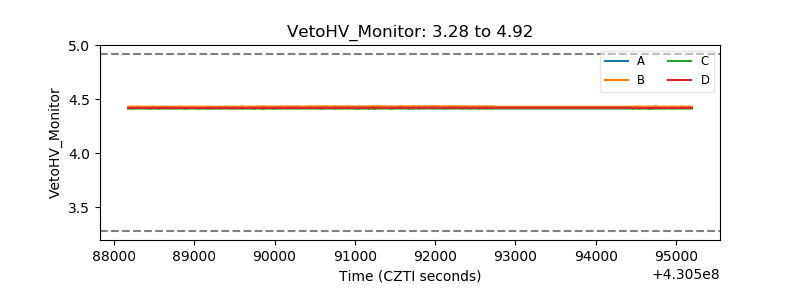 |
| Veto LLD | 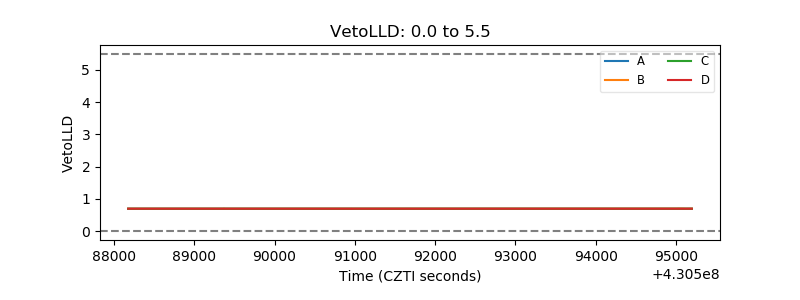 |
| Alpha Counter | 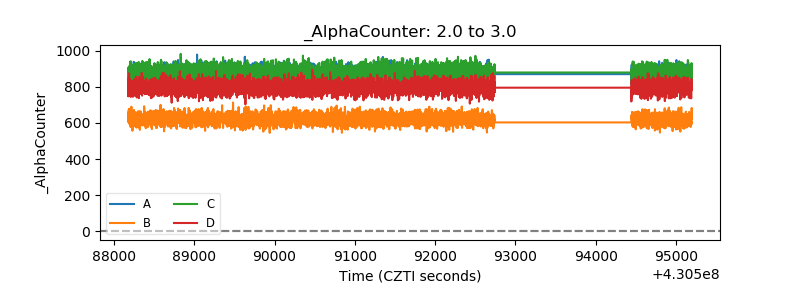 |
| _CPM_Rate | 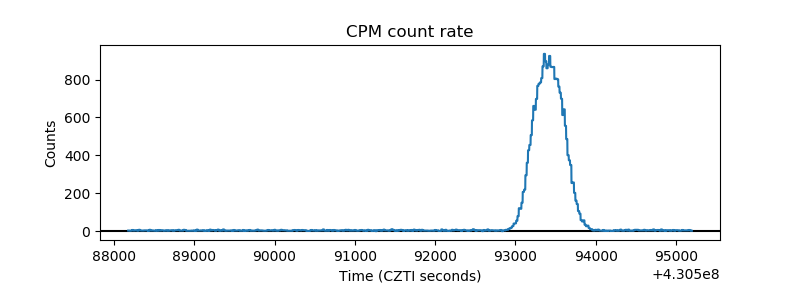 |
| CZT Counter | 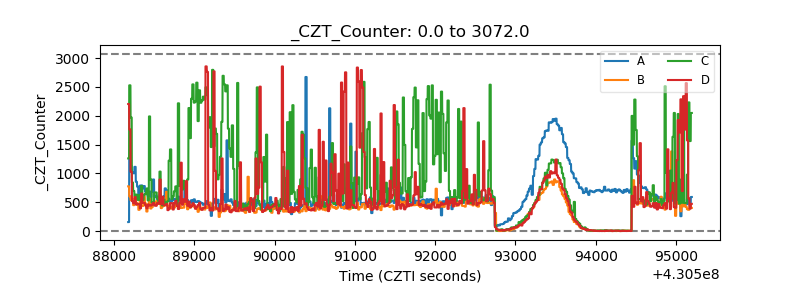 |
| +2.5 Volts monitor | 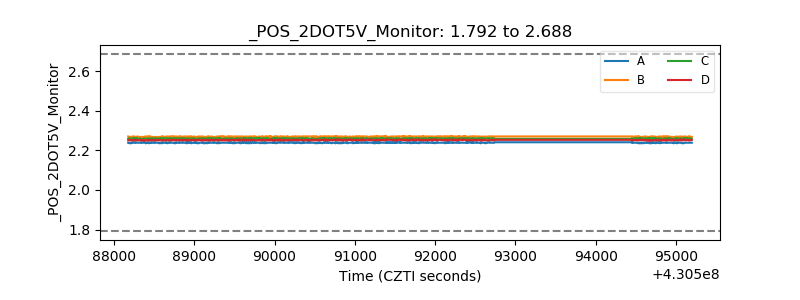 |
| +5 Volts monitor | 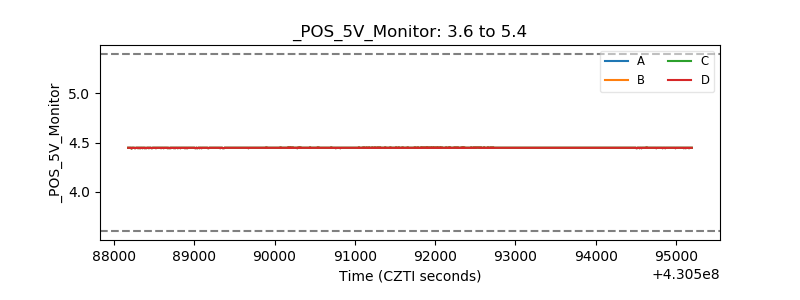 |
| _ROLL_ROT | 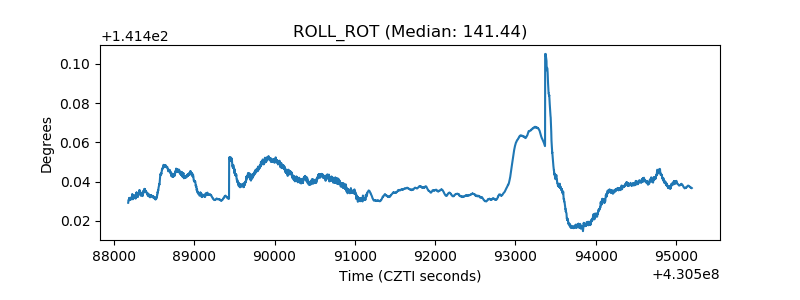 |
| _Roll_DEC | 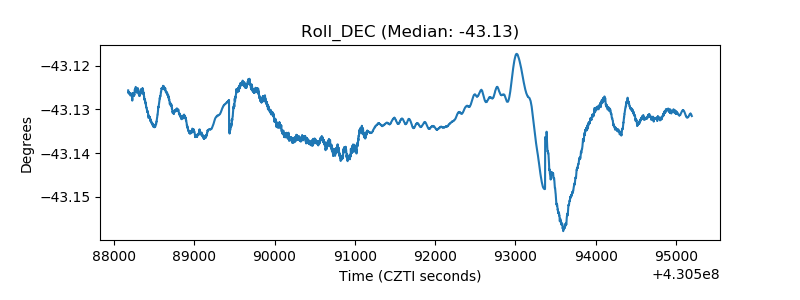 |
| _Roll_RA | 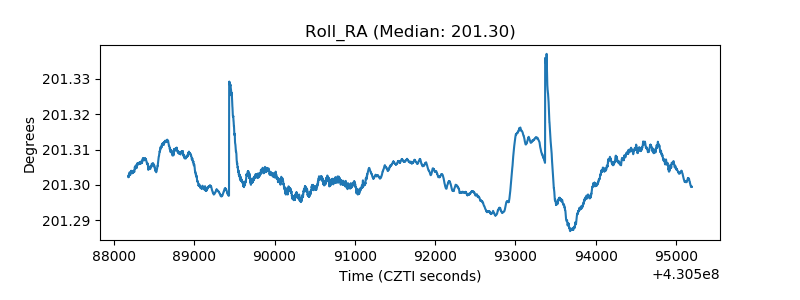 |
| Veto Counter | 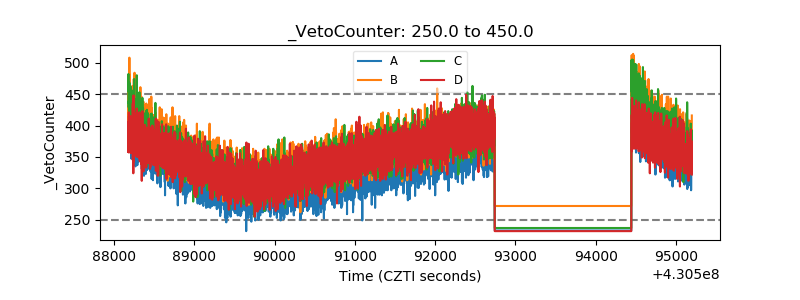 |