| Param | Original file | Final file |
|---|---|---|
| Filename | modeM0/AS1A05_013T01_9000005822_42747cztM0_level2.fits | modeM0/AS1A05_013T01_9000005822_42747cztM0_level2_quad_clean.evt |
| Size (bytes) | 344,675,520 | 89,521,920 |
| Size | 328.7 MB | 85.4 MB |
| Events in quadrant A | 2,999,216 | 612,401 |
| Events in quadrant B | 2,412,685 | 616,750 |
| Events in quadrant C | 3,799,585 | 578,501 |
| Events in quadrant D | 3,137,438 | 534,385 |
| Mode M0 | |||
|---|---|---|---|
| Quadrant | BADHDUFLAG | Total packets | Discarded packets |
| A | 0 | 12033 | 2 |
| B | 0 | 10812 | 2 |
| C | 0 | 14656 | 3 |
| D | 0 | 13091 | 2 |
| Mode M9 | |||
|---|---|---|---|
| Quadrant | BADHDUFLAG | Total packets | Discarded packets |
| A | 0 | 21 | 0 |
| B | 0 | 22 | 0 |
| C | 0 | 22 | 0 |
| D | 0 | 22 | 0 |
| Mode SS | |||
|---|---|---|---|
| Quadrant | BADHDUFLAG | Total packets | Discarded packets |
| A | 0 | 108 | 0 |
| B | 0 | 108 | 0 |
| C | 0 | 108 | 0 |
| D | 0 | 108 | 0 |
| Quadrant | Total seconds | Saturated seconds | Saturation percentage |
|---|---|---|---|
| A | 5262 | 23 | 0.437096% |
| B | 5262 | 9 | 0.171038% |
| C | 5261 | 265 | 5.037065% |
| D | 5261 | 233 | 4.428816% |
Noise dominated data is calculated using 1-second bins in cleaned event files. If a bin has >2000 counts, and if more than 50% of those come from <1% of pixels, then it is considered to be noise-dominated and hence unusable.
| Quadrant | # 1 sec bins | Bins with >0 counts | Bins with >2000 counts | High rate bins dominated by noise | Noise dominated (total time) | Noise dominated (detector-on time) | Marked lightcurve |
|---|---|---|---|---|---|---|---|
| A | 7085 | 5263 | 13 | 13 | 0.18% | 0.25% | 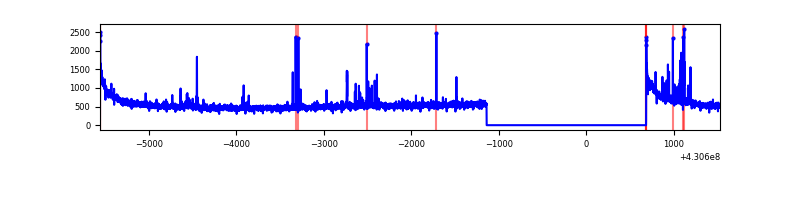 |
| B | 7085 | 5263 | 6 | 6 | 0.08% | 0.11% | 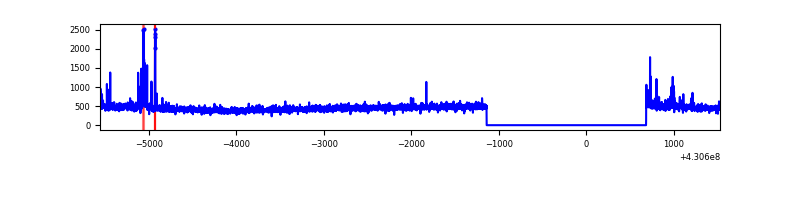 |
| C | 7084 | 5262 | 235 | 235 | 3.32% | 4.47% | 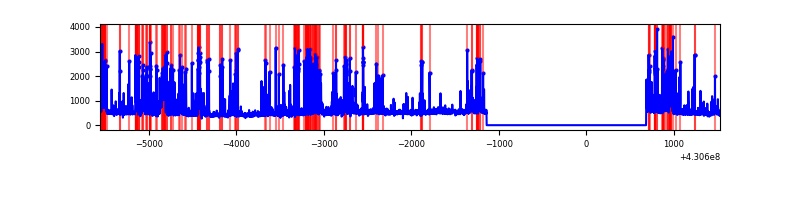 |
| D | 7084 | 5262 | 223 | 223 | 3.15% | 4.24% | 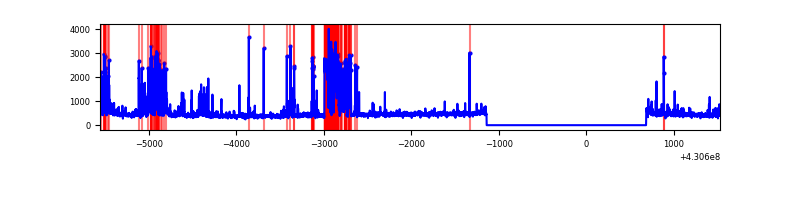 |
Top three noisy pixels from each quadrant. If the there are fewer than three noisy pixels in the level2.evt file, extra rows are filled as -1
| Pixel properties | Quadrant properties | ||||||
|---|---|---|---|---|---|---|---|
| Quadrant | DetID | PixID | Counts | Sigma | Mean | Median | Sigma |
| A | 10 | 83 | 567748 | 4753.83 | 588 | 577 | 119.3 |
| A | 13 | 248 | 69288 | 575.91 | 588 | 577 | 119.3 |
| A | 15 | 237 | 46010 | 380.8 | 588 | 577 | 119.3 |
| B | 4 | 141 | 44378 | 389.28 | 584 | 568 | 112.5 |
| B | 5 | 172 | 35435 | 309.82 | 584 | 568 | 112.5 |
| B | 0 | 230 | 18362 | 158.11 | 584 | 568 | 112.5 |
| C | 4 | 254 | 996615 | 7630.4 | 560 | 565 | 130.5 |
| C | 0 | 239 | 349174 | 2670.57 | 560 | 565 | 130.5 |
| C | 15 | 214 | 215053 | 1643.12 | 560 | 565 | 130.5 |
| D | 12 | 6 | 510134 | 3696.14 | 559 | 542 | 137.9 |
| D | 2 | 249 | 288235 | 2086.68 | 559 | 542 | 137.9 |
| D | 13 | 249 | 44985 | 322.35 | 559 | 542 | 137.9 |
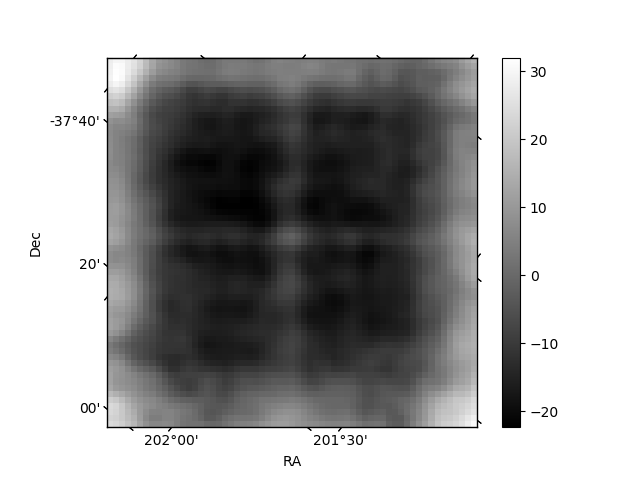
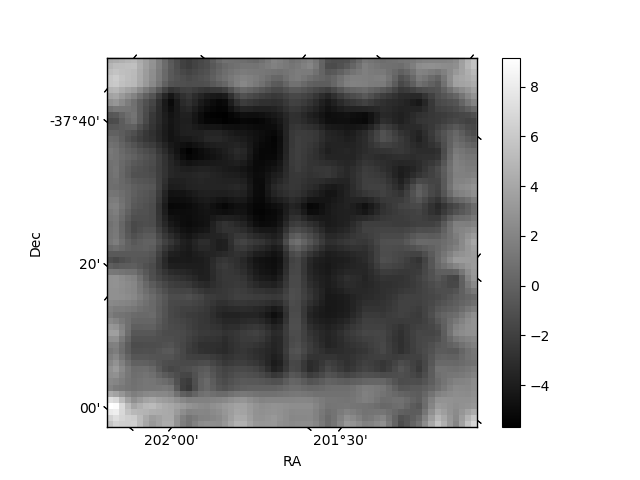
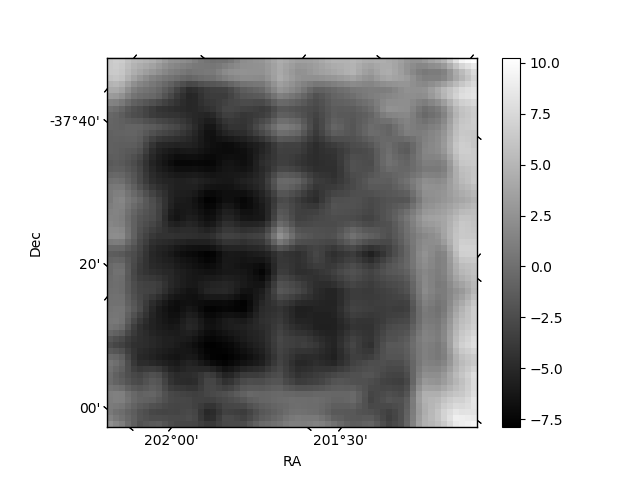
Histogram calculated using DETX and DETY for each event in the final _common_clean file
| Quadrant A | 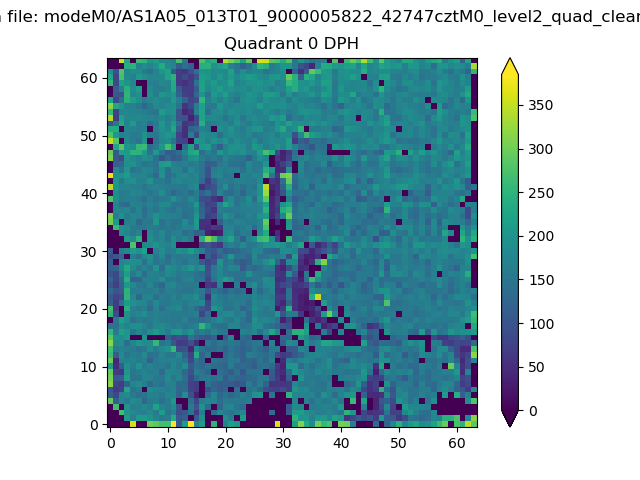 |
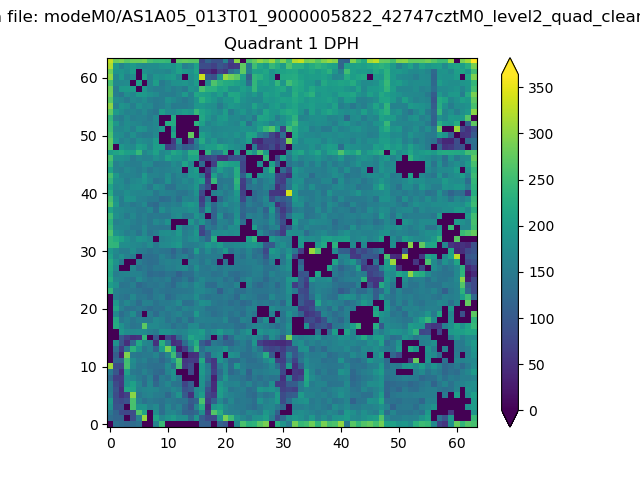 |
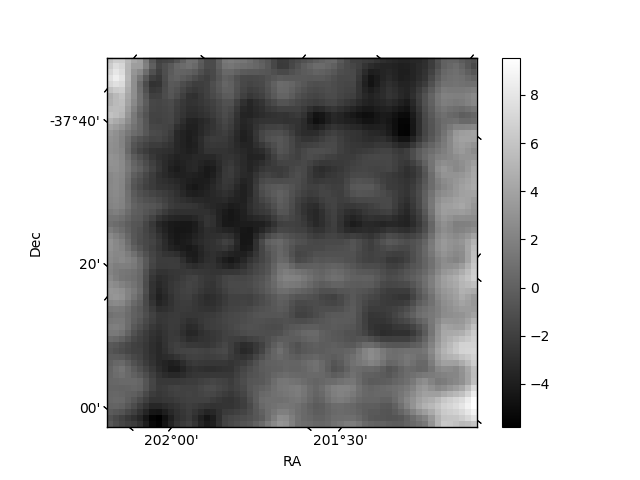
Quadrant B |
|---|---|---|---|
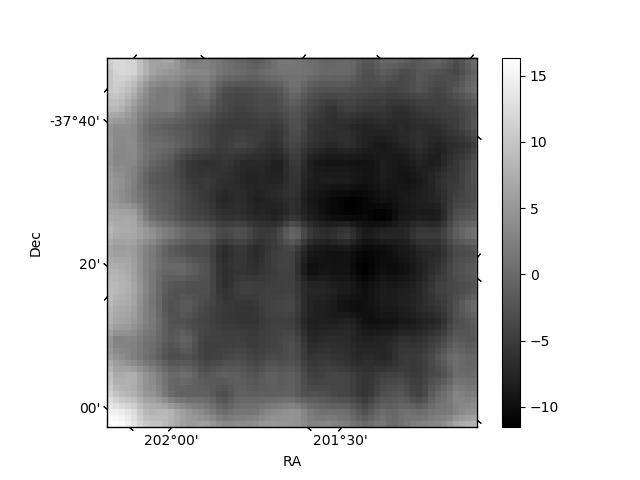
| Quadrant D | 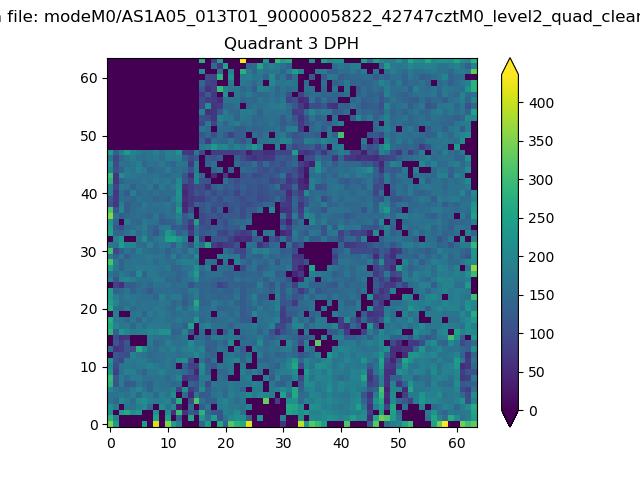 |
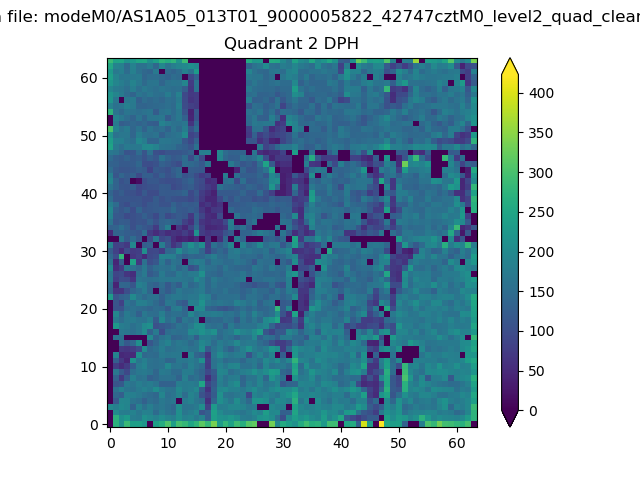 |
Quadrant C |
| Plot type | Count rate plots | Images |
|---|---|---|
| Comparison with Poisson distribution Blue bars denote a histogram of data divided into 1 sec bins. Red curve is a Poisson curve with rate = median count rate of data. |
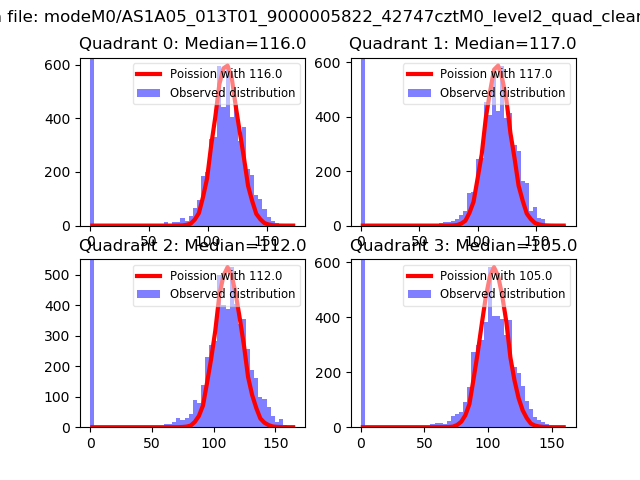 |
 |
| Quadrant-wise count rates Data is divided into 100 sec bins |
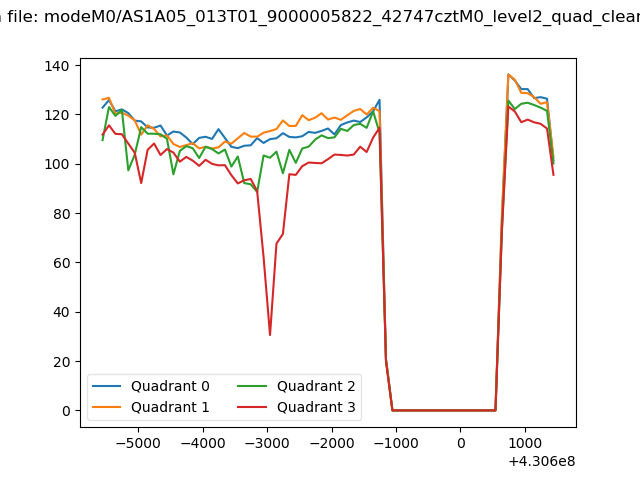 |
|
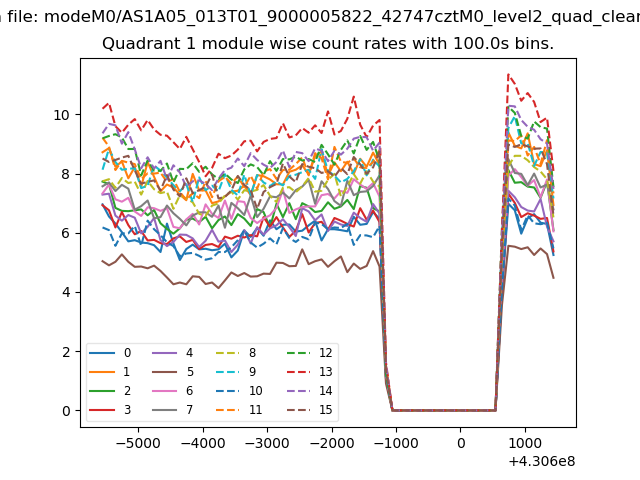
| Module-wise count rates for Quadrant A Data is divided into 100 sec bins |
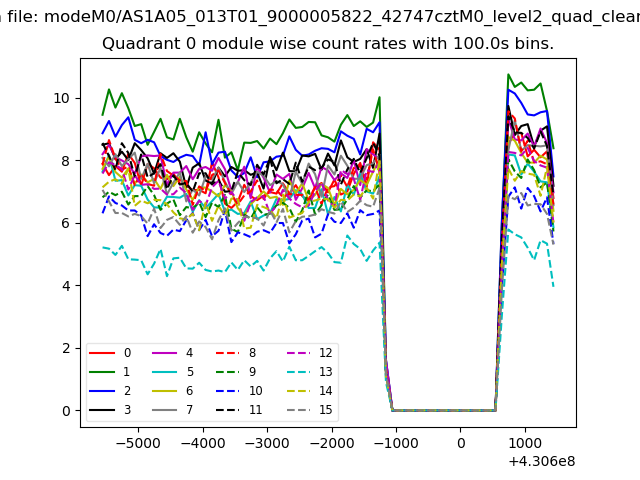 |
 |
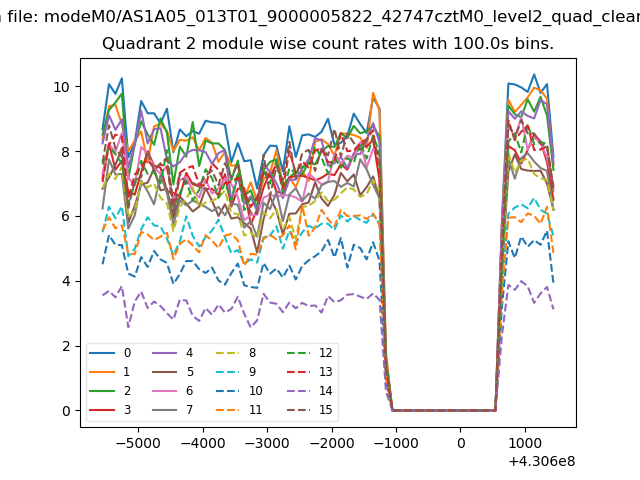
| Module-wise count rates for Quadrant B Data is divided into 100 sec bins |
 |
 |
| Module-wise count rates for Quadrant C Data is divided into 100 sec bins |
 |
 |
| Module-wise count rates for Quadrant D Data is divided into 100 sec bins |
 |
 |
| Parameter | Plot |
|---|---|
| CZT HV Monitor | 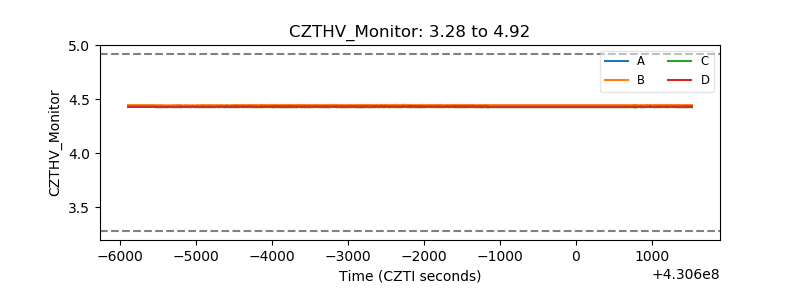 |
| D_VDD | 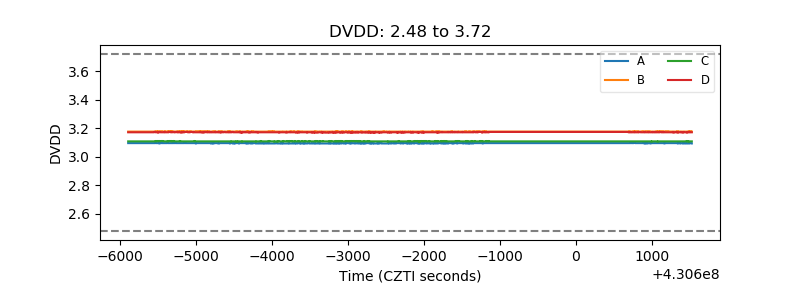 |
| Temperature 1 | 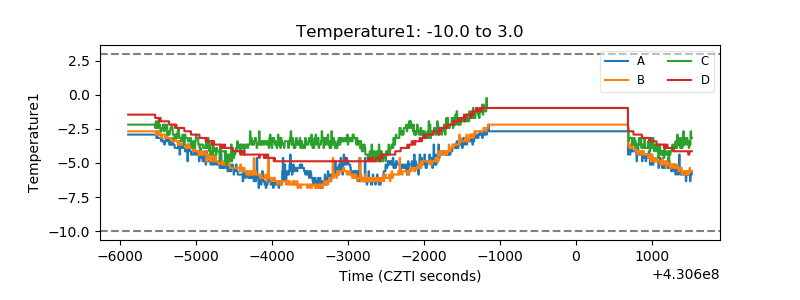 |
| Veto HV Monitor | 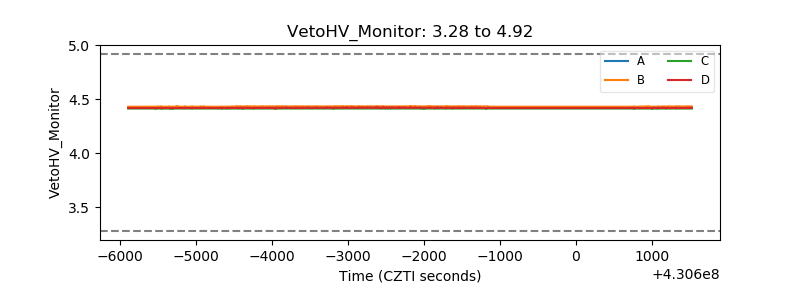 |
| Veto LLD | 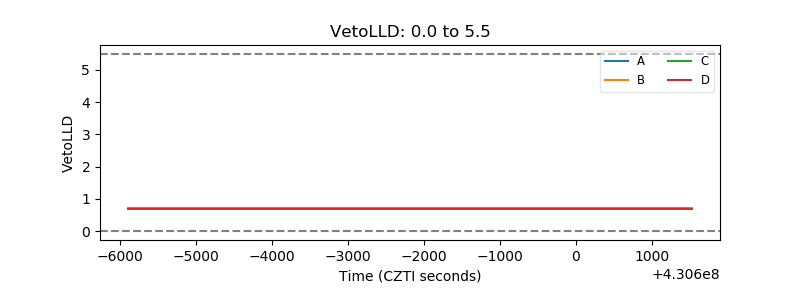 |
| Alpha Counter | 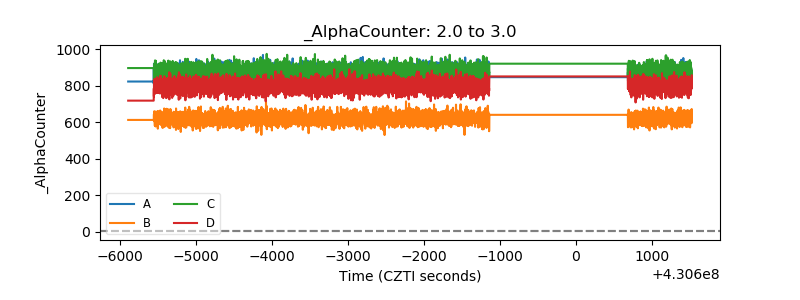 |
| _CPM_Rate | 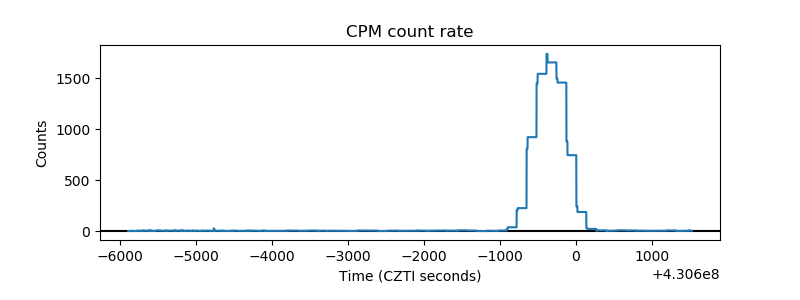 |
| CZT Counter | 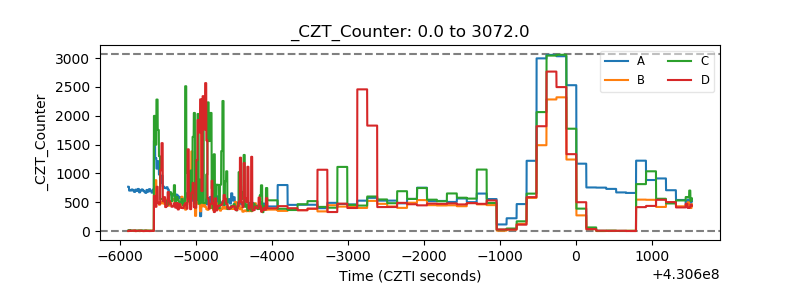 |
| +2.5 Volts monitor | 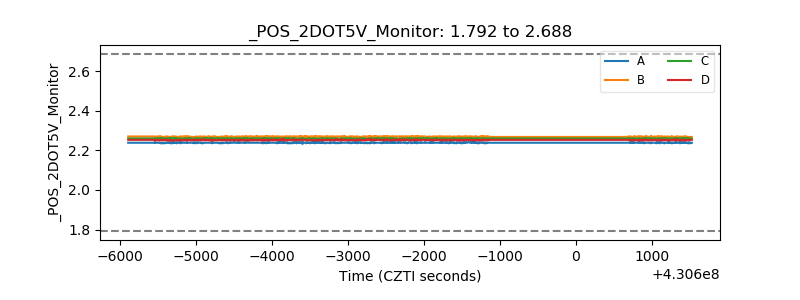 |
| +5 Volts monitor | 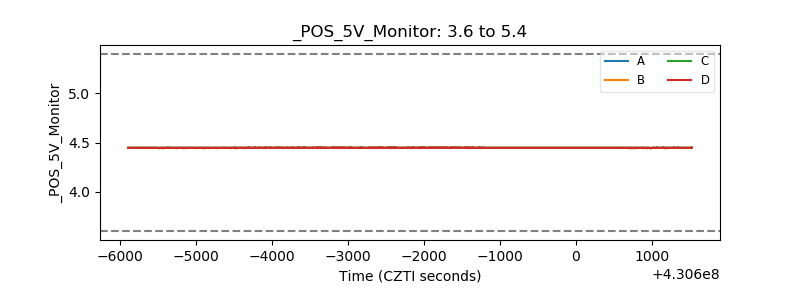 |
| _ROLL_ROT | 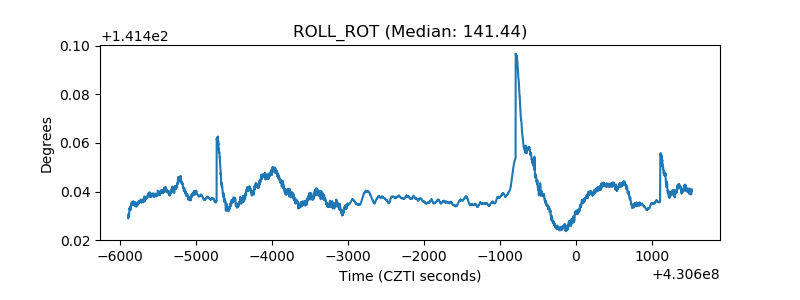 |
| _Roll_DEC | 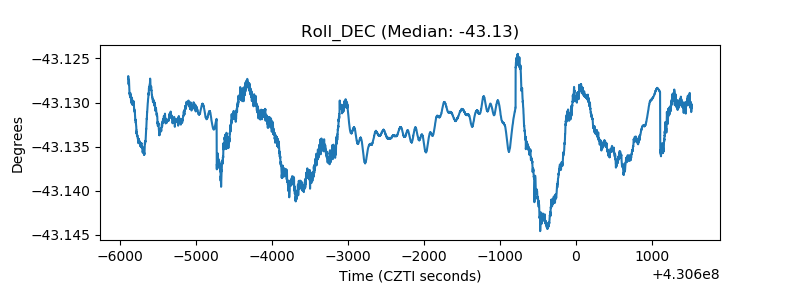 |
| _Roll_RA | 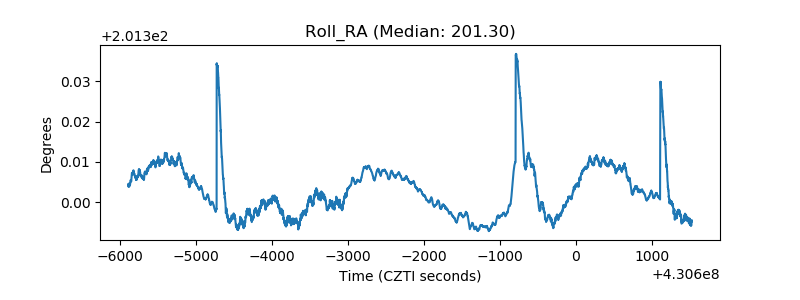 |
| Veto Counter |  |