| Param | Original file | Final file |
|---|---|---|
| Filename | modeM0/AS1A05_013T01_9000005822_42748cztM0_level2.fits | modeM0/AS1A05_013T01_9000005822_42748cztM0_level2_quad_clean.evt |
| Size (bytes) | 325,802,880 | 91,895,040 |
| Size | 310.7 MB | 87.6 MB |
| Events in quadrant A | 3,055,542 | 628,411 |
| Events in quadrant B | 2,444,364 | 634,478 |
| Events in quadrant C | 3,690,460 | 594,521 |
| Events in quadrant D | 2,468,596 | 564,198 |
| Mode M0 | |||
|---|---|---|---|
| Quadrant | BADHDUFLAG | Total packets | Discarded packets |
| A | 0 | 12131 | 2 |
| B | 0 | 10609 | 2 |
| C | 0 | 14236 | 2 |
| D | 0 | 10942 | 2 |
| Mode M9 | |||
|---|---|---|---|
| Quadrant | BADHDUFLAG | Total packets | Discarded packets |
| A | 0 | 22 | 0 |
| B | 0 | 23 | 0 |
| C | 0 | 23 | 0 |
| D | 0 | 23 | 0 |
| Mode SS | |||
|---|---|---|---|
| Quadrant | BADHDUFLAG | Total packets | Discarded packets |
| A | 0 | 106 | 0 |
| B | 0 | 106 | 0 |
| C | 0 | 106 | 0 |
| D | 0 | 106 | 0 |
| Quadrant | Total seconds | Saturated seconds | Saturation percentage |
|---|---|---|---|
| A | 5149 | 31 | 0.602059% |
| B | 5149 | 16 | 0.310740% |
| C | 5149 | 183 | 3.554088% |
| D | 5149 | 38 | 0.738007% |
Noise dominated data is calculated using 1-second bins in cleaned event files. If a bin has >2000 counts, and if more than 50% of those come from <1% of pixels, then it is considered to be noise-dominated and hence unusable.
| Quadrant | # 1 sec bins | Bins with >0 counts | Bins with >2000 counts | High rate bins dominated by noise | Noise dominated (total time) | Noise dominated (detector-on time) | Marked lightcurve |
|---|---|---|---|---|---|---|---|
| A | 7092 | 5150 | 18 | 18 | 0.25% | 0.35% | 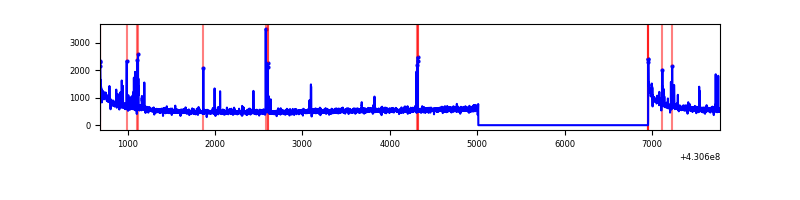 |
| B | 7092 | 5150 | 6 | 6 | 0.08% | 0.12% | 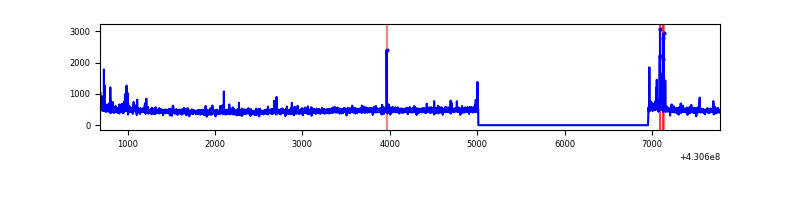 |
| C | 7091 | 5149 | 155 | 155 | 2.19% | 3.01% | 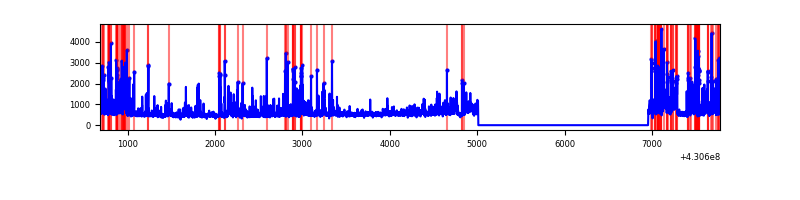 |
| D | 7092 | 5150 | 34 | 34 | 0.48% | 0.66% | 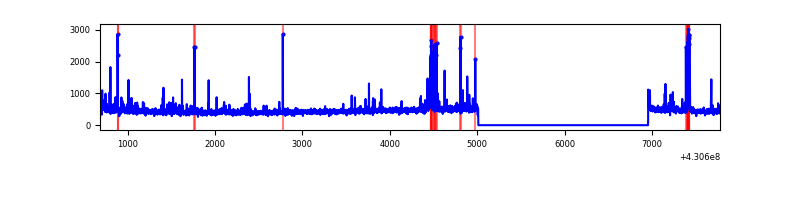 |
Top three noisy pixels from each quadrant. If the there are fewer than three noisy pixels in the level2.evt file, extra rows are filled as -1
| Pixel properties | Quadrant properties | ||||||
|---|---|---|---|---|---|---|---|
| Quadrant | DetID | PixID | Counts | Sigma | Mean | Median | Sigma |
| A | 10 | 83 | 552309 | 4575.64 | 596 | 585 | 120.6 |
| A | 13 | 248 | 91894 | 757.26 | 596 | 585 | 120.6 |
| A | 15 | 237 | 44504 | 364.24 | 596 | 585 | 120.6 |
| B | 5 | 172 | 52873 | 462.57 | 590 | 575 | 113.1 |
| B | 0 | 245 | 28292 | 245.15 | 590 | 575 | 113.1 |
| B | 5 | 255 | 21278 | 183.11 | 590 | 575 | 113.1 |
| C | 0 | 239 | 874220 | 6580.99 | 569 | 573 | 132.8 |
| C | 4 | 254 | 338027 | 2541.97 | 569 | 573 | 132.8 |
| C | 15 | 214 | 210887 | 1584.25 | 569 | 573 | 132.8 |
| D | 7 | 96 | 84100 | 590.77 | 576 | 560 | 141.4 |
| D | 12 | 233 | 59306 | 415.43 | 576 | 560 | 141.4 |
| D | 5 | 70 | 29317 | 203.36 | 576 | 560 | 141.4 |
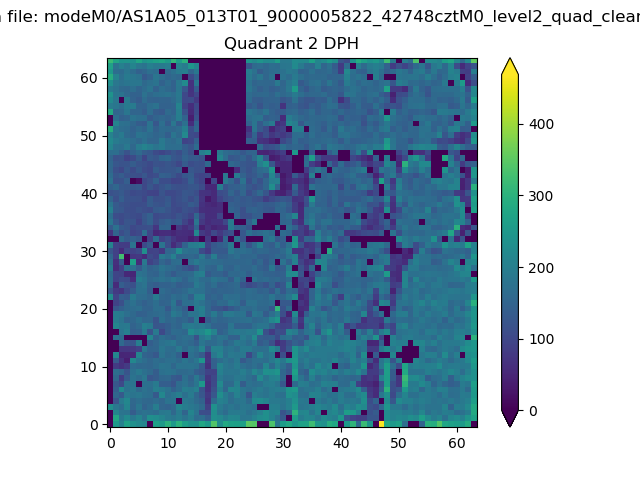
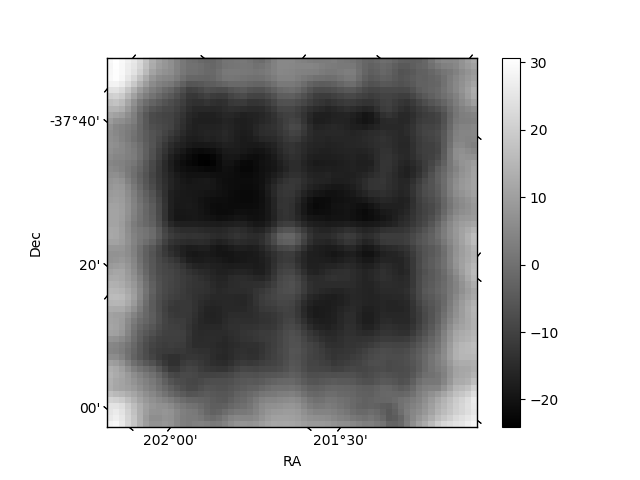
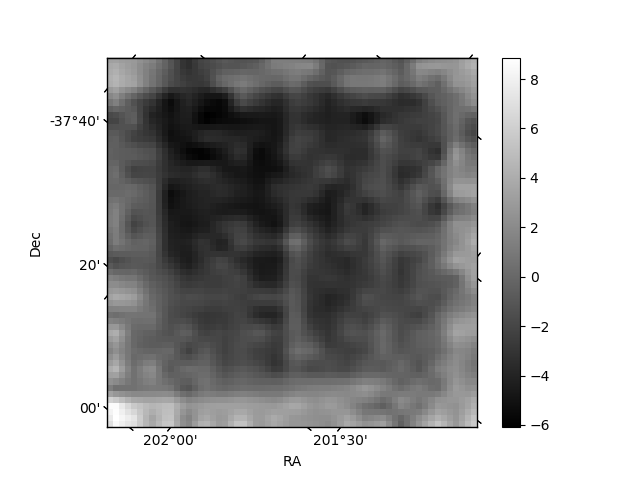
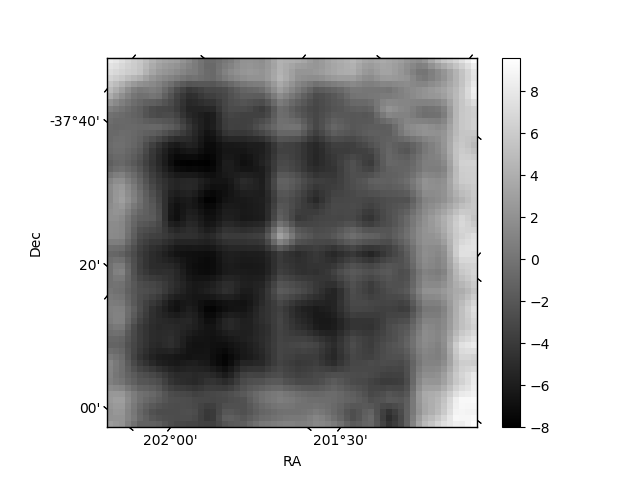
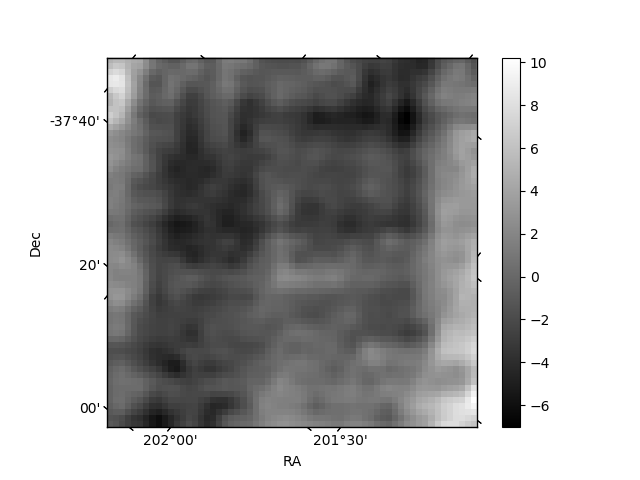
Histogram calculated using DETX and DETY for each event in the final _common_clean file
| Quadrant A | 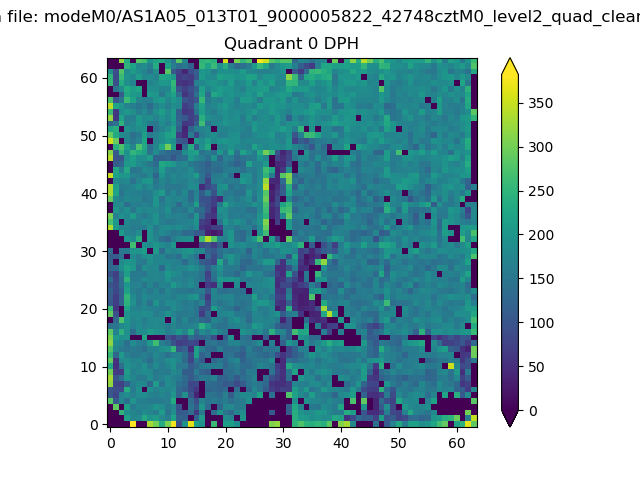 |
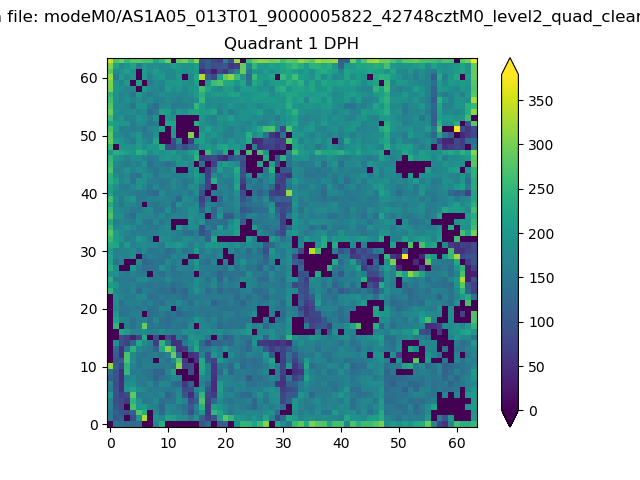 |
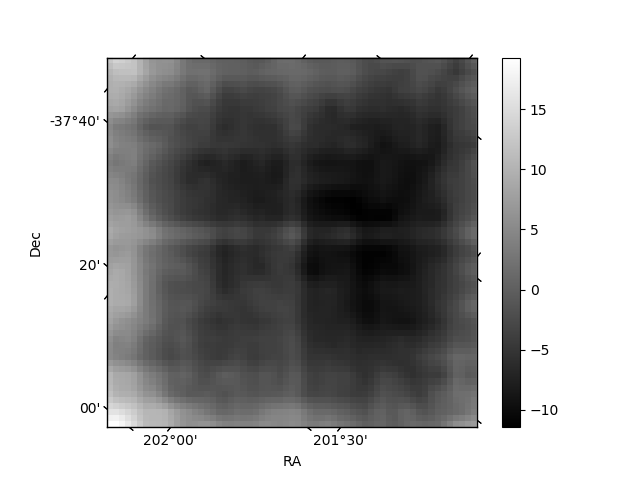
Quadrant B |
|---|---|---|---|
| Quadrant D | 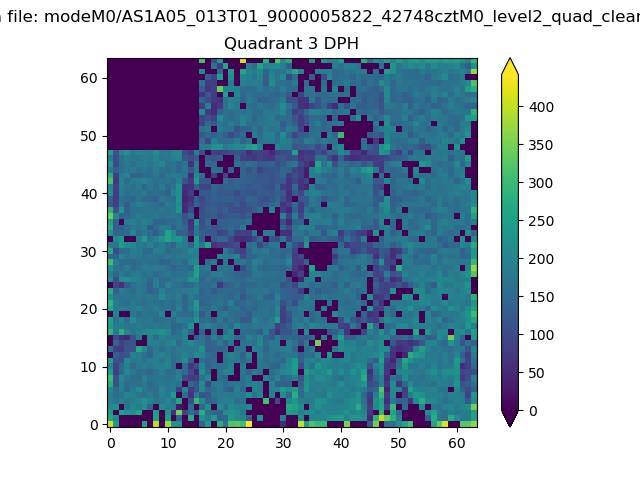 |
 |
Quadrant C |
| Plot type | Count rate plots | Images |
|---|---|---|
| Comparison with Poisson distribution Blue bars denote a histogram of data divided into 1 sec bins. Red curve is a Poisson curve with rate = median count rate of data. |
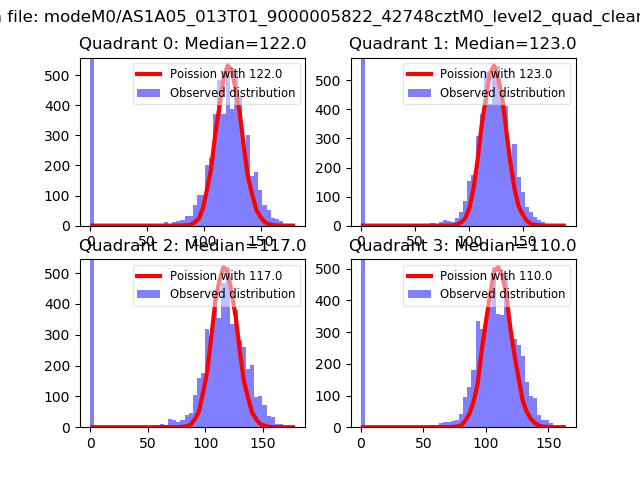 |
 |
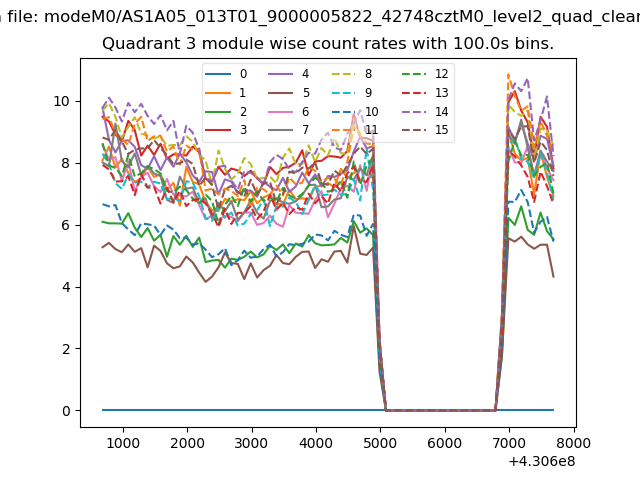
| Quadrant-wise count rates Data is divided into 100 sec bins |
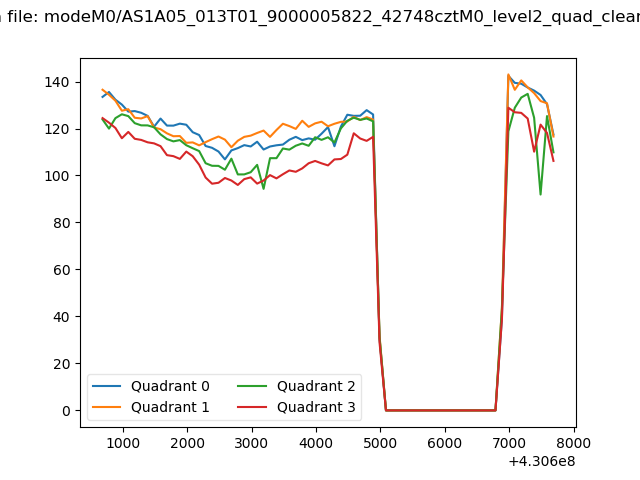 |
|
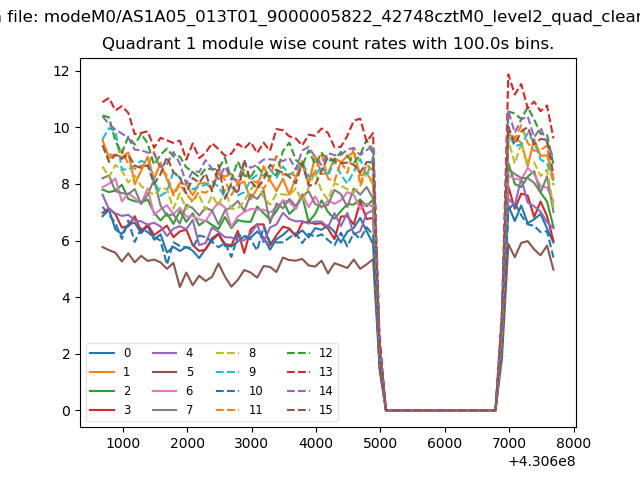
| Module-wise count rates for Quadrant A Data is divided into 100 sec bins |
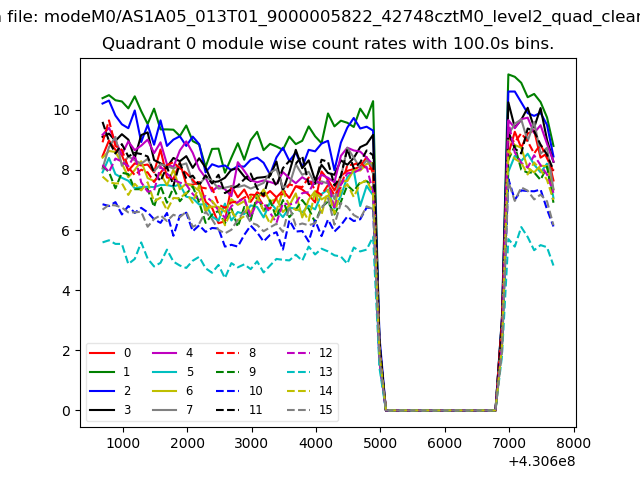 |
 |
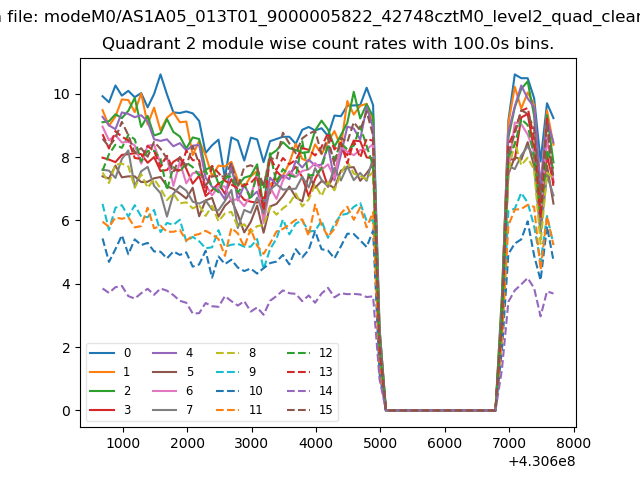
| Module-wise count rates for Quadrant B Data is divided into 100 sec bins |
 |
 |
| Module-wise count rates for Quadrant C Data is divided into 100 sec bins |
 |
 |
| Module-wise count rates for Quadrant D Data is divided into 100 sec bins |
 |
 |
| Parameter | Plot |
|---|---|
| CZT HV Monitor | 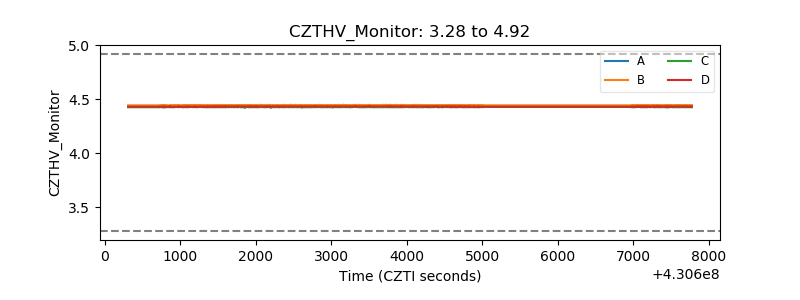 |
| D_VDD | 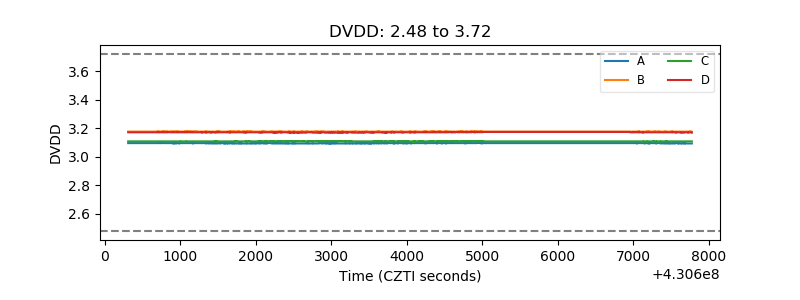 |
| Temperature 1 | 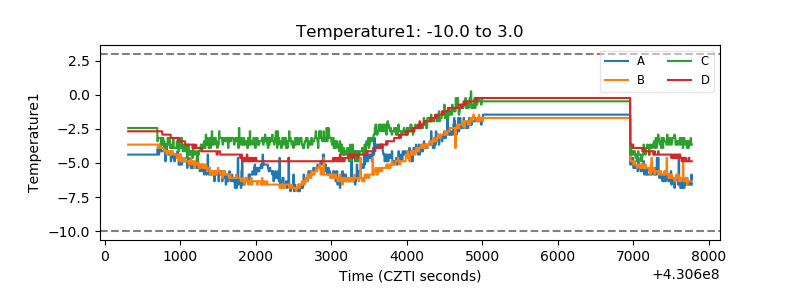 |
| Veto HV Monitor |  |
| Veto LLD | 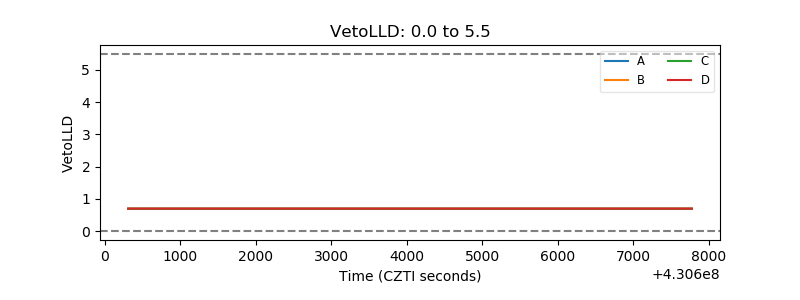 |
| Alpha Counter | 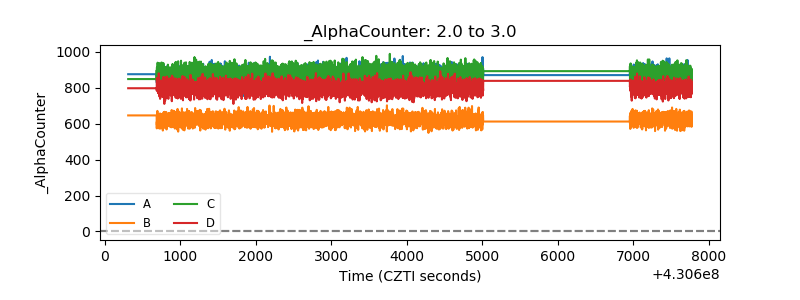 |
| _CPM_Rate | 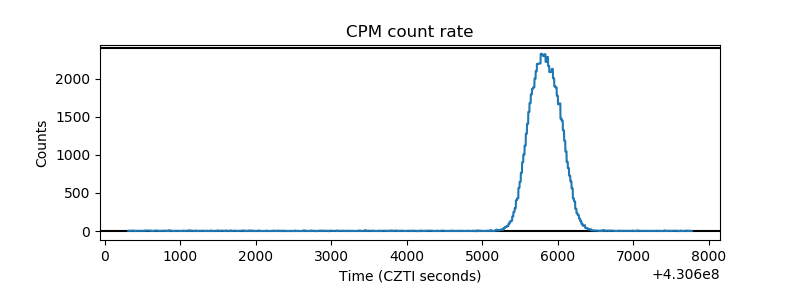 |
| CZT Counter | 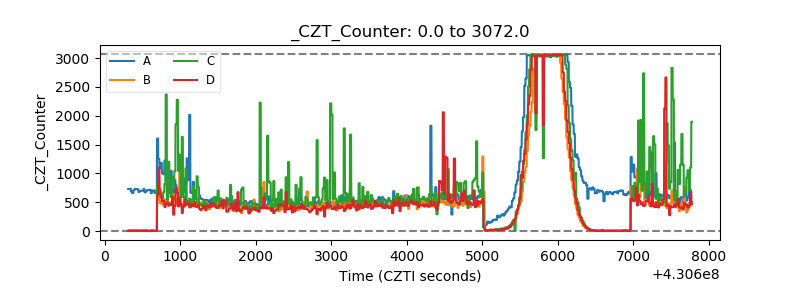 |
| +2.5 Volts monitor | 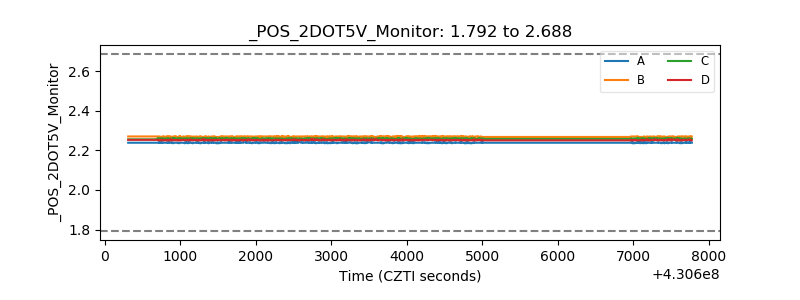 |
| +5 Volts monitor | 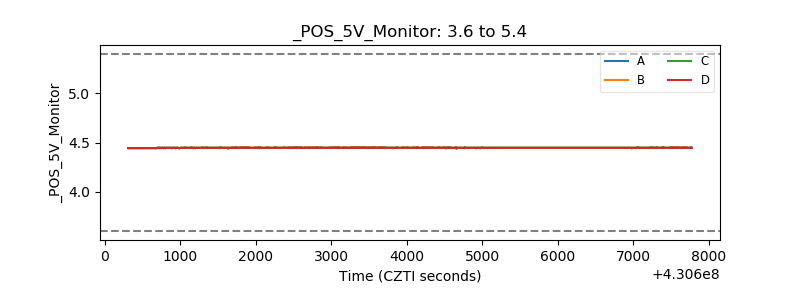 |
| _ROLL_ROT | 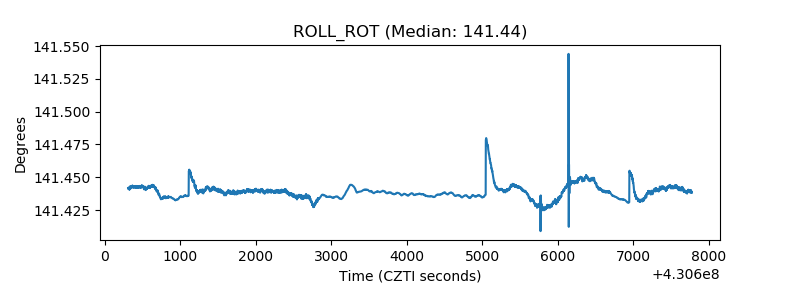 |
| _Roll_DEC | 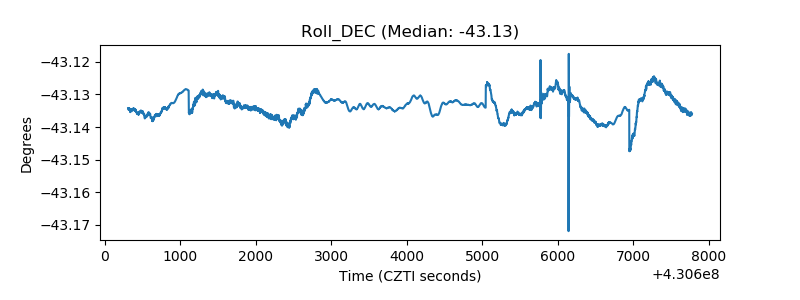 |
| _Roll_RA | 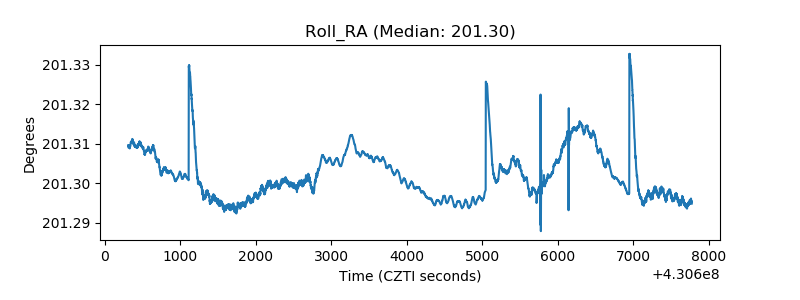 |
| Veto Counter | 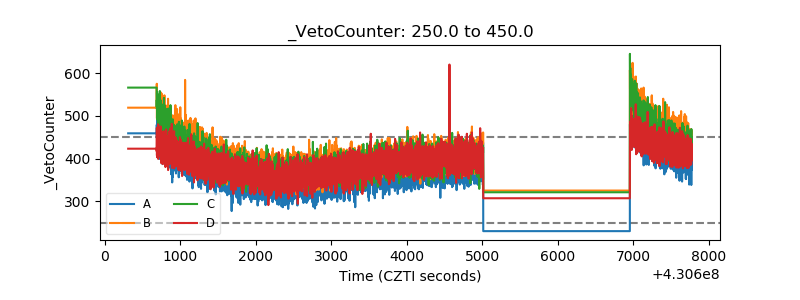 |