| Param | Original file | Final file |
|---|---|---|
| Filename | modeM0/AS1A05_013T01_9000005822_42749cztM0_level2.fits | modeM0/AS1A05_013T01_9000005822_42749cztM0_level2_quad_clean.evt |
| Size (bytes) | 412,764,480 | 90,812,160 |
| Size | 393.6 MB | 86.6 MB |
| Events in quadrant A | 3,014,084 | 639,428 |
| Events in quadrant B | 2,655,266 | 640,118 |
| Events in quadrant C | 6,430,143 | 552,306 |
| Events in quadrant D | 2,788,637 | 565,458 |
| Mode M0 | |||
|---|---|---|---|
| Quadrant | BADHDUFLAG | Total packets | Discarded packets |
| A | 0 | 11984 | 2 |
| B | 0 | 11010 | 2 |
| C | 0 | 22568 | 2 |
| D | 0 | 11701 | 2 |
| Mode M9 | |||
|---|---|---|---|
| Quadrant | BADHDUFLAG | Total packets | Discarded packets |
| A | 0 | 35 | 0 |
| B | 0 | 36 | 0 |
| C | 0 | 36 | 0 |
| D | 0 | 36 | 0 |
| Mode SS | |||
|---|---|---|---|
| Quadrant | BADHDUFLAG | Total packets | Discarded packets |
| A | 0 | 102 | 0 |
| B | 0 | 102 | 0 |
| C | 0 | 102 | 0 |
| D | 0 | 102 | 0 |
| Quadrant | Total seconds | Saturated seconds | Saturation percentage |
|---|---|---|---|
| A | 5032 | 20 | 0.397456% |
| B | 5032 | 88 | 1.748808% |
| C | 5032 | 825 | 16.395072% |
| D | 5032 | 82 | 1.629571% |
Noise dominated data is calculated using 1-second bins in cleaned event files. If a bin has >2000 counts, and if more than 50% of those come from <1% of pixels, then it is considered to be noise-dominated and hence unusable.
| Quadrant | # 1 sec bins | Bins with >0 counts | Bins with >2000 counts | High rate bins dominated by noise | Noise dominated (total time) | Noise dominated (detector-on time) | Marked lightcurve |
|---|---|---|---|---|---|---|---|
| A | 7095 | 5033 | 14 | 14 | 0.20% | 0.28% | 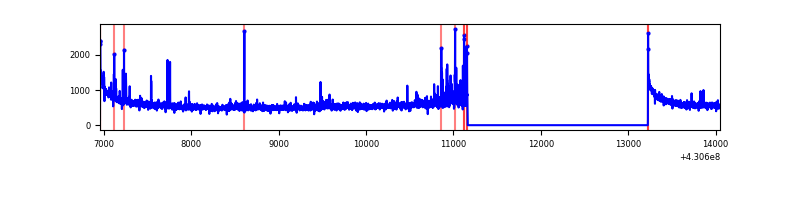 |
| B | 7095 | 5033 | 65 | 65 | 0.92% | 1.29% | 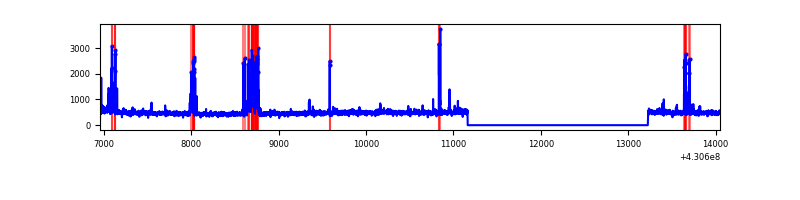 |
| C | 7095 | 5033 | 801 | 801 | 11.29% | 15.91% | 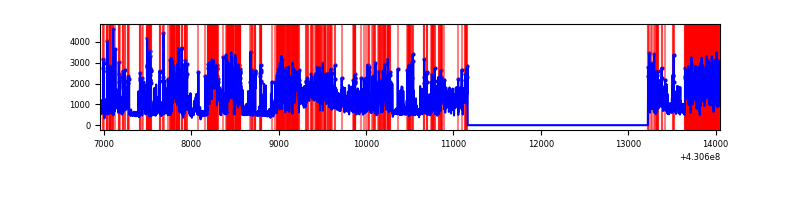 |
| D | 7095 | 5033 | 77 | 77 | 1.09% | 1.53% | 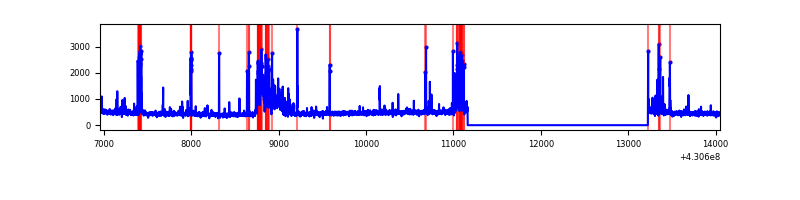 |
Top three noisy pixels from each quadrant. If the there are fewer than three noisy pixels in the level2.evt file, extra rows are filled as -1
| Pixel properties | Quadrant properties | ||||||
|---|---|---|---|---|---|---|---|
| Quadrant | DetID | PixID | Counts | Sigma | Mean | Median | Sigma |
| A | 10 | 83 | 519643 | 4286.94 | 598 | 588 | 121.1 |
| A | 13 | 248 | 96311 | 790.59 | 598 | 588 | 121.1 |
| A | 12 | 189 | 56574 | 462.4 | 598 | 588 | 121.1 |
| B | 5 | 172 | 187456 | 1660.14 | 590 | 576 | 112.6 |
| B | 0 | 156 | 82318 | 726.15 | 590 | 576 | 112.6 |
| B | 0 | 229 | 34259 | 299.22 | 590 | 576 | 112.6 |
| C | 0 | 239 | 4038956 | 31654.6 | 553 | 558 | 127.6 |
| C | 15 | 214 | 200742 | 1569.12 | 553 | 558 | 127.6 |
| C | 14 | 254 | 17510 | 132.88 | 553 | 558 | 127.6 |
| D | 12 | 6 | 279531 | 1980.79 | 577 | 561 | 140.8 |
| D | 12 | 233 | 112636 | 795.77 | 577 | 561 | 140.8 |
| D | 7 | 96 | 56215 | 395.16 | 577 | 561 | 140.8 |
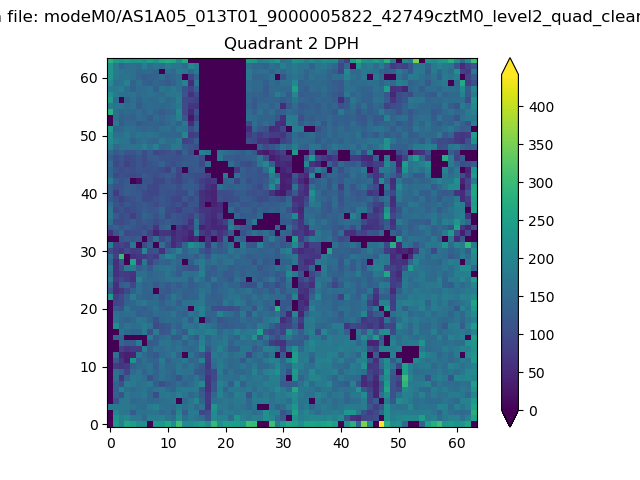
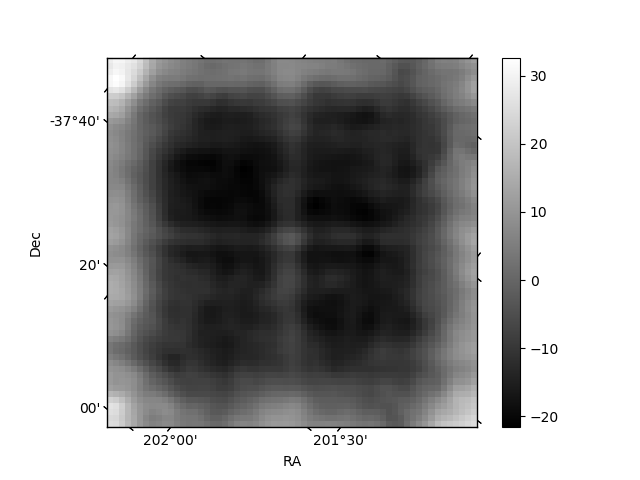
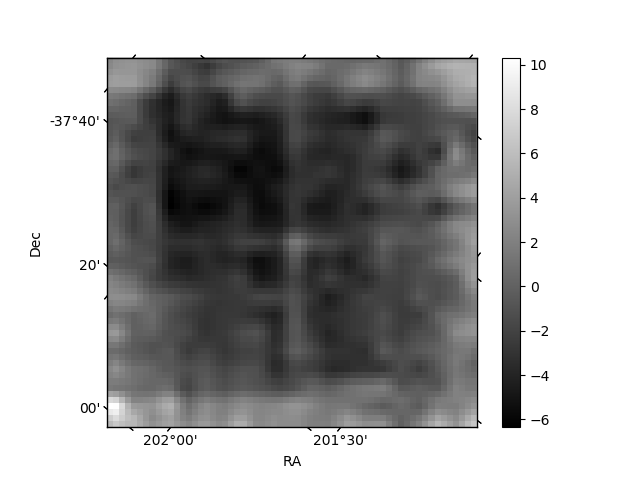
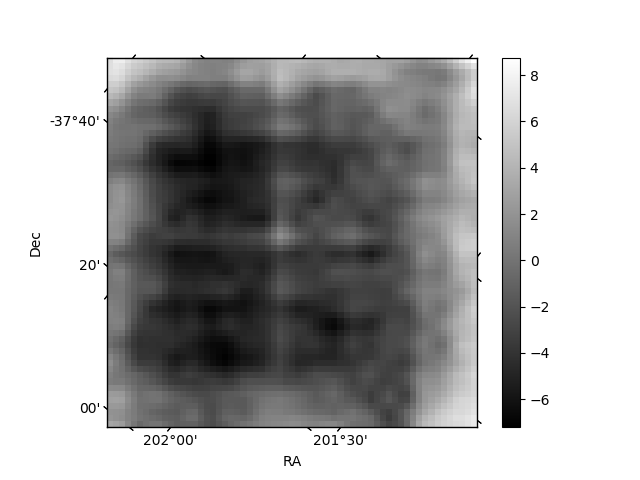
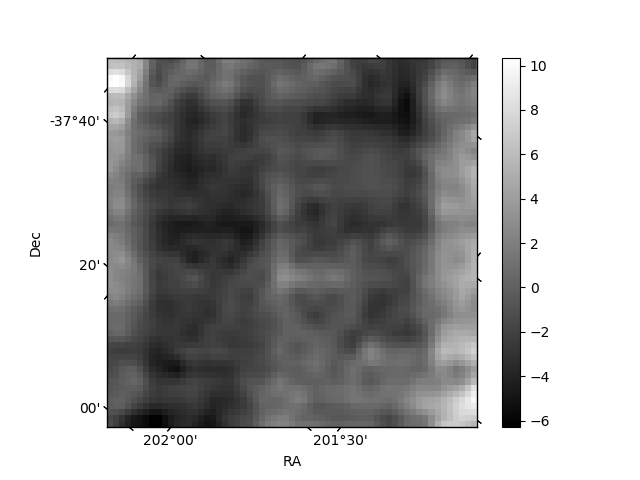
Histogram calculated using DETX and DETY for each event in the final _common_clean file
| Quadrant A | 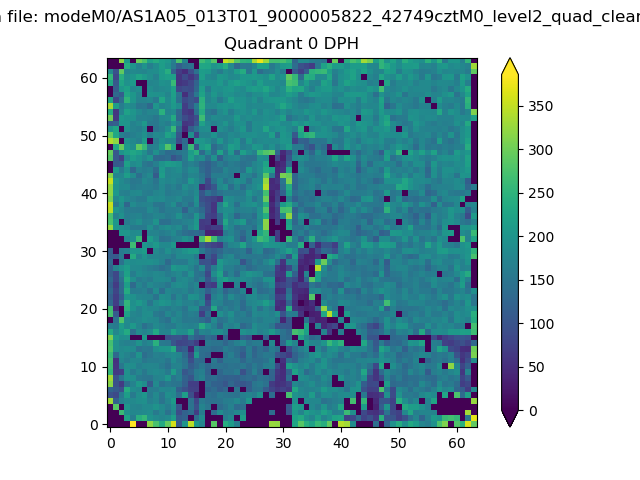 |
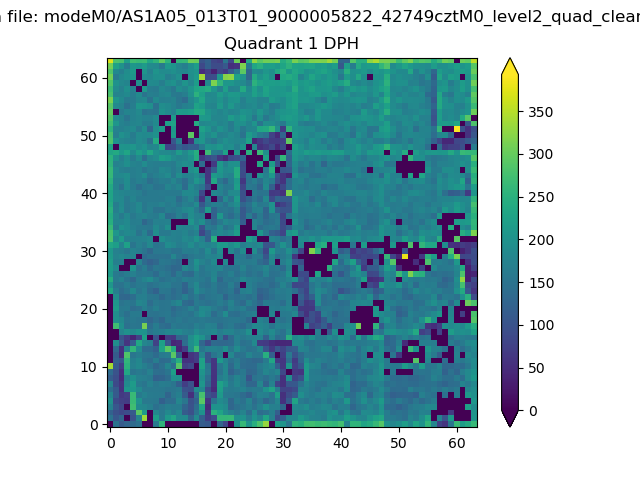 |
Quadrant B |
|---|---|---|---|
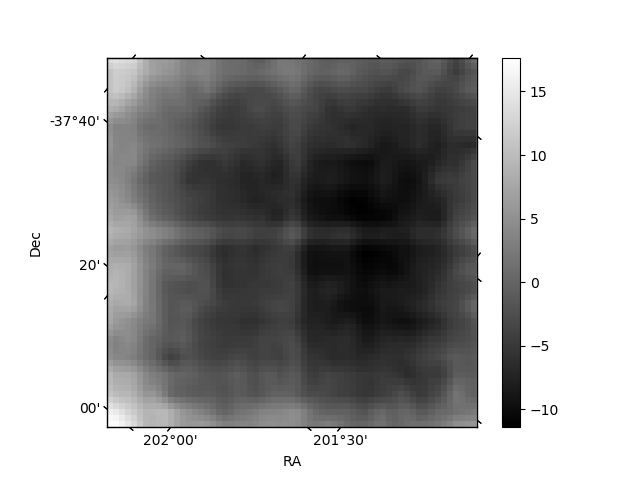
| Quadrant D | 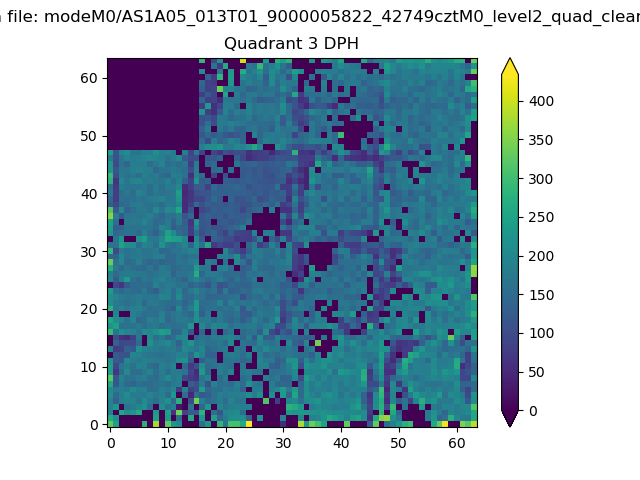 |
 |
Quadrant C |
| Plot type | Count rate plots | Images |
|---|---|---|
| Comparison with Poisson distribution Blue bars denote a histogram of data divided into 1 sec bins. Red curve is a Poisson curve with rate = median count rate of data. |
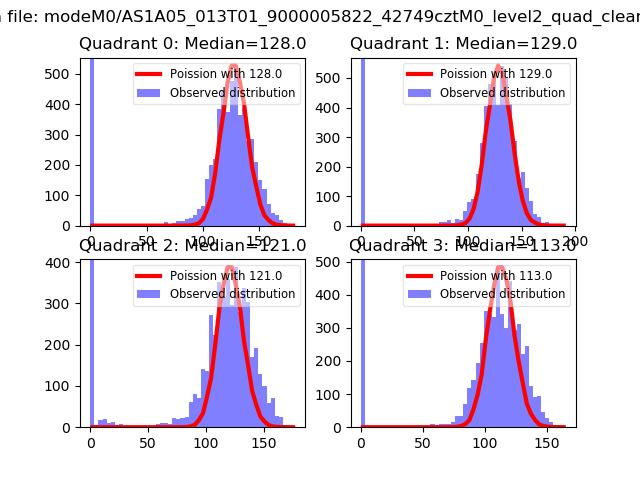 |
 |
| Quadrant-wise count rates Data is divided into 100 sec bins |
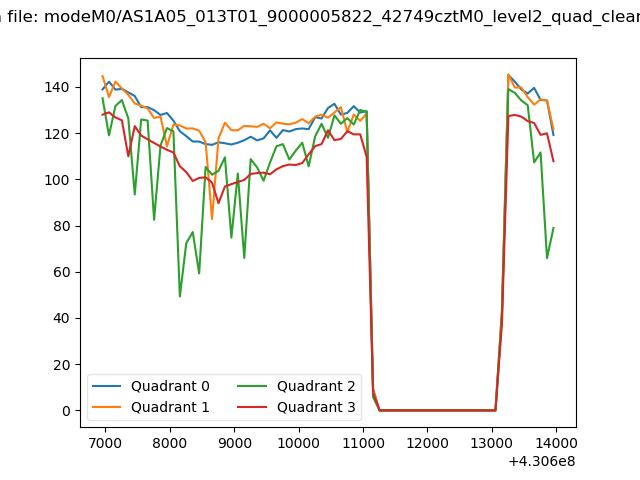 |
|
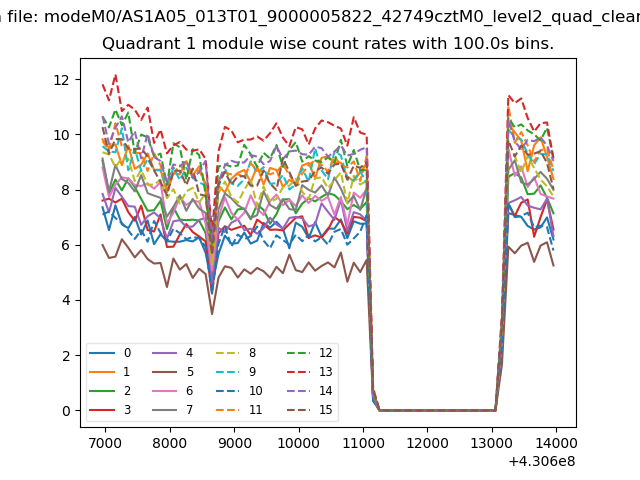
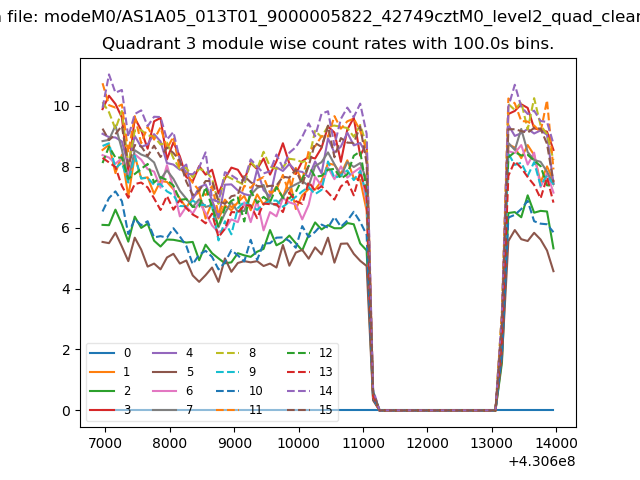
| Module-wise count rates for Quadrant A Data is divided into 100 sec bins |
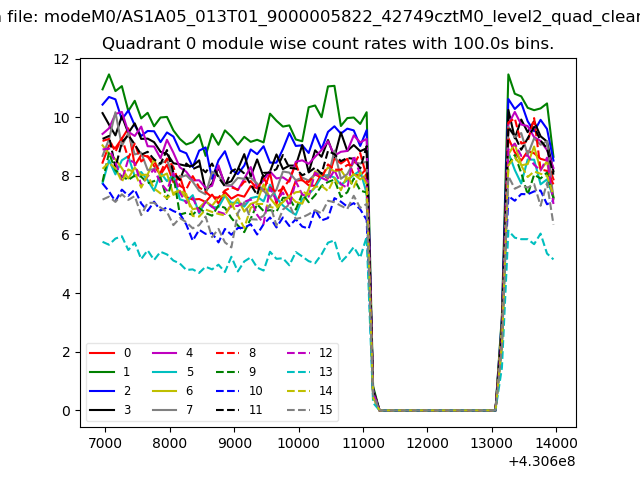 |
 |
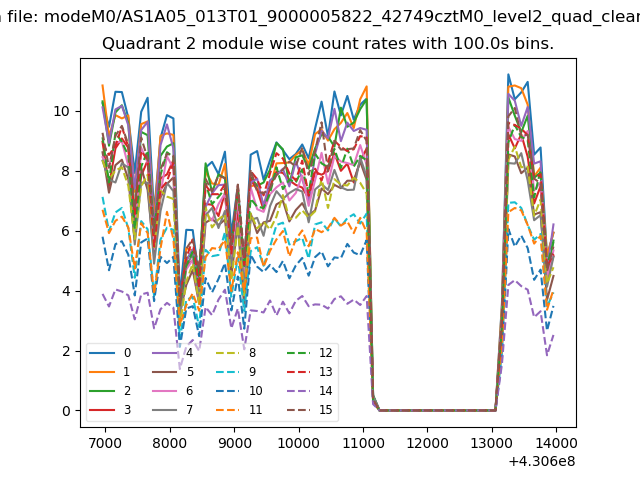
| Module-wise count rates for Quadrant B Data is divided into 100 sec bins |
 |
 |
| Module-wise count rates for Quadrant C Data is divided into 100 sec bins |
 |
 |
| Module-wise count rates for Quadrant D Data is divided into 100 sec bins |
 |
 |
| Parameter | Plot |
|---|---|
| CZT HV Monitor | 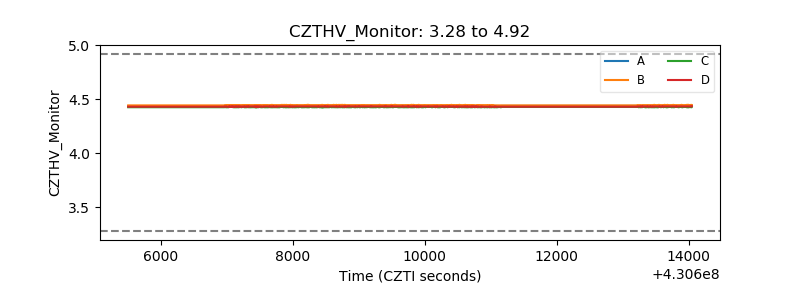 |
| D_VDD | 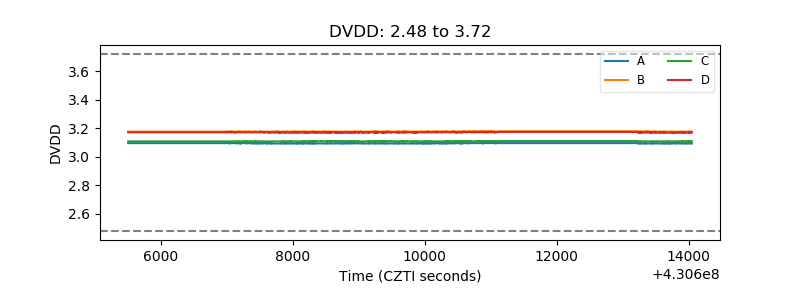 |
| Temperature 1 | 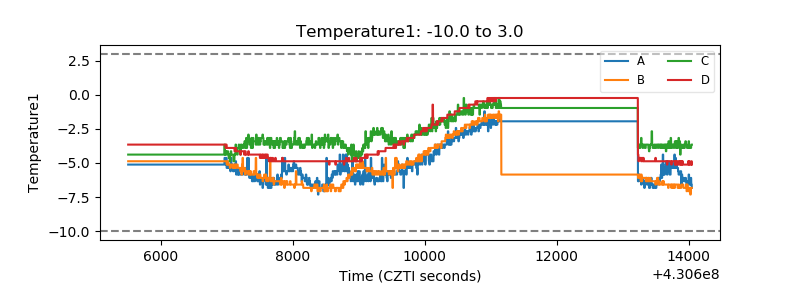 |
| Veto HV Monitor | 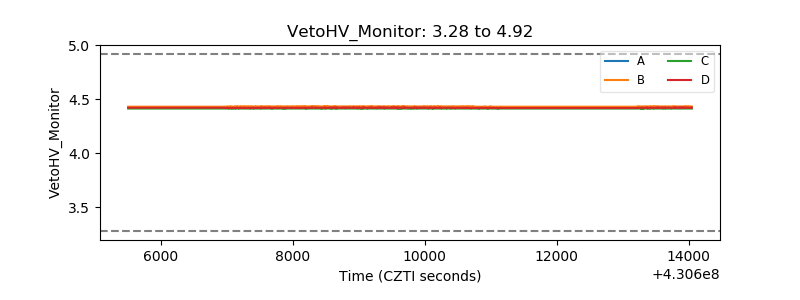 |
| Veto LLD | 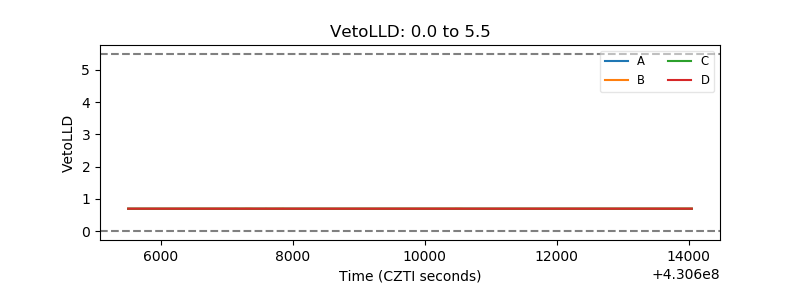 |
| Alpha Counter | 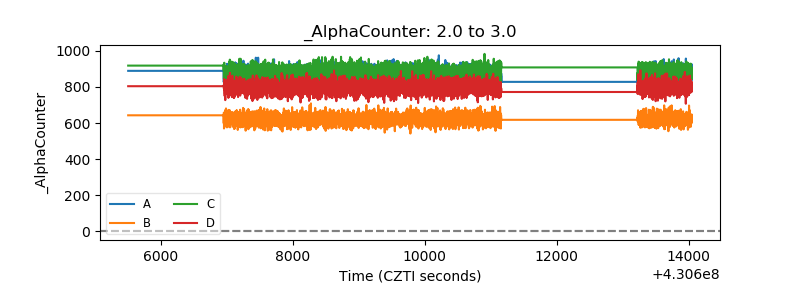 |
| _CPM_Rate | 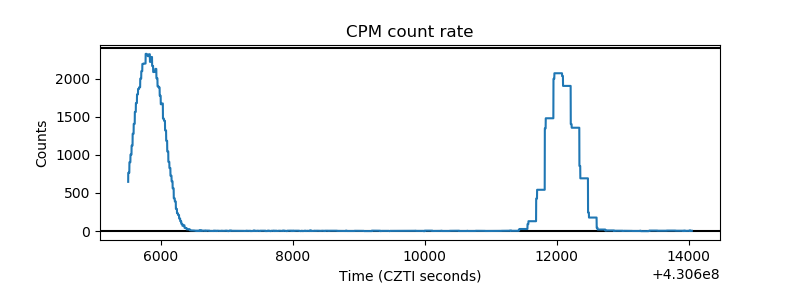 |
| CZT Counter | 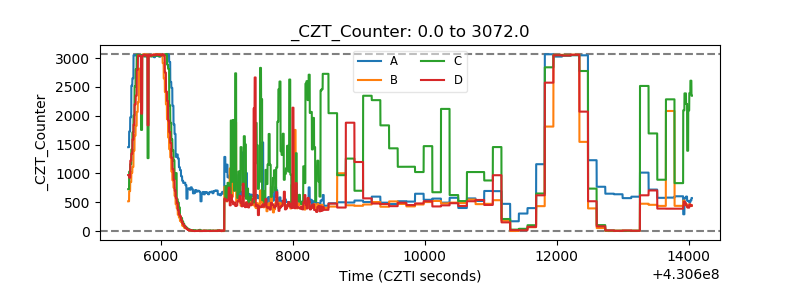 |
| +2.5 Volts monitor | 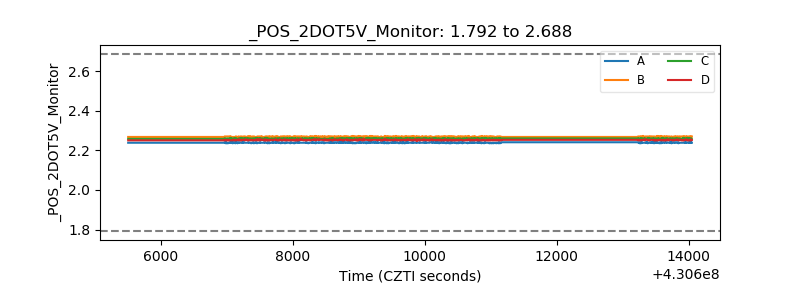 |
| +5 Volts monitor | 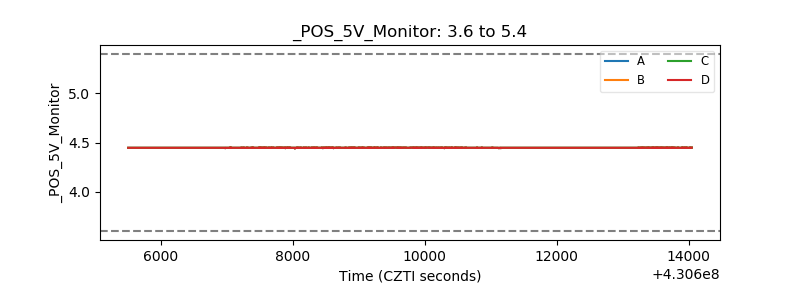 |
| _ROLL_ROT | 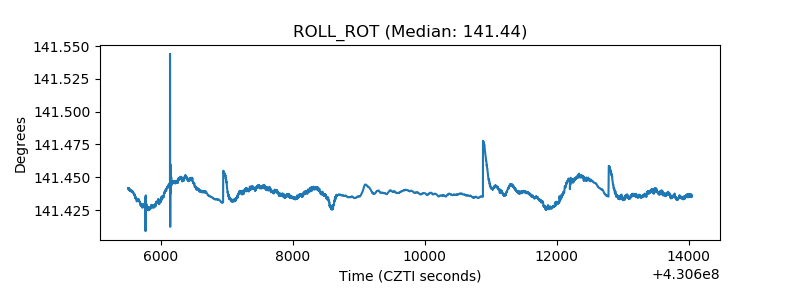 |
| _Roll_DEC | 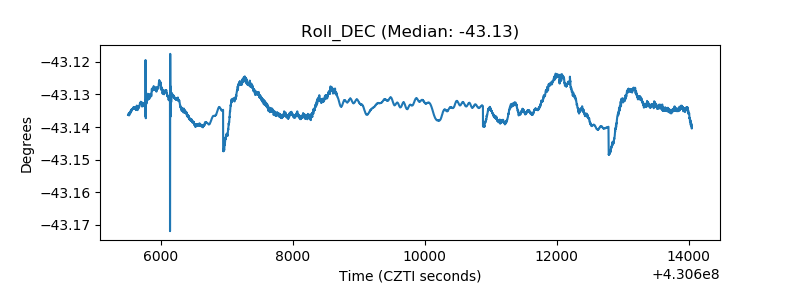 |
| _Roll_RA | 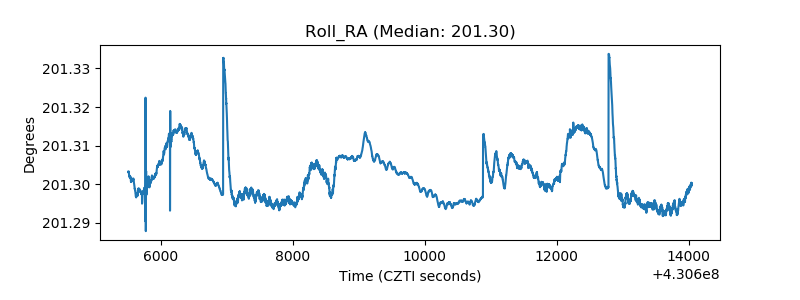 |
| Veto Counter | 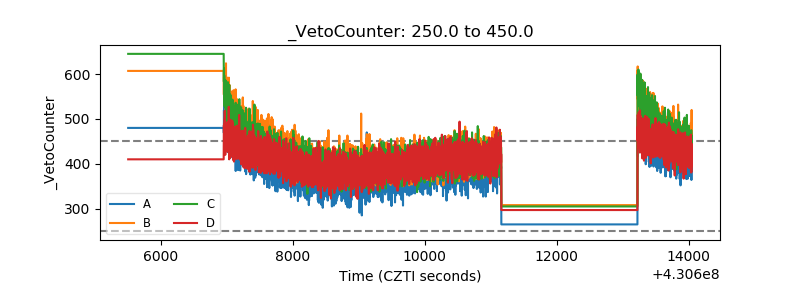 |