| Param | Original file | Final file |
|---|---|---|
| Filename | modeM0/AS1A05_013T01_9000005822_42750cztM0_level2.fits | modeM0/AS1A05_013T01_9000005822_42750cztM0_level2_quad_clean.evt |
| Size (bytes) | 381,424,320 | 90,158,400 |
| Size | 363.8 MB | 86.0 MB |
| Events in quadrant A | 3,038,754 | 622,424 |
| Events in quadrant B | 2,467,815 | 633,286 |
| Events in quadrant C | 5,696,254 | 570,013 |
| Events in quadrant D | 2,531,017 | 557,196 |
| Mode M0 | |||
|---|---|---|---|
| Quadrant | BADHDUFLAG | Total packets | Discarded packets |
| A | 0 | 12016 | 2 |
| B | 0 | 10390 | 2 |
| C | 0 | 20445 | 2 |
| D | 0 | 10913 | 2 |
| Mode M9 | |||
|---|---|---|---|
| Quadrant | BADHDUFLAG | Total packets | Discarded packets |
| A | 0 | 37 | 0 |
| B | 0 | 38 | 0 |
| C | 0 | 38 | 0 |
| D | 0 | 38 | 0 |
| Mode SS | |||
|---|---|---|---|
| Quadrant | BADHDUFLAG | Total packets | Discarded packets |
| A | 0 | 100 | 0 |
| B | 0 | 100 | 0 |
| C | 0 | 100 | 0 |
| D | 0 | 100 | 0 |
| Quadrant | Total seconds | Saturated seconds | Saturation percentage |
|---|---|---|---|
| A | 4955 | 41 | 0.827447% |
| B | 4955 | 52 | 1.049445% |
| C | 4955 | 516 | 10.413724% |
| D | 4955 | 60 | 1.210898% |
Noise dominated data is calculated using 1-second bins in cleaned event files. If a bin has >2000 counts, and if more than 50% of those come from <1% of pixels, then it is considered to be noise-dominated and hence unusable.
| Quadrant | # 1 sec bins | Bins with >0 counts | Bins with >2000 counts | High rate bins dominated by noise | Noise dominated (total time) | Noise dominated (detector-on time) | Marked lightcurve |
|---|---|---|---|---|---|---|---|
| A | 7078 | 4955 | 26 | 26 | 0.37% | 0.52% | 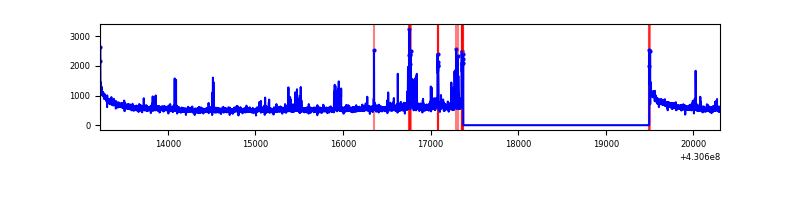 |
| B | 7078 | 4956 | 42 | 42 | 0.59% | 0.85% | 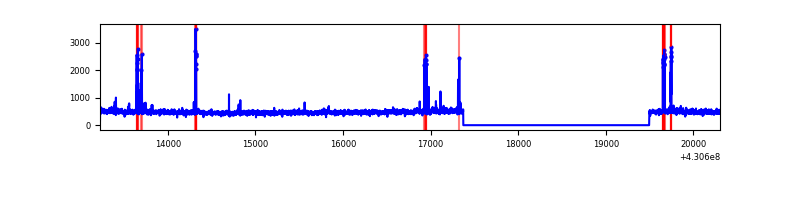 |
| C | 7078 | 4956 | 528 | 528 | 7.46% | 10.65% | 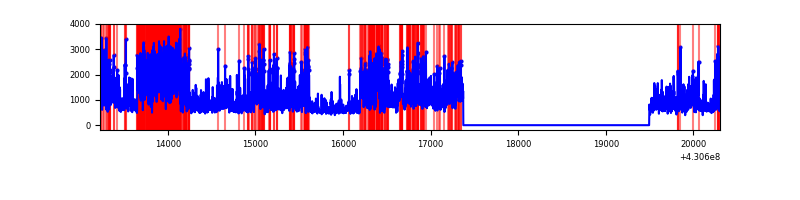 |
| D | 7078 | 4956 | 49 | 49 | 0.69% | 0.99% | 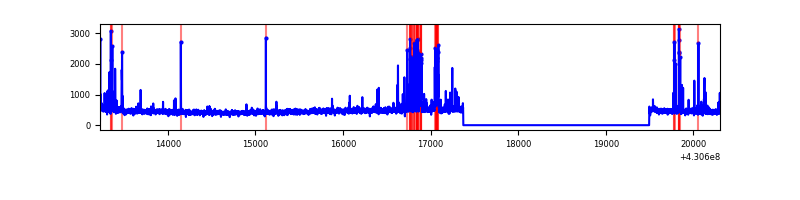 |
Top three noisy pixels from each quadrant. If the there are fewer than three noisy pixels in the level2.evt file, extra rows are filled as -1
| Pixel properties | Quadrant properties | ||||||
|---|---|---|---|---|---|---|---|
| Quadrant | DetID | PixID | Counts | Sigma | Mean | Median | Sigma |
| A | 10 | 83 | 516623 | 4299.51 | 588 | 578 | 120.0 |
| A | 13 | 248 | 175710 | 1459.14 | 588 | 578 | 120.0 |
| A | 12 | 189 | 31387 | 256.69 | 588 | 578 | 120.0 |
| B | 5 | 172 | 112745 | 994.74 | 583 | 569 | 112.8 |
| B | 0 | 156 | 38195 | 333.66 | 583 | 569 | 112.8 |
| B | 12 | 111 | 13770 | 117.06 | 583 | 569 | 112.8 |
| C | 0 | 239 | 3270986 | 25374.99 | 560 | 562 | 128.9 |
| C | 15 | 214 | 201815 | 1561.51 | 560 | 562 | 128.9 |
| C | 14 | 254 | 27304 | 207.49 | 560 | 562 | 128.9 |
| D | 2 | 249 | 167779 | 1210.01 | 572 | 557 | 138.2 |
| D | 12 | 233 | 41263 | 294.55 | 572 | 557 | 138.2 |
| D | 12 | 6 | 38522 | 274.71 | 572 | 557 | 138.2 |
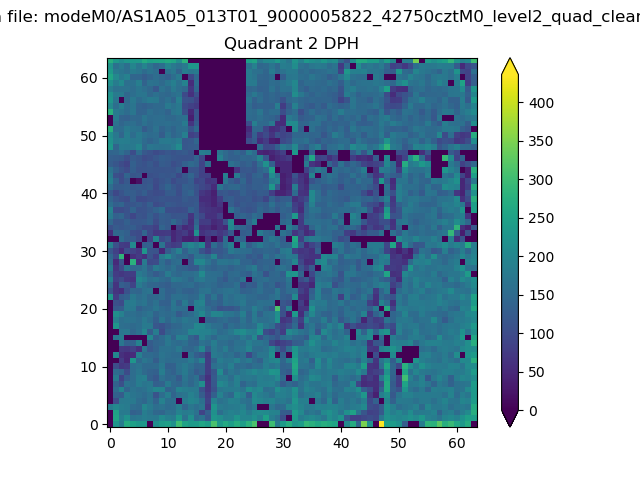
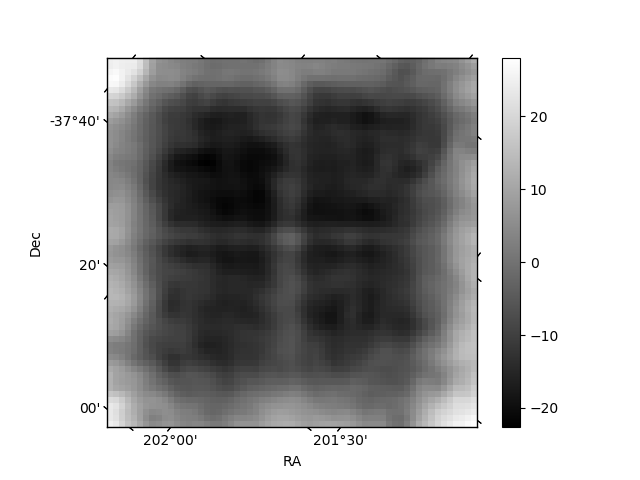
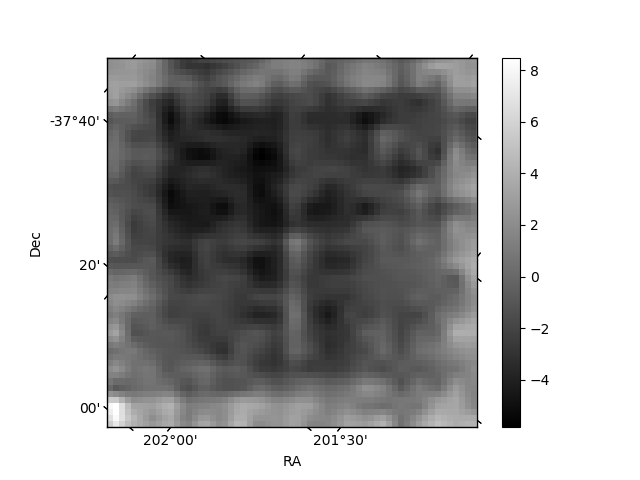
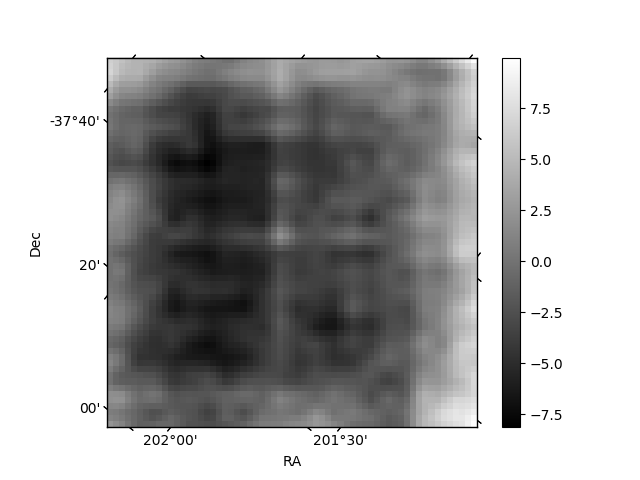
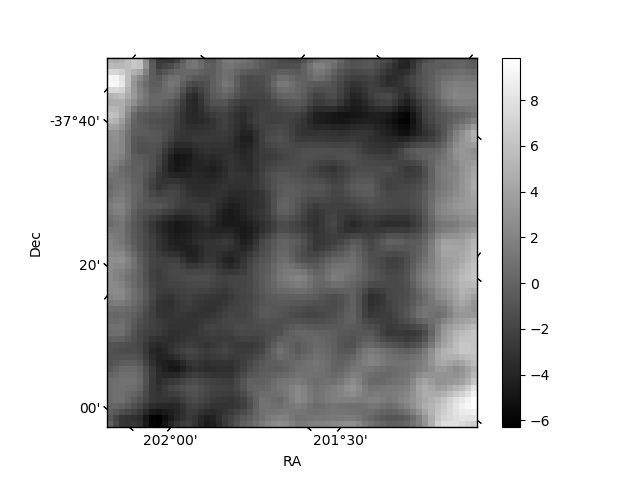
Histogram calculated using DETX and DETY for each event in the final _common_clean file
| Quadrant A | 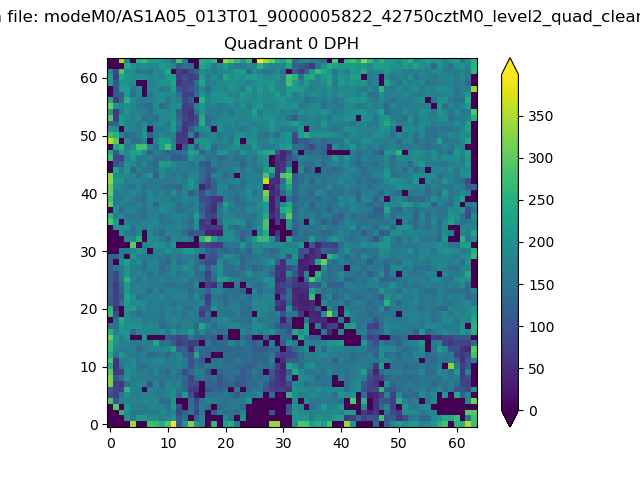 |
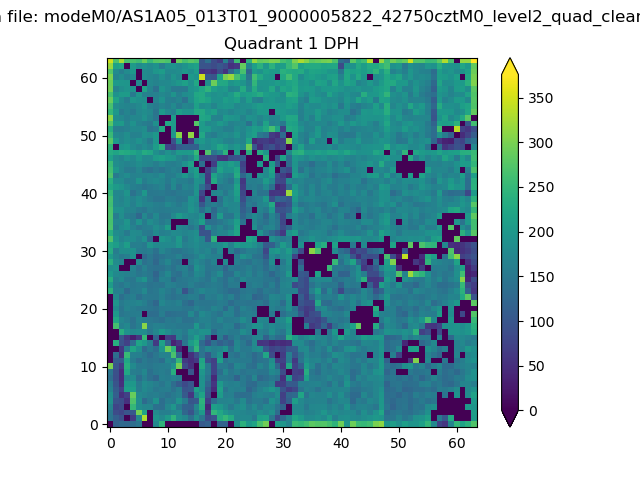 |
Quadrant B |
|---|---|---|---|
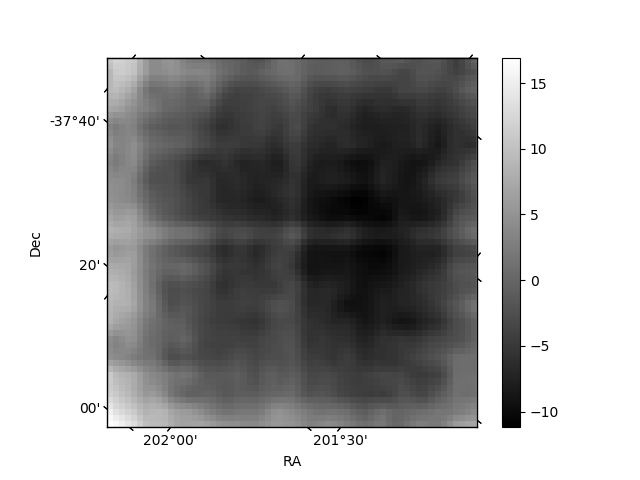
| Quadrant D | 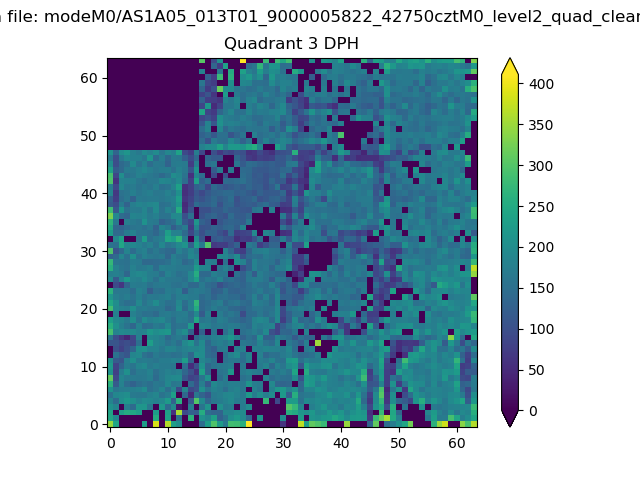 |
 |
Quadrant C |
| Plot type | Count rate plots | Images |
|---|---|---|
| Comparison with Poisson distribution Blue bars denote a histogram of data divided into 1 sec bins. Red curve is a Poisson curve with rate = median count rate of data. |
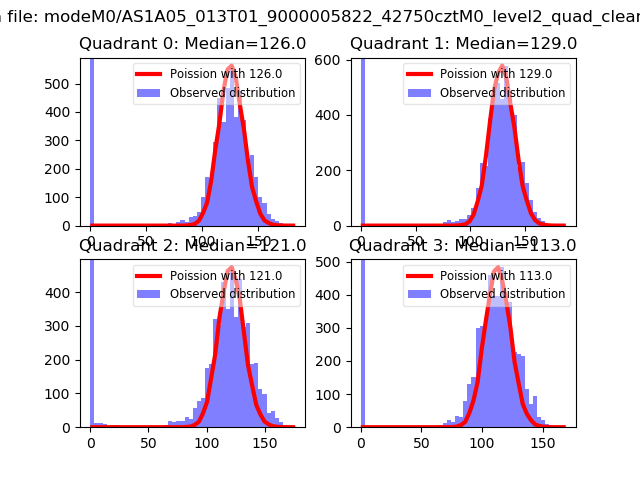 |
 |
| Quadrant-wise count rates Data is divided into 100 sec bins |
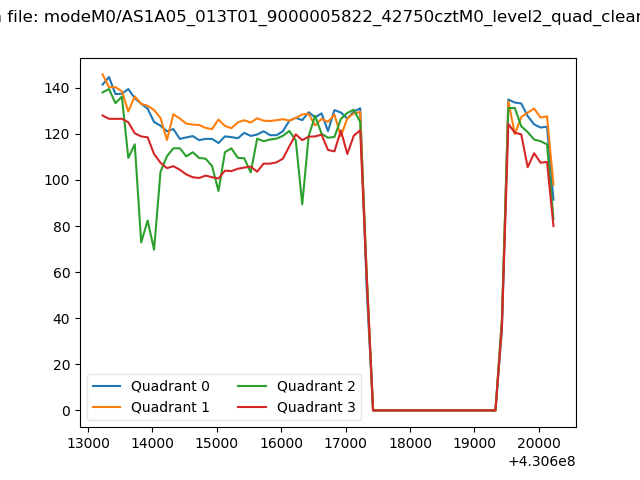 |
|
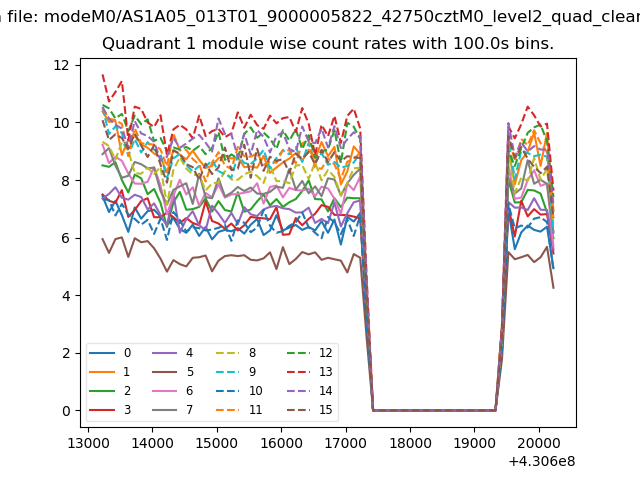
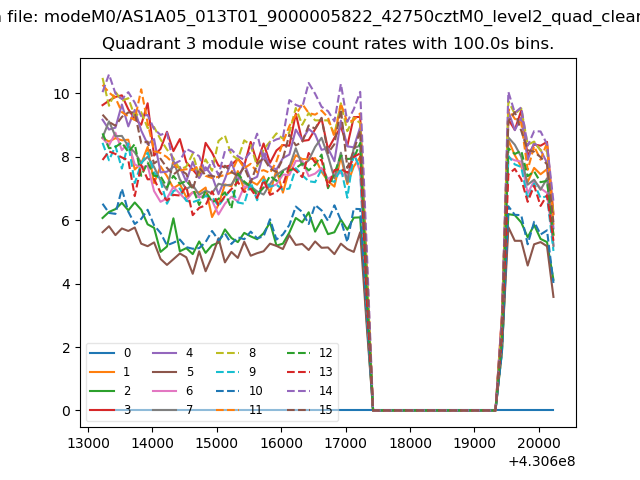
| Module-wise count rates for Quadrant A Data is divided into 100 sec bins |
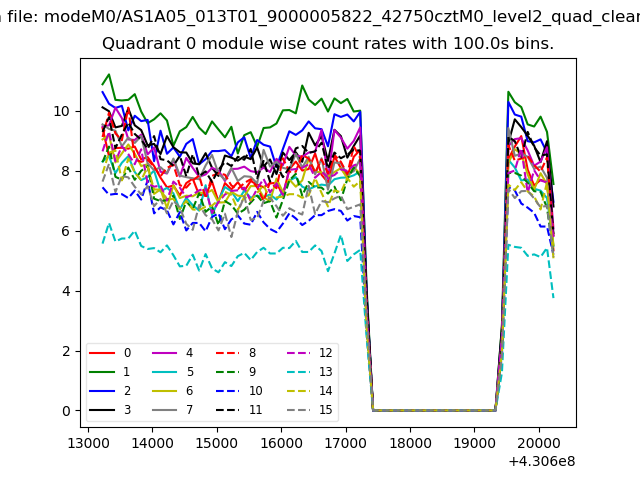 |
 |
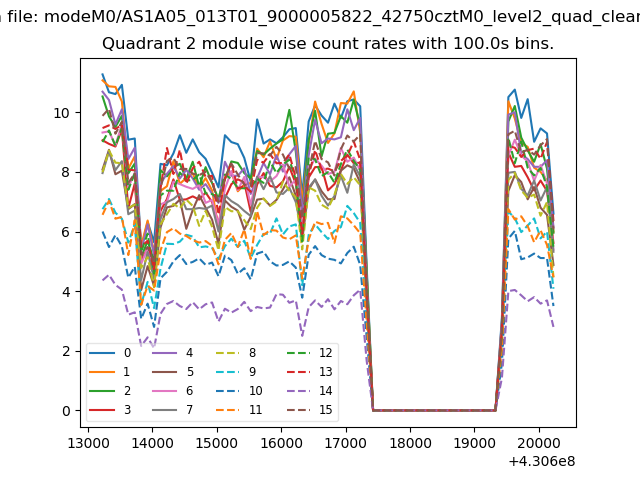
| Module-wise count rates for Quadrant B Data is divided into 100 sec bins |
 |
 |
| Module-wise count rates for Quadrant C Data is divided into 100 sec bins |
 |
 |
| Module-wise count rates for Quadrant D Data is divided into 100 sec bins |
 |
 |
| Parameter | Plot |
|---|---|
| CZT HV Monitor | 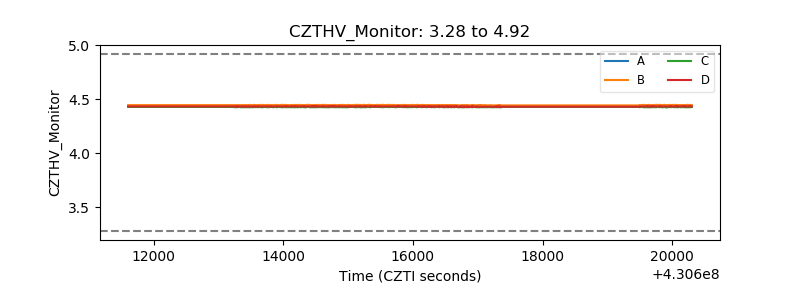 |
| D_VDD | 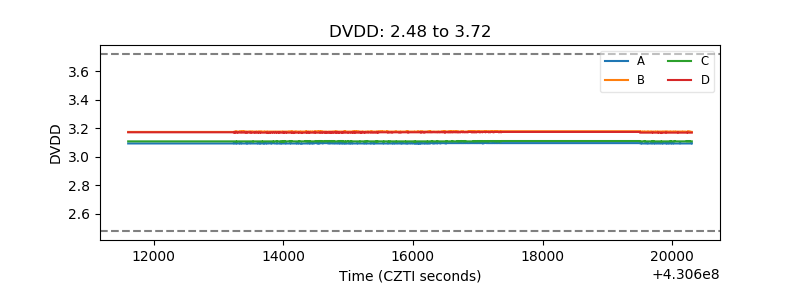 |
| Temperature 1 | 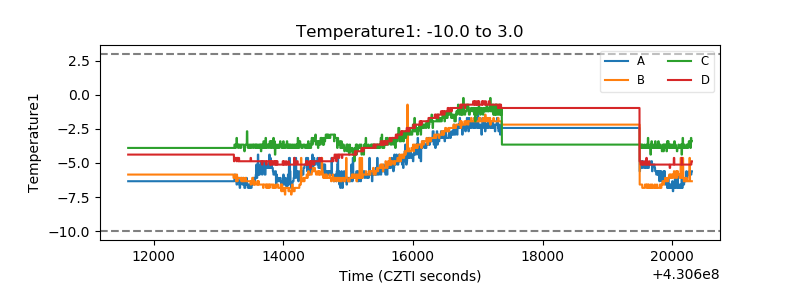 |
| Veto HV Monitor |  |
| Veto LLD | 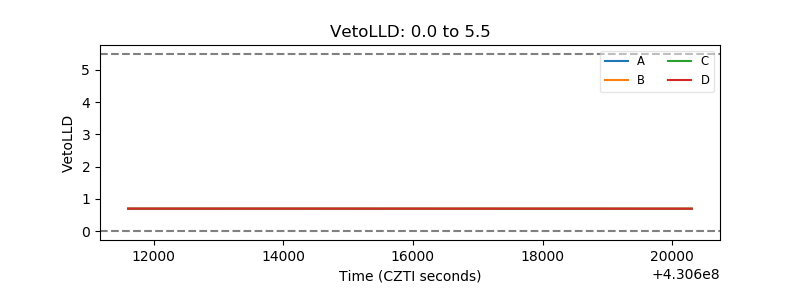 |
| Alpha Counter | 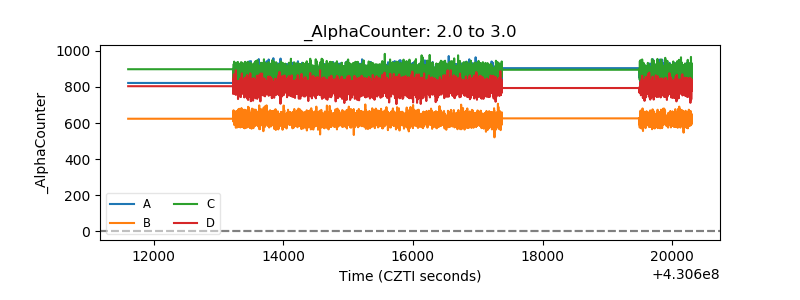 |
| _CPM_Rate | 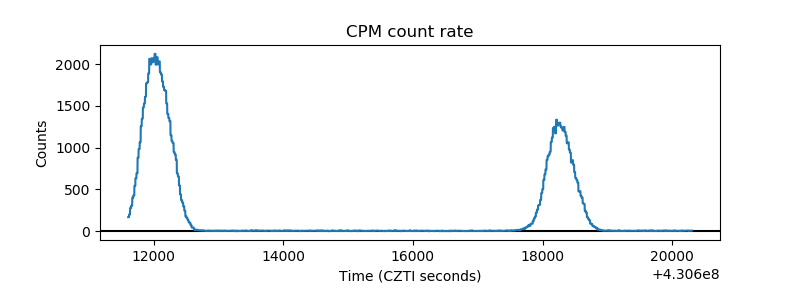 |
| CZT Counter | 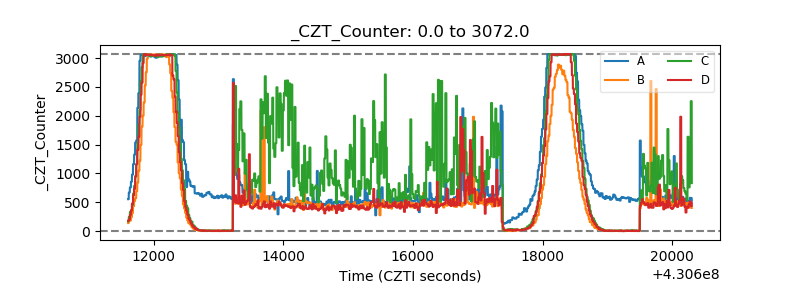 |
| +2.5 Volts monitor | 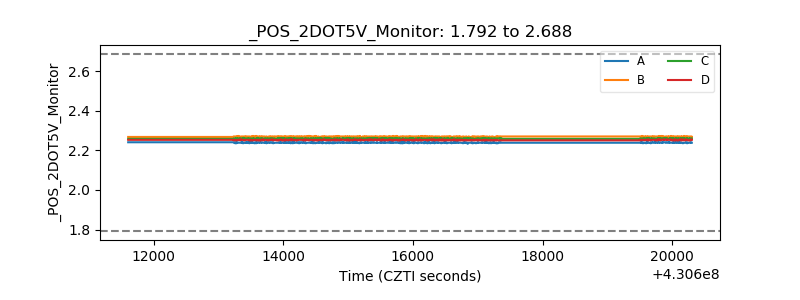 |
| +5 Volts monitor | 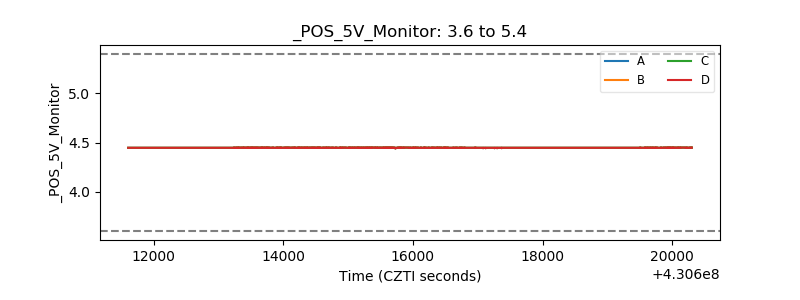 |
| _ROLL_ROT | 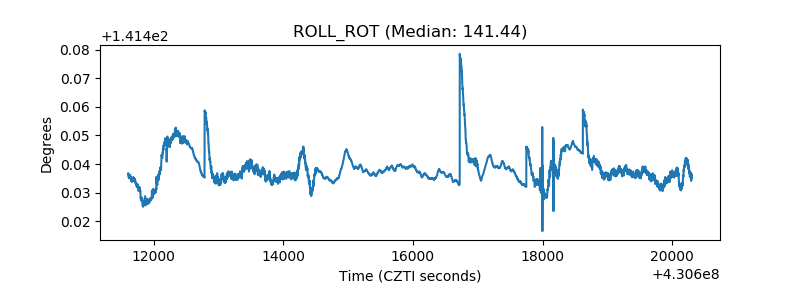 |
| _Roll_DEC | 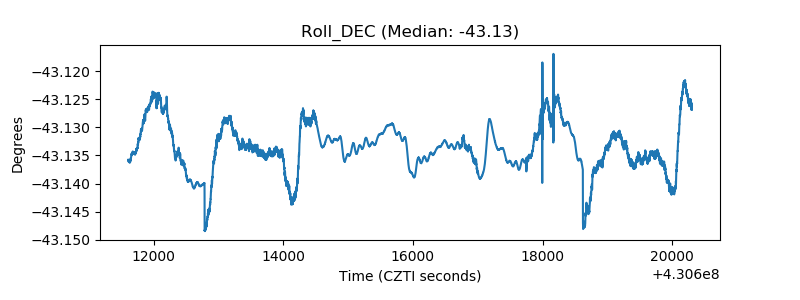 |
| _Roll_RA | 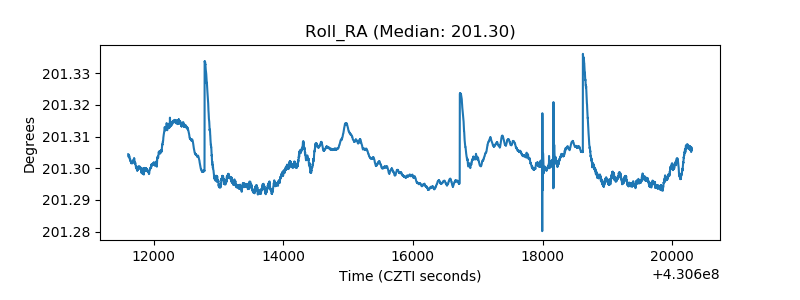 |
| Veto Counter | 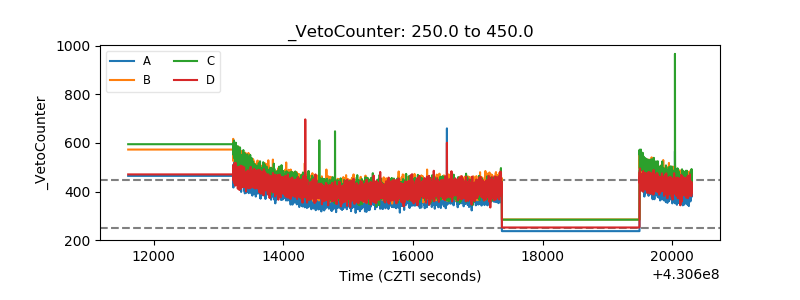 |