| Param | Original file | Final file |
|---|---|---|
| Filename | modeM0/AS1A05_013T01_9000005822_42751cztM0_level2.fits | modeM0/AS1A05_013T01_9000005822_42751cztM0_level2_quad_clean.evt |
| Size (bytes) | 357,744,960 | 92,439,360 |
| Size | 341.2 MB | 88.2 MB |
| Events in quadrant A | 3,200,986 | 628,433 |
| Events in quadrant B | 2,704,232 | 641,057 |
| Events in quadrant C | 4,088,743 | 608,930 |
| Events in quadrant D | 2,843,787 | 555,789 |
| Mode M0 | |||
|---|---|---|---|
| Quadrant | BADHDUFLAG | Total packets | Discarded packets |
| A | 0 | 12639 | 2 |
| B | 0 | 11375 | 2 |
| C | 0 | 15765 | 2 |
| D | 0 | 12030 | 2 |
| Mode M9 | |||
|---|---|---|---|
| Quadrant | BADHDUFLAG | Total packets | Discarded packets |
| A | 0 | 29 | 0 |
| B | 0 | 30 | 0 |
| C | 0 | 30 | 0 |
| D | 0 | 30 | 0 |
| Mode SS | |||
|---|---|---|---|
| Quadrant | BADHDUFLAG | Total packets | Discarded packets |
| A | 0 | 108 | 0 |
| B | 0 | 108 | 0 |
| C | 0 | 108 | 0 |
| D | 0 | 108 | 0 |
| Quadrant | Total seconds | Saturated seconds | Saturation percentage |
|---|---|---|---|
| A | 5205 | 44 | 0.845341% |
| B | 5205 | 47 | 0.902978% |
| C | 5205 | 93 | 1.786744% |
| D | 5205 | 121 | 2.324688% |
Noise dominated data is calculated using 1-second bins in cleaned event files. If a bin has >2000 counts, and if more than 50% of those come from <1% of pixels, then it is considered to be noise-dominated and hence unusable.
| Quadrant | # 1 sec bins | Bins with >0 counts | Bins with >2000 counts | High rate bins dominated by noise | Noise dominated (total time) | Noise dominated (detector-on time) | Marked lightcurve |
|---|---|---|---|---|---|---|---|
| A | 7358 | 5206 | 33 | 33 | 0.45% | 0.63% | 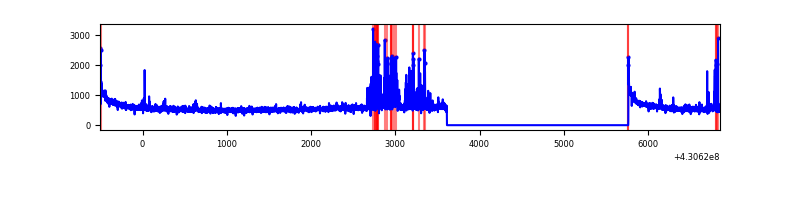 |
| B | 7358 | 5206 | 26 | 26 | 0.35% | 0.50% | 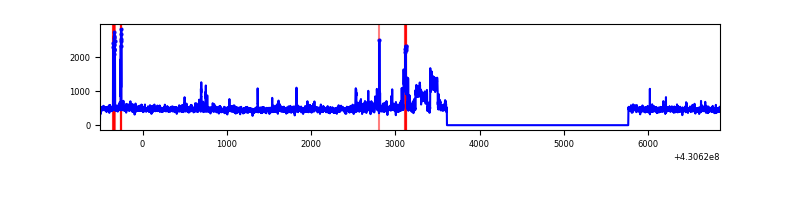 |
| C | 7358 | 5206 | 74 | 74 | 1.01% | 1.42% | 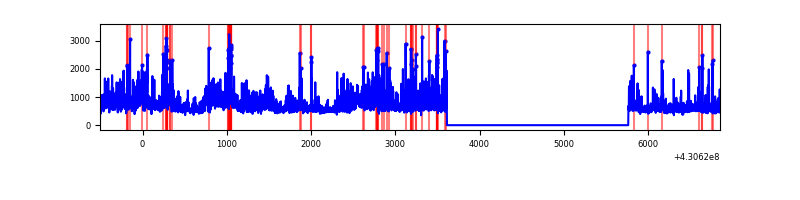 |
| D | 7358 | 5206 | 114 | 114 | 1.55% | 2.19% | 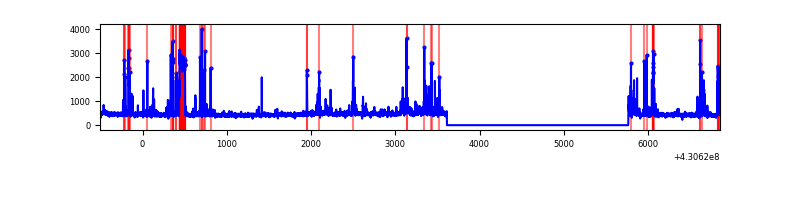 |
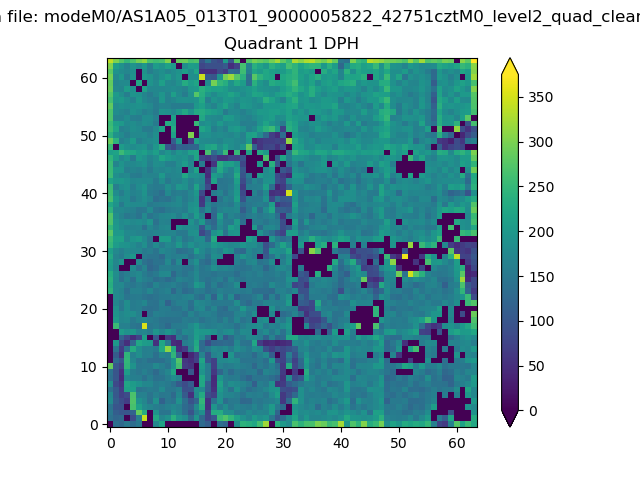
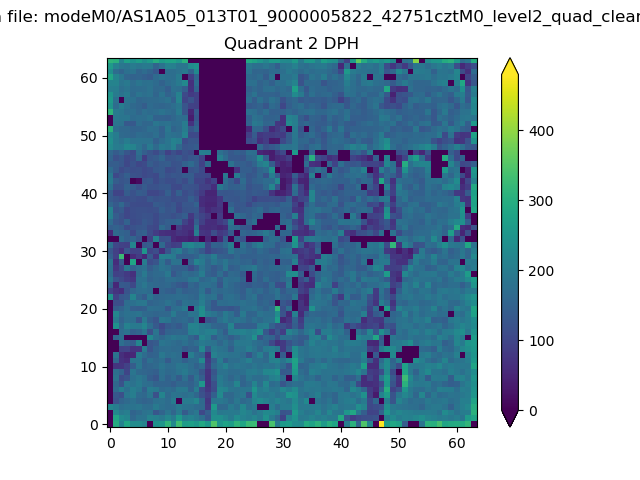
Top three noisy pixels from each quadrant. If the there are fewer than three noisy pixels in the level2.evt file, extra rows are filled as -1
| Pixel properties | Quadrant properties | ||||||
|---|---|---|---|---|---|---|---|
| Quadrant | DetID | PixID | Counts | Sigma | Mean | Median | Sigma |
| A | 10 | 83 | 557353 | 4505.86 | 604 | 595 | 123.6 |
| A | 13 | 248 | 231781 | 1870.99 | 604 | 595 | 123.6 |
| A | 12 | 189 | 60422 | 484.18 | 604 | 595 | 123.6 |
| B | 10 | 246 | 242538 | 2120.52 | 600 | 586 | 114.1 |
| B | 5 | 172 | 86401 | 752.1 | 600 | 586 | 114.1 |
| B | 12 | 111 | 14275 | 119.97 | 600 | 586 | 114.1 |
| C | 0 | 239 | 1480836 | 10772.49 | 590 | 593 | 137.4 |
| C | 15 | 214 | 215706 | 1565.49 | 590 | 593 | 137.4 |
| C | 12 | 249 | 44655 | 320.66 | 590 | 593 | 137.4 |
| D | 12 | 6 | 356489 | 2504.75 | 586 | 572 | 142.1 |
| D | 12 | 233 | 73730 | 514.85 | 586 | 572 | 142.1 |
| D | 2 | 249 | 72918 | 509.13 | 586 | 572 | 142.1 |
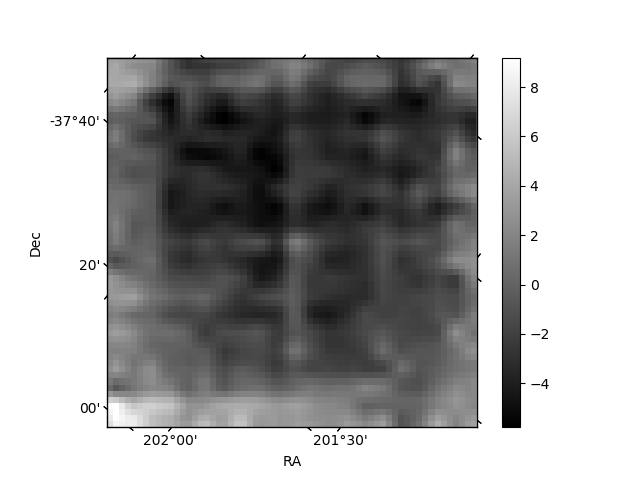
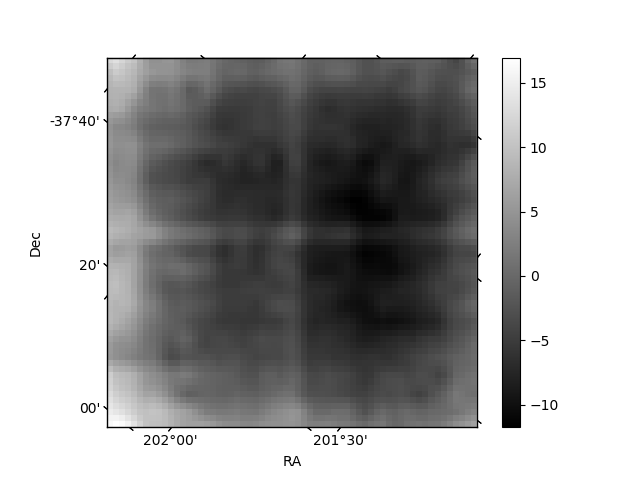
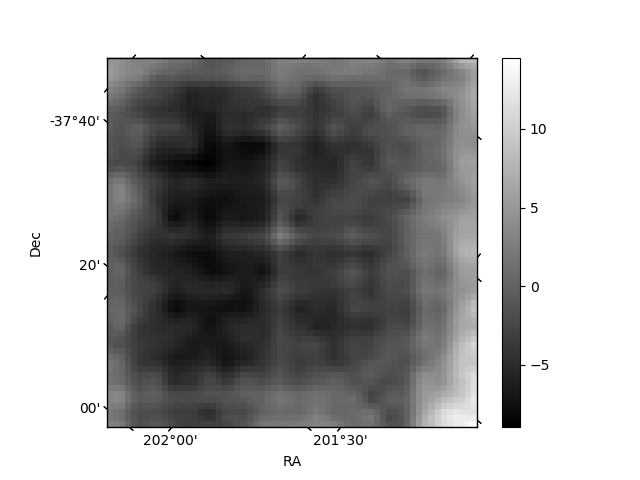
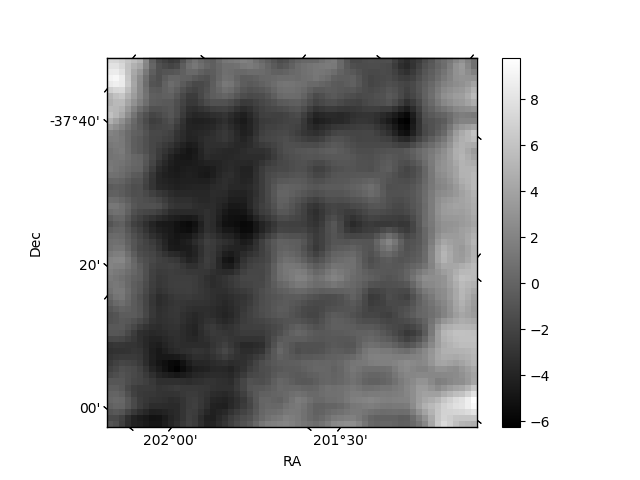
Histogram calculated using DETX and DETY for each event in the final _common_clean file
| Quadrant A | 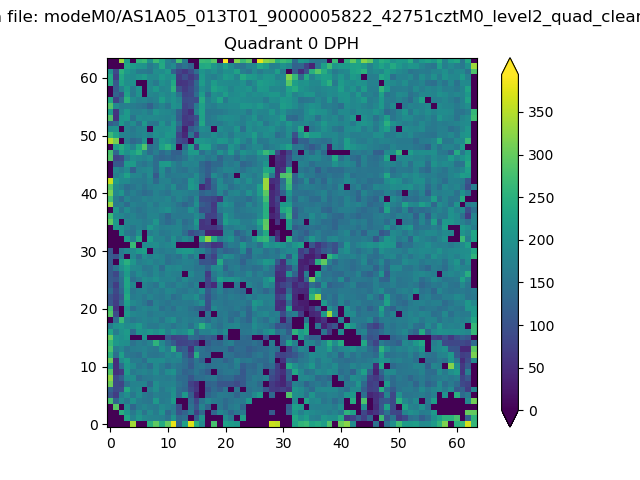 |
 |
Quadrant B |
|---|---|---|---|
| Quadrant D | 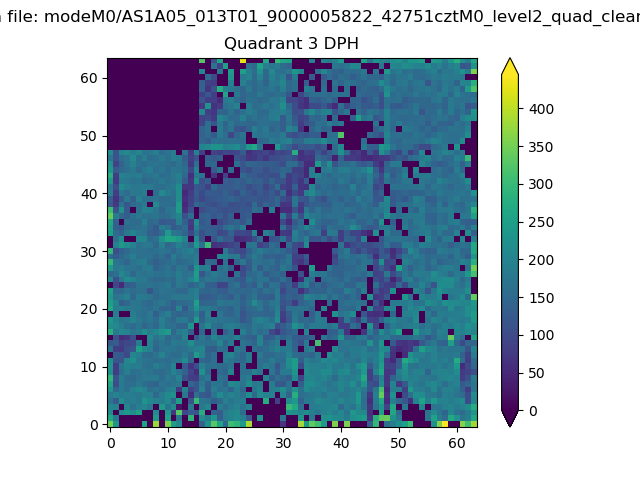 |
 |
Quadrant C |
| Plot type | Count rate plots | Images |
|---|---|---|
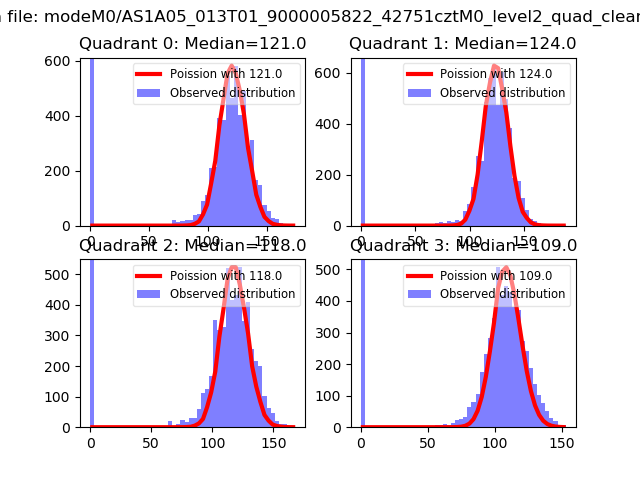
| Comparison with Poisson distribution Blue bars denote a histogram of data divided into 1 sec bins. Red curve is a Poisson curve with rate = median count rate of data. |
 |
 |
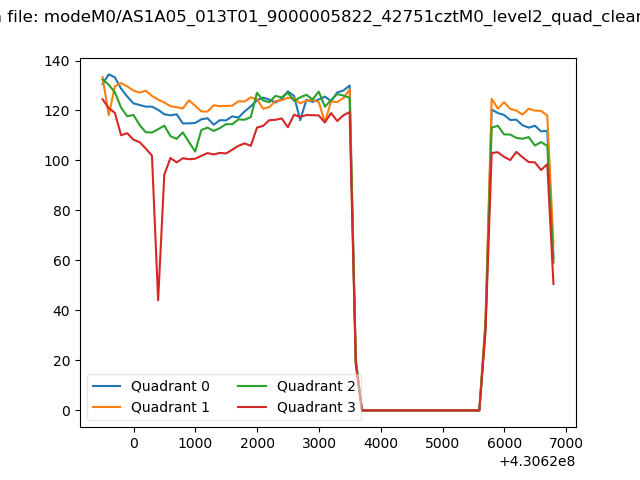
| Quadrant-wise count rates Data is divided into 100 sec bins |
 |
|
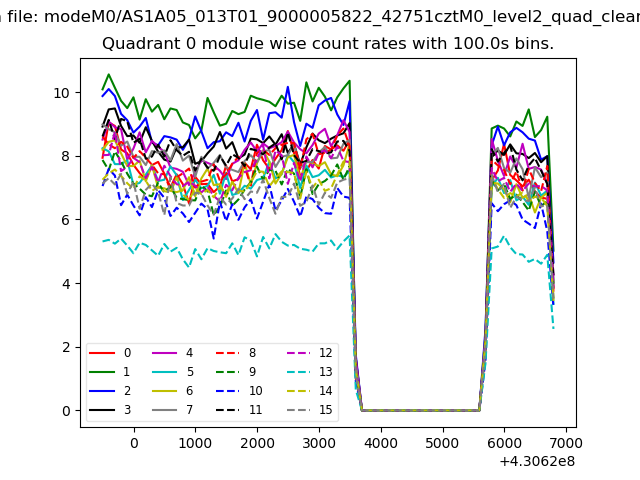
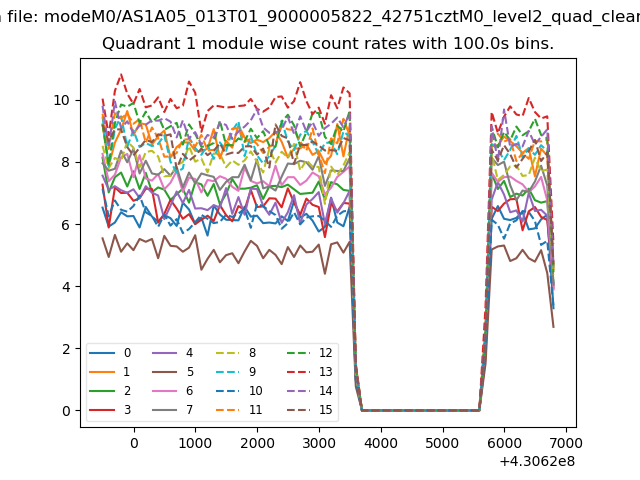
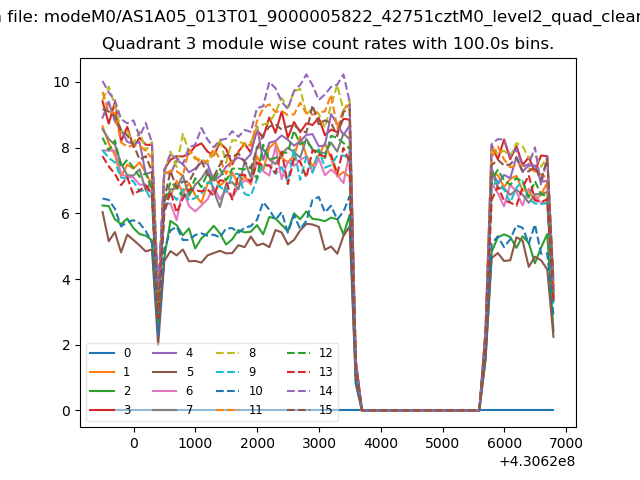
| Module-wise count rates for Quadrant A Data is divided into 100 sec bins |
 |
 |
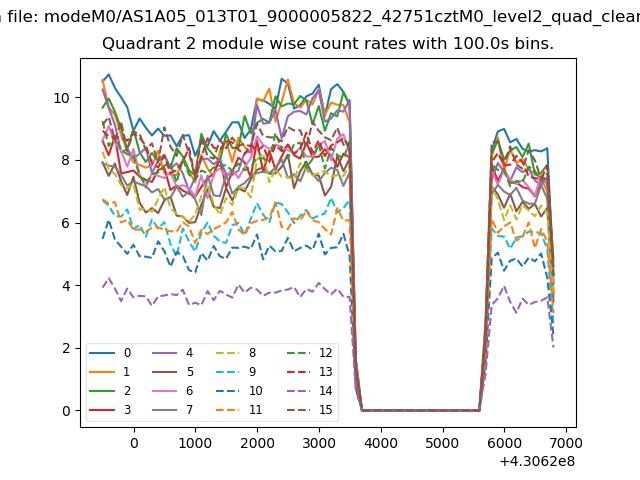
| Module-wise count rates for Quadrant B Data is divided into 100 sec bins |
 |
 |
| Module-wise count rates for Quadrant C Data is divided into 100 sec bins |
 |
 |
| Module-wise count rates for Quadrant D Data is divided into 100 sec bins |
 |
 |
| Parameter | Plot |
|---|---|
| CZT HV Monitor |  |
| D_VDD | 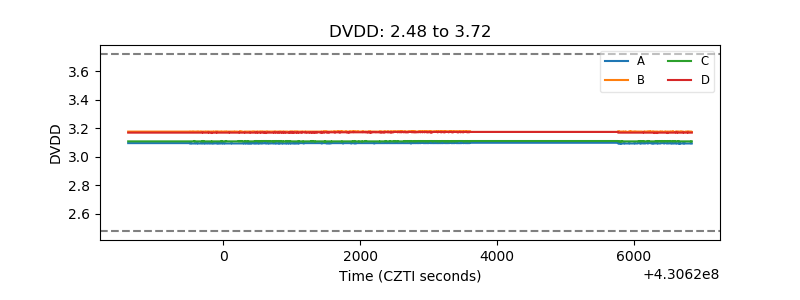 |
| Temperature 1 | 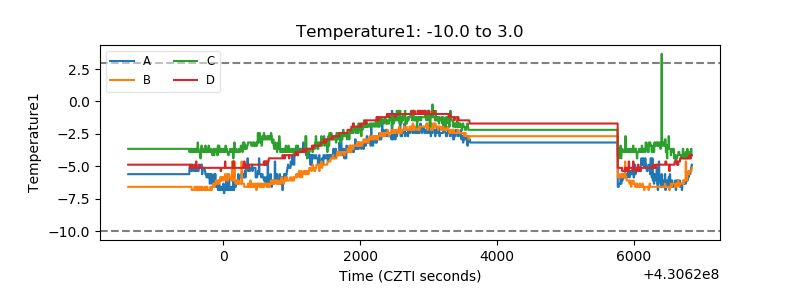 |
| Veto HV Monitor | 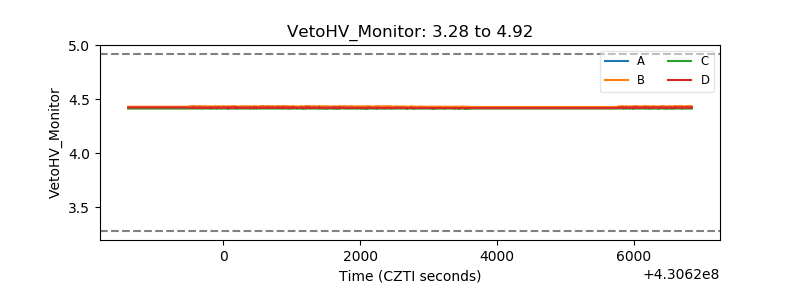 |
| Veto LLD |  |
| Alpha Counter | 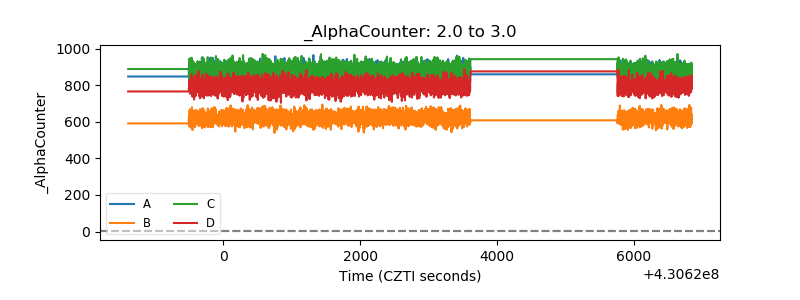 |
| _CPM_Rate | 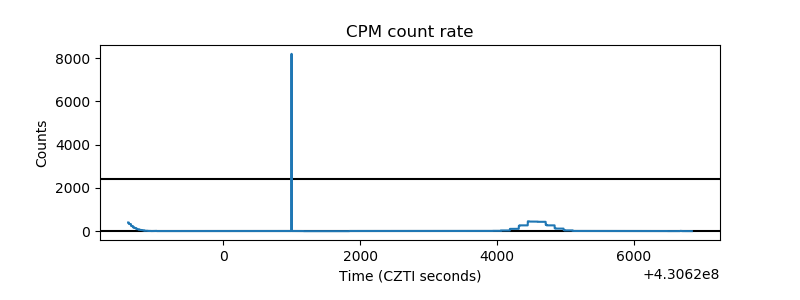 |
| CZT Counter | 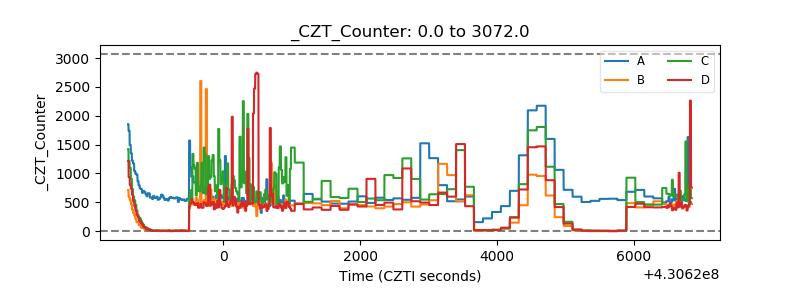 |
| +2.5 Volts monitor | 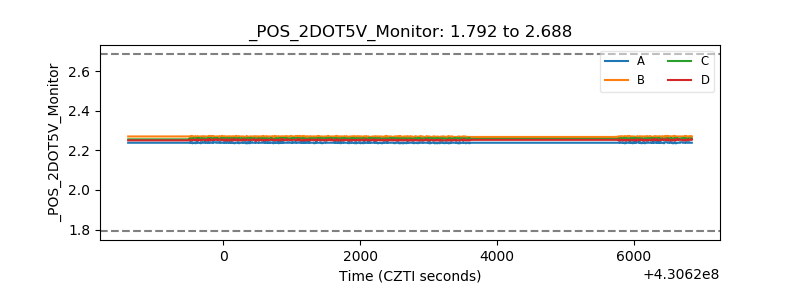 |
| +5 Volts monitor | 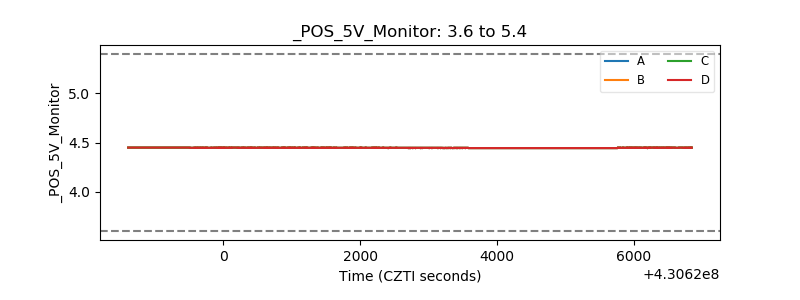 |
| _ROLL_ROT | 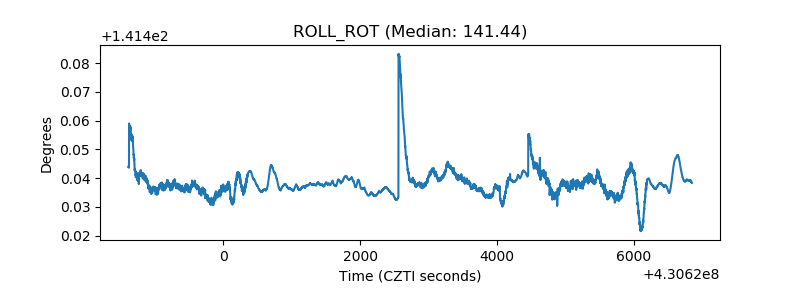 |
| _Roll_DEC | 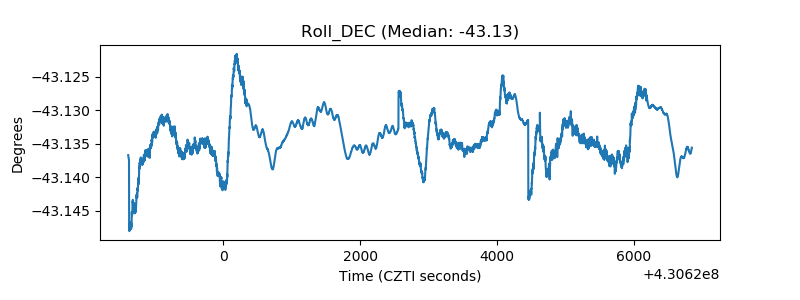 |
| _Roll_RA | 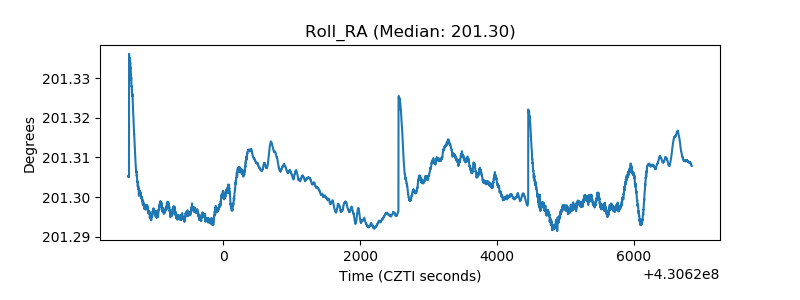 |
| Veto Counter | 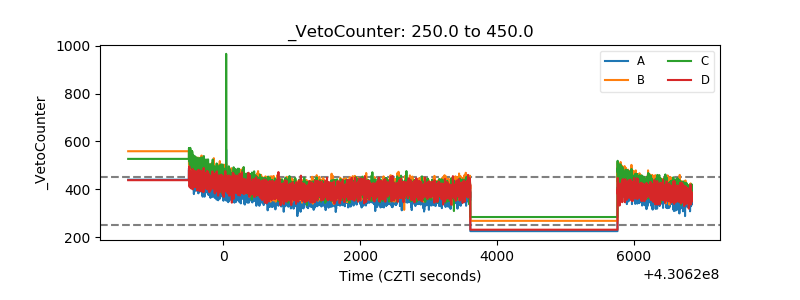 |