| Param | Original file | Final file |
|---|---|---|
| Filename | modeM0/AS1A05_013T01_9000005822_42752cztM0_level2.fits | modeM0/AS1A05_013T01_9000005822_42752cztM0_level2_quad_clean.evt |
| Size (bytes) | 368,922,240 | 89,841,600 |
| Size | 351.8 MB | 85.7 MB |
| Events in quadrant A | 3,572,620 | 606,908 |
| Events in quadrant B | 2,904,211 | 605,474 |
| Events in quadrant C | 4,000,707 | 584,146 |
| Events in quadrant D | 2,767,166 | 553,470 |
| Mode M0 | |||
|---|---|---|---|
| Quadrant | BADHDUFLAG | Total packets | Discarded packets |
| A | 0 | 13749 | 2 |
| B | 0 | 12200 | 2 |
| C | 0 | 15438 | 2 |
| D | 0 | 11972 | 2 |
| Mode M9 | |||
|---|---|---|---|
| Quadrant | BADHDUFLAG | Total packets | Discarded packets |
| A | 0 | 30 | 0 |
| B | 0 | 31 | 0 |
| C | 0 | 31 | 0 |
| D | 0 | 31 | 0 |
| Mode SS | |||
|---|---|---|---|
| Quadrant | BADHDUFLAG | Total packets | Discarded packets |
| A | 0 | 108 | 0 |
| B | 0 | 108 | 0 |
| C | 0 | 108 | 0 |
| D | 0 | 108 | 0 |
| Quadrant | Total seconds | Saturated seconds | Saturation percentage |
|---|---|---|---|
| A | 5290 | 118 | 2.230624% |
| B | 5290 | 218 | 4.120983% |
| C | 5290 | 189 | 3.572779% |
| D | 5290 | 55 | 1.039698% |
Noise dominated data is calculated using 1-second bins in cleaned event files. If a bin has >2000 counts, and if more than 50% of those come from <1% of pixels, then it is considered to be noise-dominated and hence unusable.
| Quadrant | # 1 sec bins | Bins with >0 counts | Bins with >2000 counts | High rate bins dominated by noise | Noise dominated (total time) | Noise dominated (detector-on time) | Marked lightcurve |
|---|---|---|---|---|---|---|---|
| A | 7293 | 5291 | 91 | 91 | 1.25% | 1.72% | 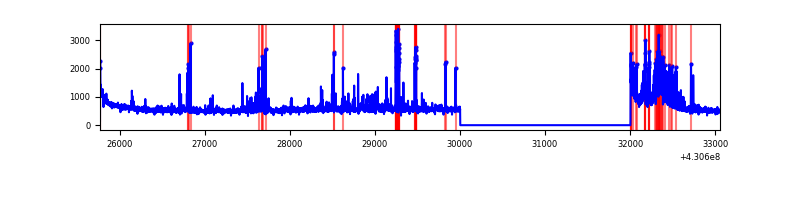 |
| B | 7293 | 5291 | 169 | 169 | 2.32% | 3.19% | 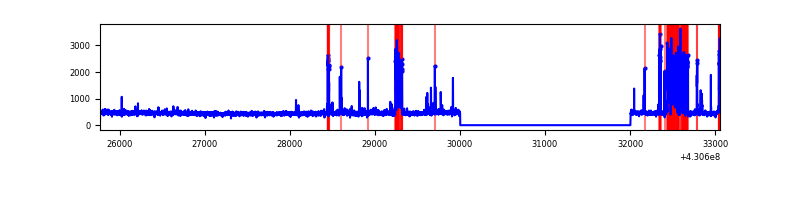 |
| C | 7293 | 5291 | 189 | 189 | 2.59% | 3.57% | 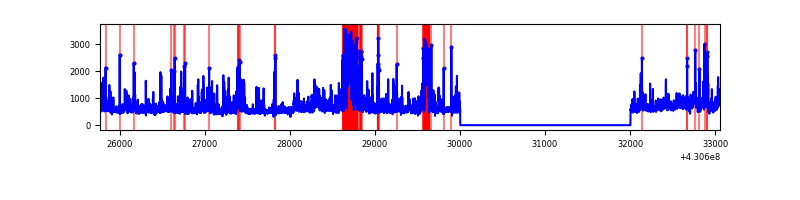 |
| D | 7293 | 5291 | 54 | 54 | 0.74% | 1.02% | 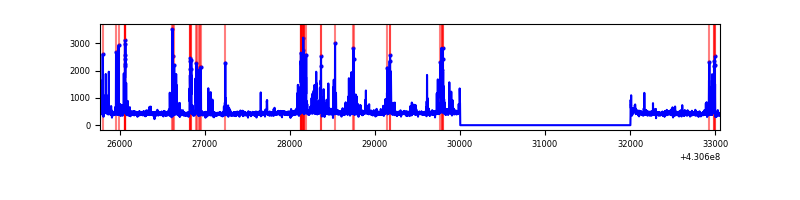 |
Top three noisy pixels from each quadrant. If the there are fewer than three noisy pixels in the level2.evt file, extra rows are filled as -1
| Pixel properties | Quadrant properties | ||||||
|---|---|---|---|---|---|---|---|
| Quadrant | DetID | PixID | Counts | Sigma | Mean | Median | Sigma |
| A | 10 | 83 | 577125 | 4711.21 | 597 | 584 | 122.4 |
| A | 13 | 248 | 390848 | 3189.04 | 597 | 584 | 122.4 |
| A | 7 | 3 | 220250 | 1795.0 | 597 | 584 | 122.4 |
| B | 5 | 172 | 562212 | 4930.03 | 584 | 567 | 113.9 |
| B | 15 | 85 | 19659 | 167.59 | 584 | 567 | 113.9 |
| B | 0 | 245 | 18497 | 157.39 | 584 | 567 | 113.9 |
| C | 0 | 239 | 1098441 | 8129.09 | 580 | 585 | 135.1 |
| C | 14 | 254 | 407230 | 3011.01 | 580 | 585 | 135.1 |
| C | 15 | 214 | 218513 | 1613.65 | 580 | 585 | 135.1 |
| D | 2 | 249 | 308364 | 2155.21 | 588 | 572 | 142.8 |
| D | 12 | 6 | 122930 | 856.77 | 588 | 572 | 142.8 |
| D | 2 | 234 | 29180 | 200.32 | 588 | 572 | 142.8 |
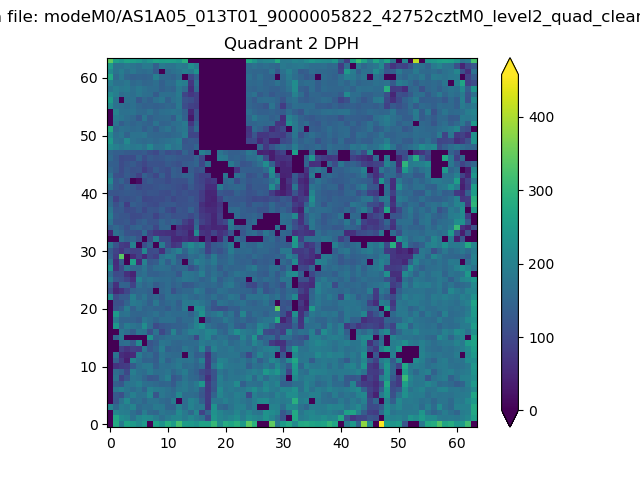
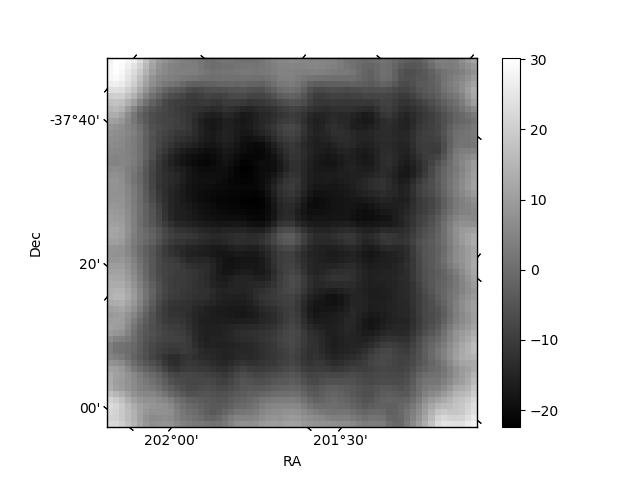
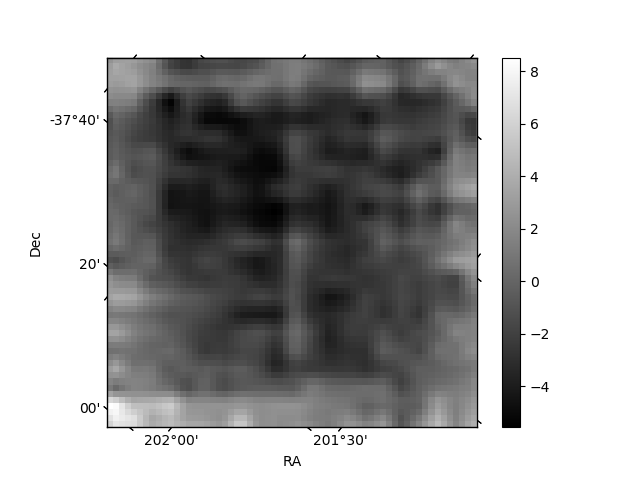
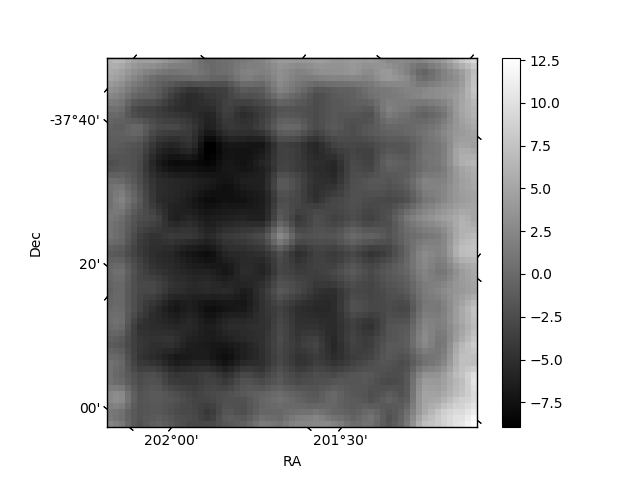
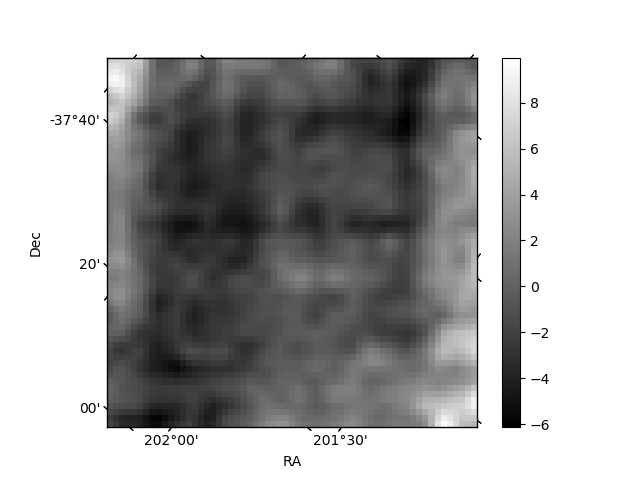
Histogram calculated using DETX and DETY for each event in the final _common_clean file
| Quadrant A | 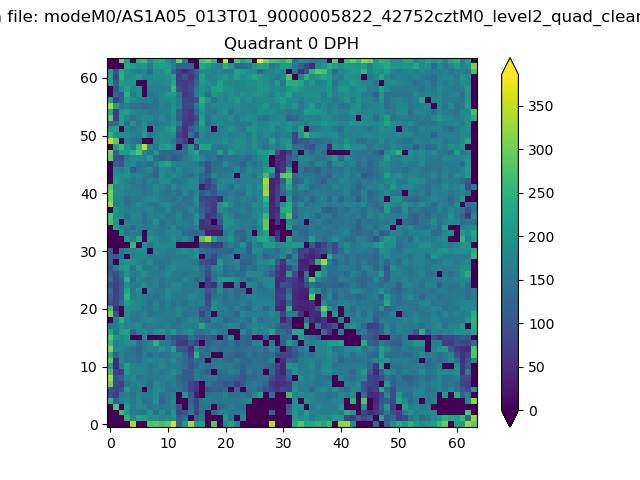 |
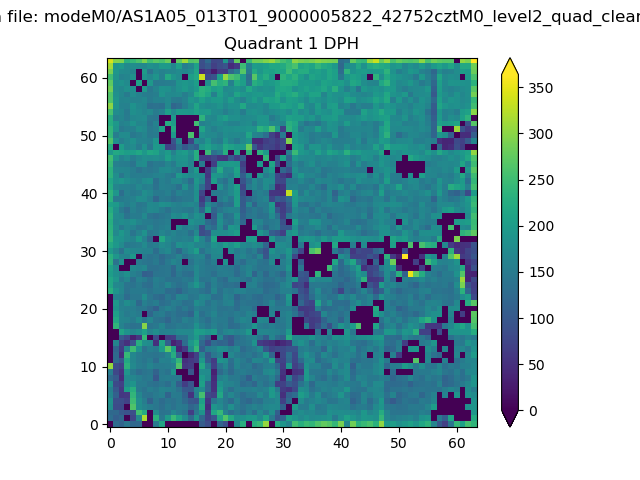 |
Quadrant B |
|---|---|---|---|
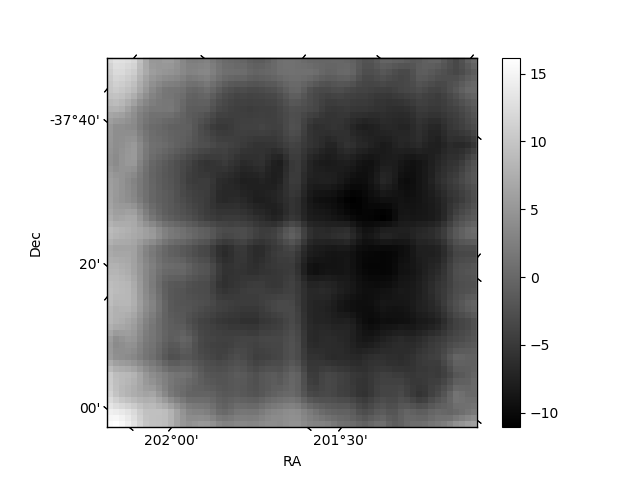
| Quadrant D | 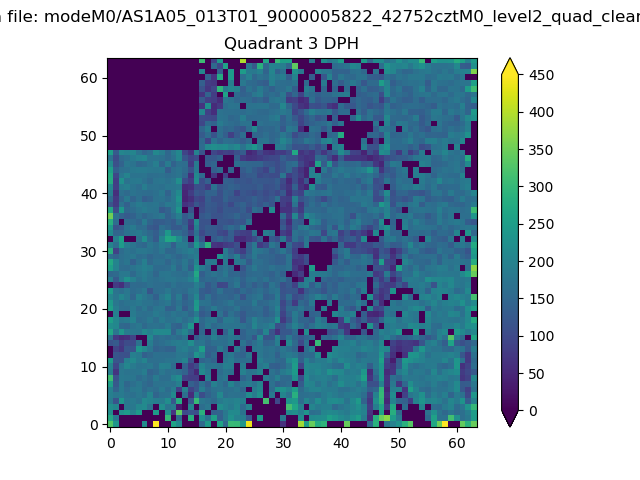 |
 |
Quadrant C |
| Plot type | Count rate plots | Images |
|---|---|---|
| Comparison with Poisson distribution Blue bars denote a histogram of data divided into 1 sec bins. Red curve is a Poisson curve with rate = median count rate of data. |
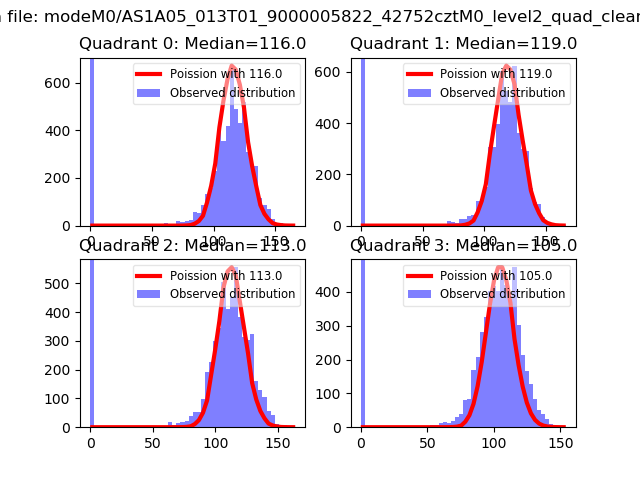 |
 |
| Quadrant-wise count rates Data is divided into 100 sec bins |
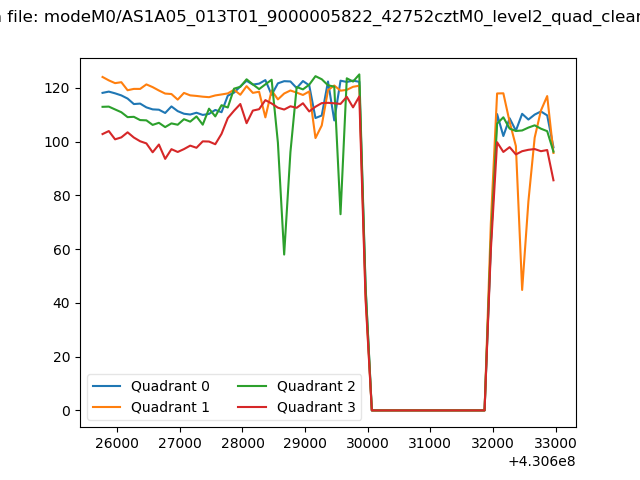 |
|
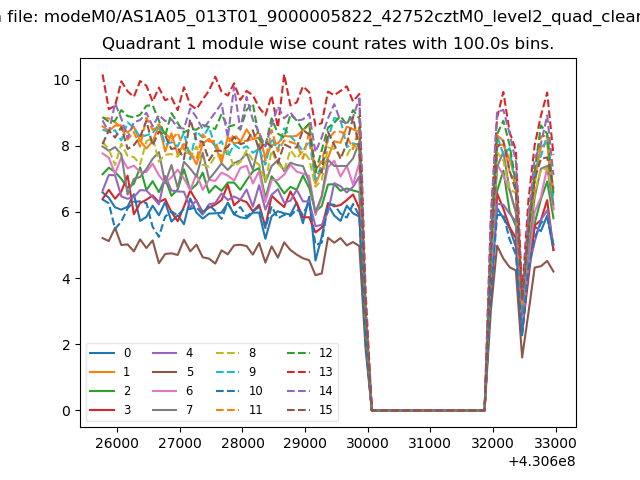
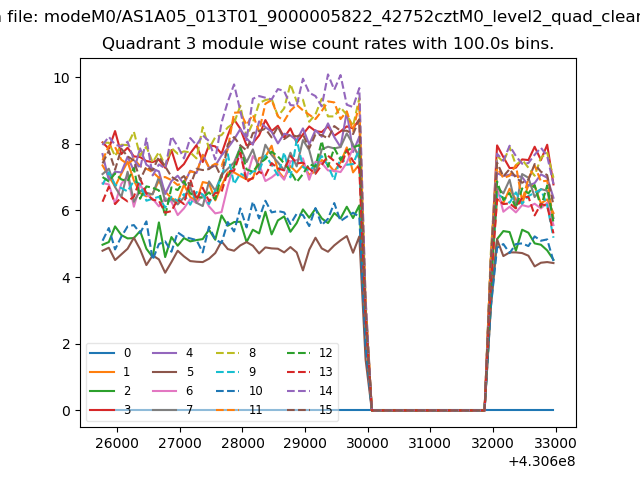
| Module-wise count rates for Quadrant A Data is divided into 100 sec bins |
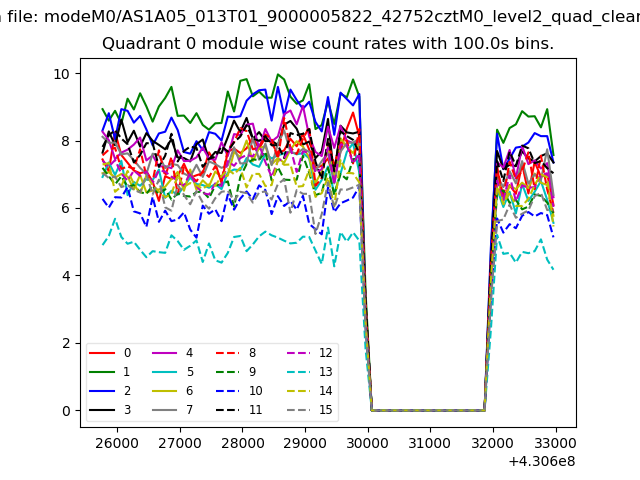 |
 |
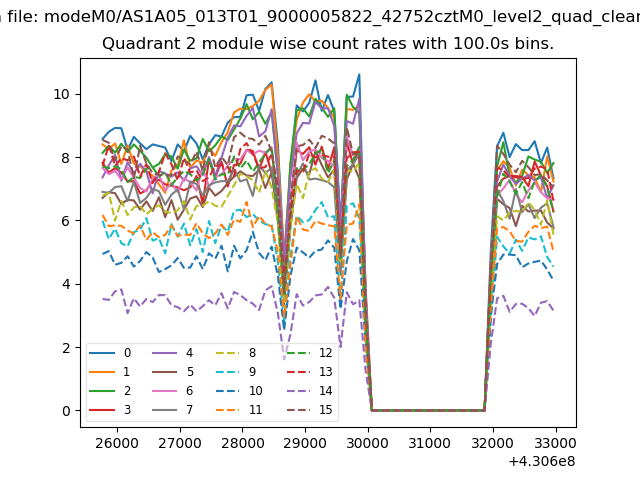
| Module-wise count rates for Quadrant B Data is divided into 100 sec bins |
 |
 |
| Module-wise count rates for Quadrant C Data is divided into 100 sec bins |
 |
 |
| Module-wise count rates for Quadrant D Data is divided into 100 sec bins |
 |
 |
| Parameter | Plot |
|---|---|
| CZT HV Monitor | 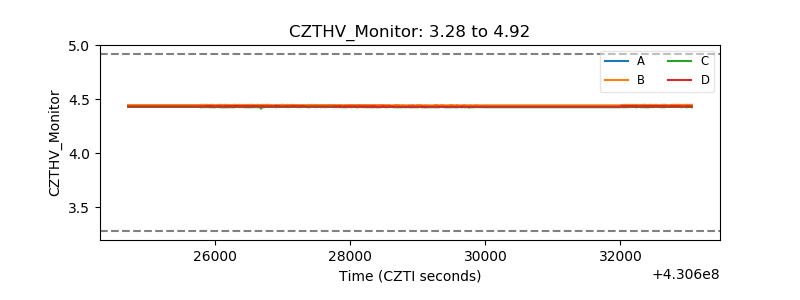 |
| D_VDD | 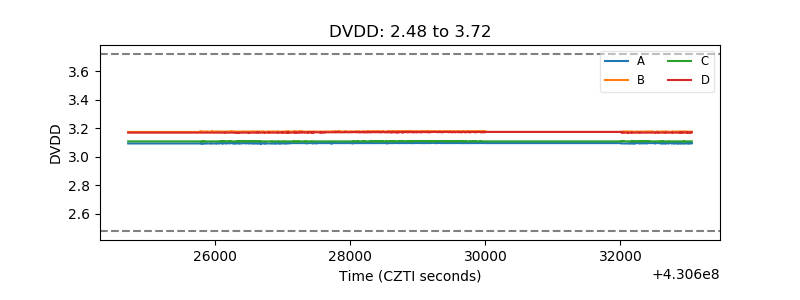 |
| Temperature 1 | 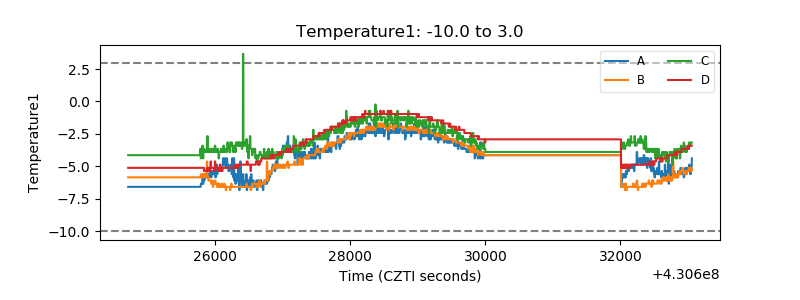 |
| Veto HV Monitor | 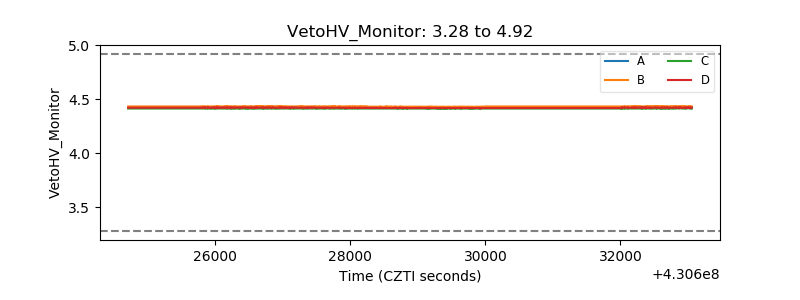 |
| Veto LLD | 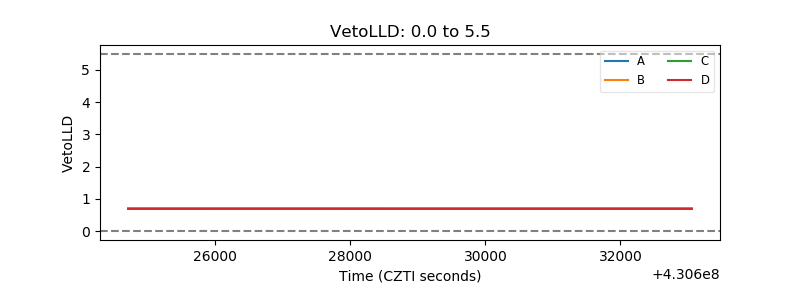 |
| Alpha Counter | 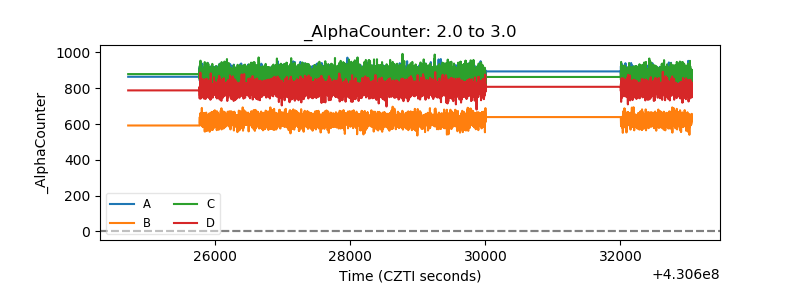 |
| _CPM_Rate | 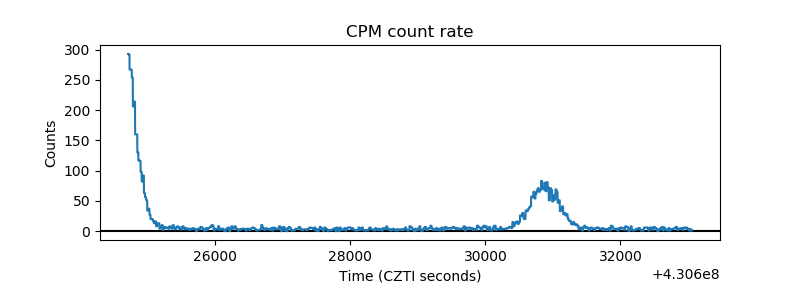 |
| CZT Counter | 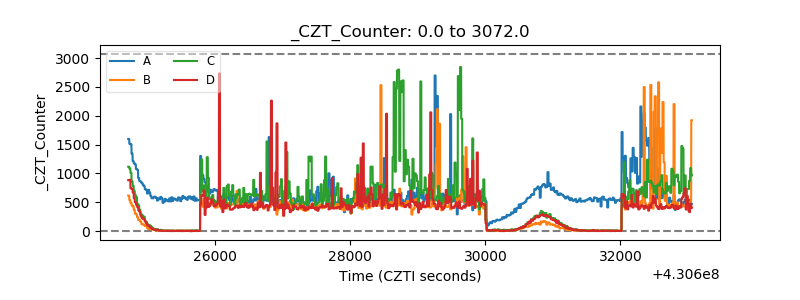 |
| +2.5 Volts monitor | 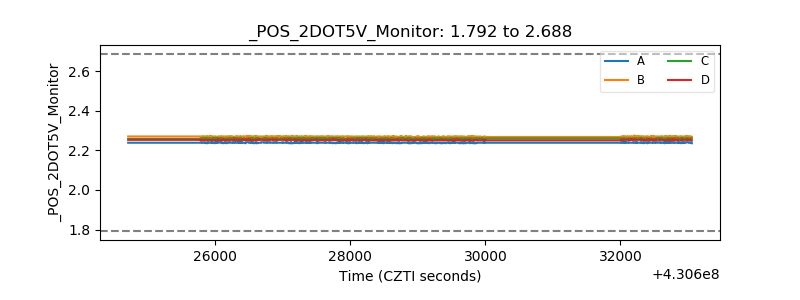 |
| +5 Volts monitor | 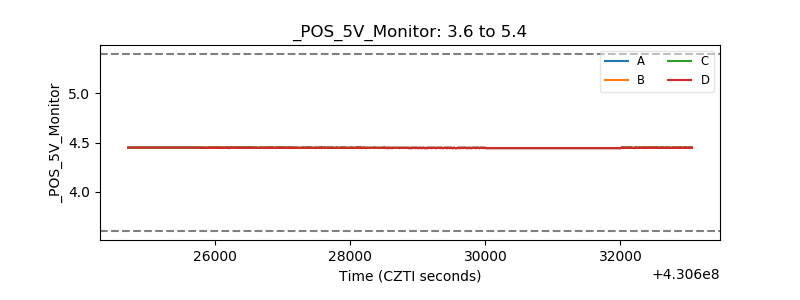 |
| _ROLL_ROT | 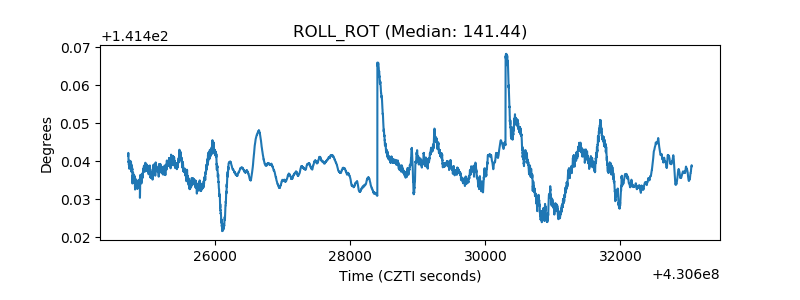 |
| _Roll_DEC | 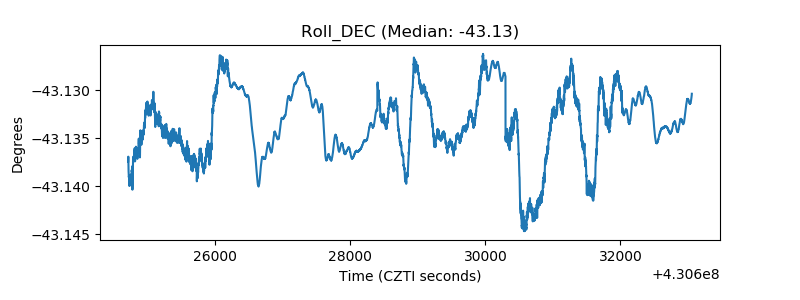 |
| _Roll_RA | 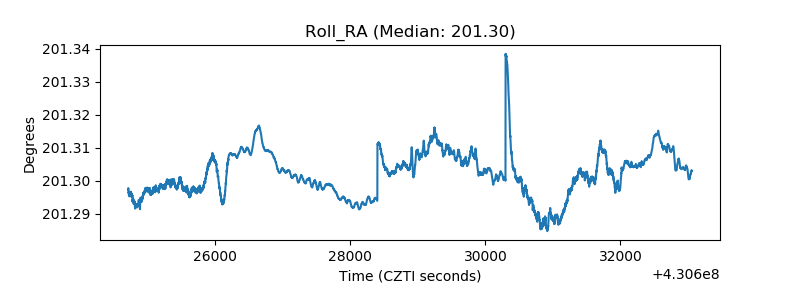 |
| Veto Counter | 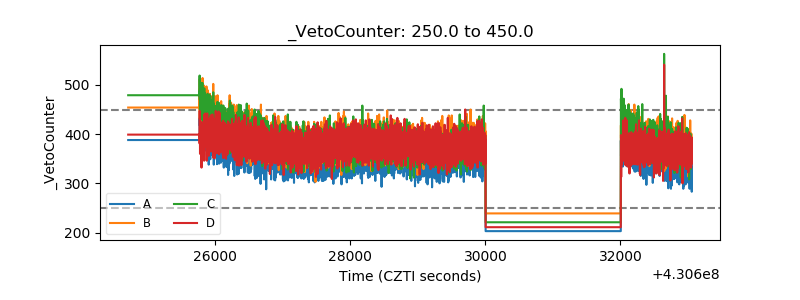 |