| Param | Original file | Final file |
|---|---|---|
| Filename | modeM0/AS1A05_013T01_9000005822_42753cztM0_level2.fits | modeM0/AS1A05_013T01_9000005822_42753cztM0_level2_quad_clean.evt |
| Size (bytes) | 388,932,480 | 91,503,360 |
| Size | 370.9 MB | 87.3 MB |
| Events in quadrant A | 3,660,824 | 616,057 |
| Events in quadrant B | 2,968,037 | 605,072 |
| Events in quadrant C | 4,720,060 | 603,264 |
| Events in quadrant D | 2,625,642 | 565,662 |
| Mode M0 | |||
|---|---|---|---|
| Quadrant | BADHDUFLAG | Total packets | Discarded packets |
| A | 0 | 14134 | 3 |
| B | 0 | 12532 | 2 |
| C | 0 | 17936 | 2 |
| D | 0 | 11637 | 2 |
| Mode M9 | |||
|---|---|---|---|
| Quadrant | BADHDUFLAG | Total packets | Discarded packets |
| A | 0 | 25 | 0 |
| B | 0 | 26 | 0 |
| C | 0 | 26 | 0 |
| D | 0 | 26 | 0 |
| Mode SS | |||
|---|---|---|---|
| Quadrant | BADHDUFLAG | Total packets | Discarded packets |
| A | 0 | 112 | 0 |
| B | 0 | 112 | 0 |
| C | 0 | 112 | 0 |
| D | 0 | 112 | 0 |
| Quadrant | Total seconds | Saturated seconds | Saturation percentage |
|---|---|---|---|
| A | 5434 | 109 | 2.005889% |
| B | 5434 | 203 | 3.735738% |
| C | 5434 | 143 | 2.631579% |
| D | 5434 | 17 | 0.312845% |
Noise dominated data is calculated using 1-second bins in cleaned event files. If a bin has >2000 counts, and if more than 50% of those come from <1% of pixels, then it is considered to be noise-dominated and hence unusable.
| Quadrant | # 1 sec bins | Bins with >0 counts | Bins with >2000 counts | High rate bins dominated by noise | Noise dominated (total time) | Noise dominated (detector-on time) | Marked lightcurve |
|---|---|---|---|---|---|---|---|
| A | 7107 | 5435 | 78 | 78 | 1.10% | 1.44% | 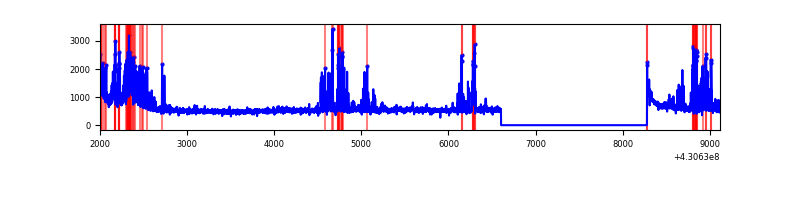 |
| B | 7107 | 5435 | 158 | 158 | 2.22% | 2.91% | 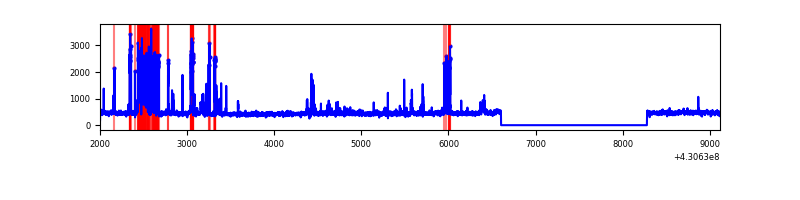 |
| C | 7107 | 5435 | 138 | 138 | 1.94% | 2.54% | 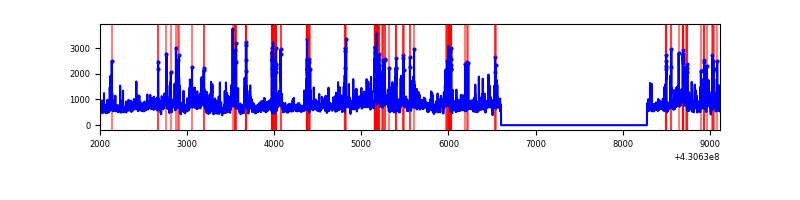 |
| D | 7107 | 5435 | 16 | 16 | 0.23% | 0.29% | 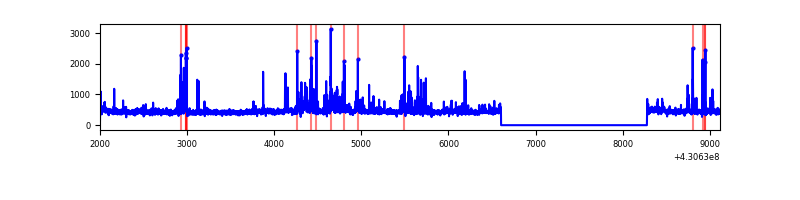 |
Top three noisy pixels from each quadrant. If the there are fewer than three noisy pixels in the level2.evt file, extra rows are filled as -1
| Pixel properties | Quadrant properties | ||||||
|---|---|---|---|---|---|---|---|
| Quadrant | DetID | PixID | Counts | Sigma | Mean | Median | Sigma |
| A | 10 | 83 | 584704 | 4685.88 | 607 | 594 | 124.7 |
| A | 13 | 248 | 537218 | 4304.93 | 607 | 594 | 124.7 |
| A | 7 | 3 | 133599 | 1067.0 | 607 | 594 | 124.7 |
| B | 5 | 172 | 570035 | 4959.3 | 588 | 572 | 114.8 |
| B | 10 | 246 | 25371 | 215.97 | 588 | 572 | 114.8 |
| B | 12 | 0 | 20905 | 177.07 | 588 | 572 | 114.8 |
| C | 0 | 239 | 2116439 | 15396.9 | 589 | 592 | 137.4 |
| C | 15 | 214 | 226191 | 1641.67 | 589 | 592 | 137.4 |
| C | 14 | 254 | 73015 | 527.02 | 589 | 592 | 137.4 |
| D | 12 | 233 | 104557 | 711.15 | 597 | 581 | 146.2 |
| D | 12 | 6 | 70221 | 476.31 | 597 | 581 | 146.2 |
| D | 1 | 47 | 49737 | 336.2 | 597 | 581 | 146.2 |
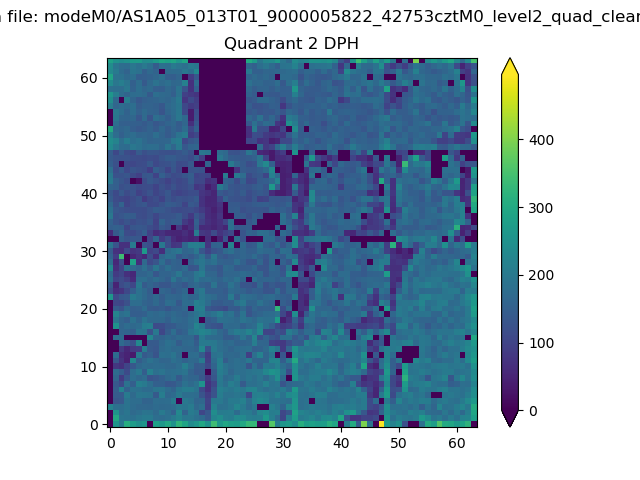
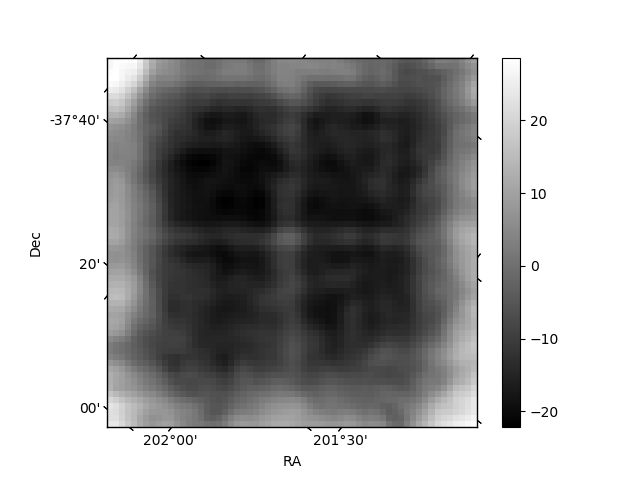
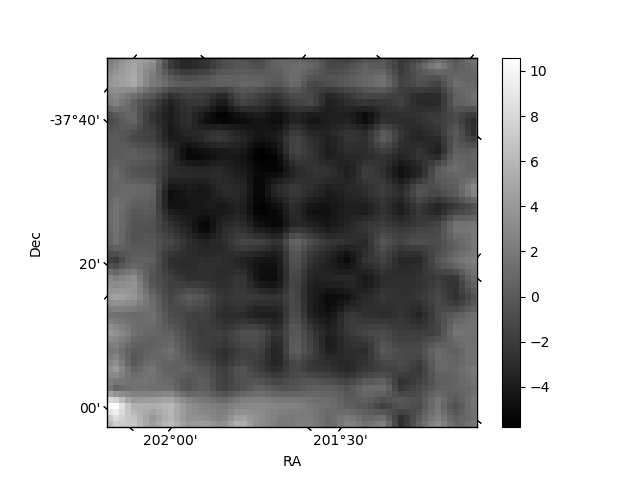
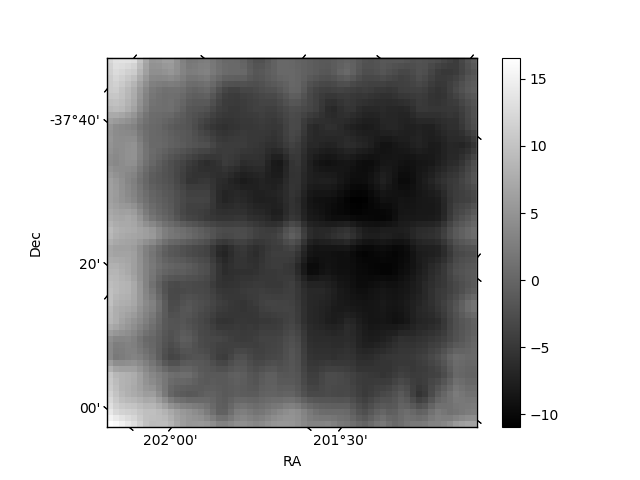
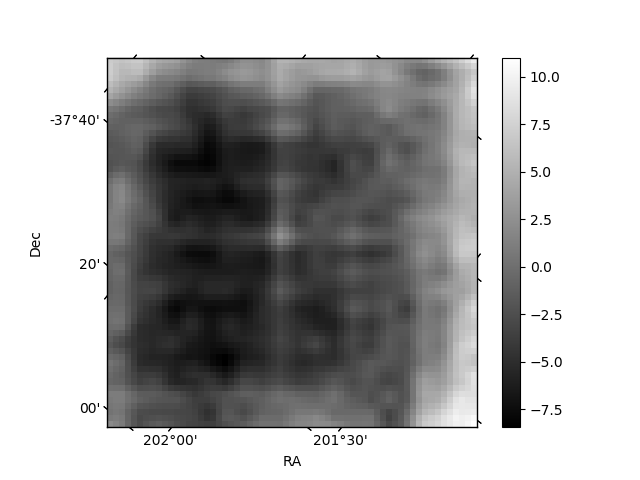
Histogram calculated using DETX and DETY for each event in the final _common_clean file
| Quadrant A | 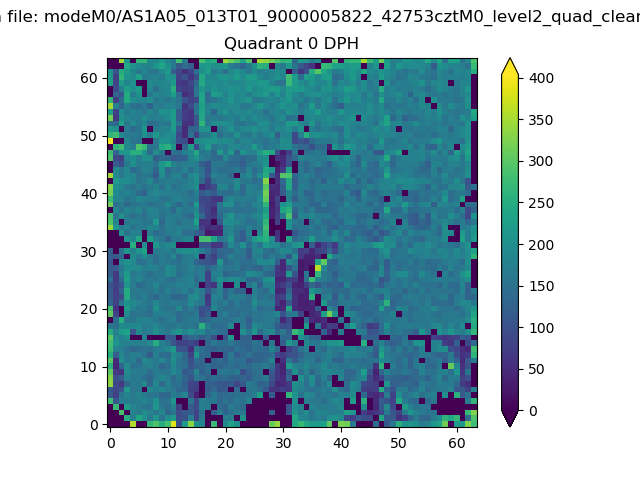 |
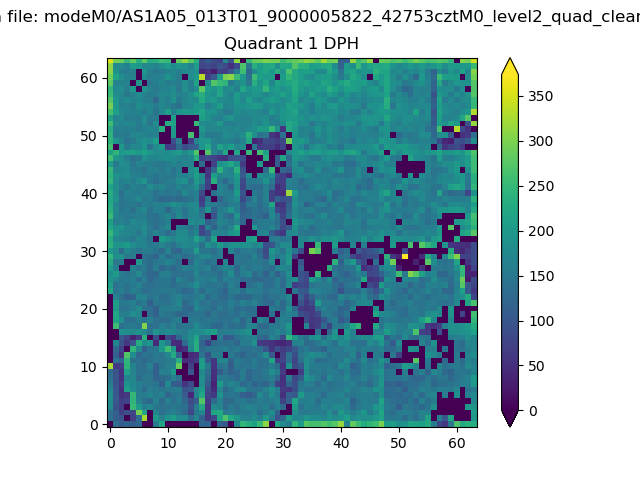 |
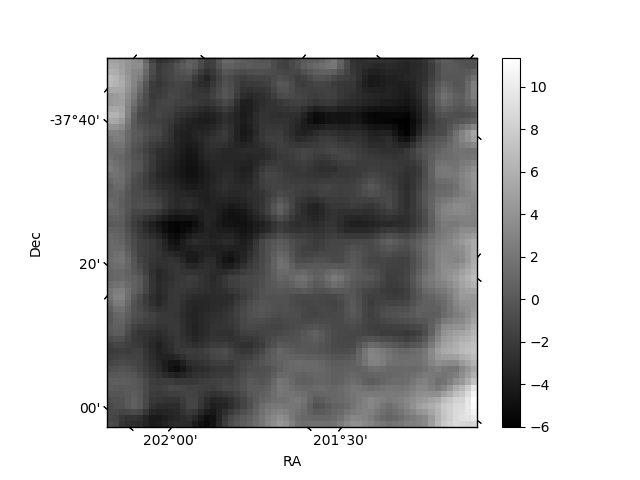
Quadrant B |
|---|---|---|---|
| Quadrant D | 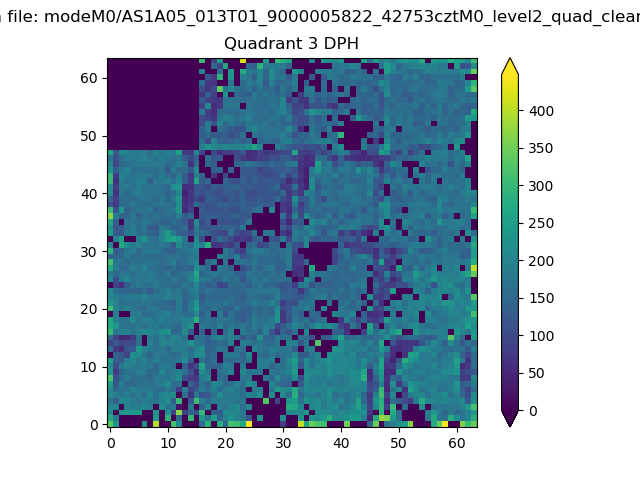 |
 |
Quadrant C |
| Plot type | Count rate plots | Images |
|---|---|---|
| Comparison with Poisson distribution Blue bars denote a histogram of data divided into 1 sec bins. Red curve is a Poisson curve with rate = median count rate of data. |
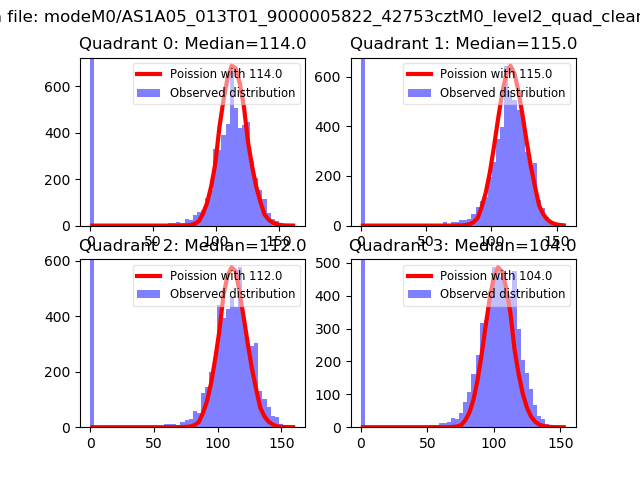 |
 |
| Quadrant-wise count rates Data is divided into 100 sec bins |
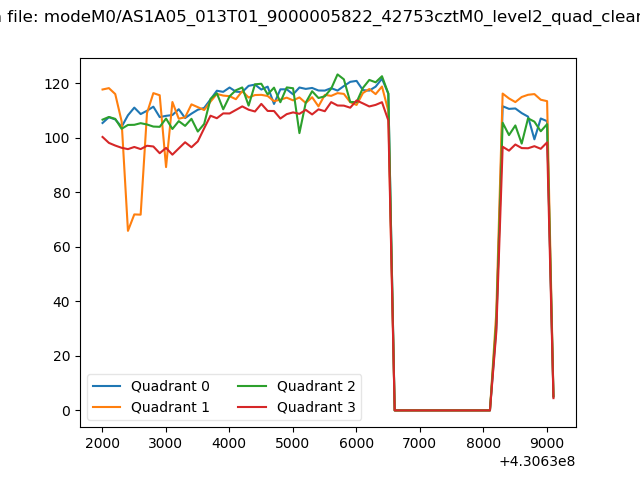 |
|
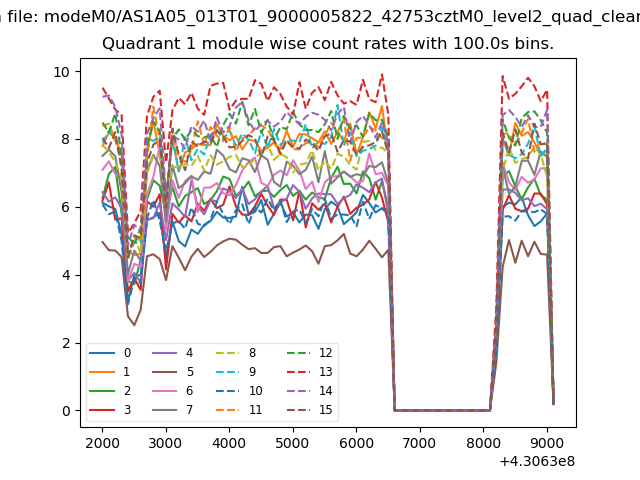
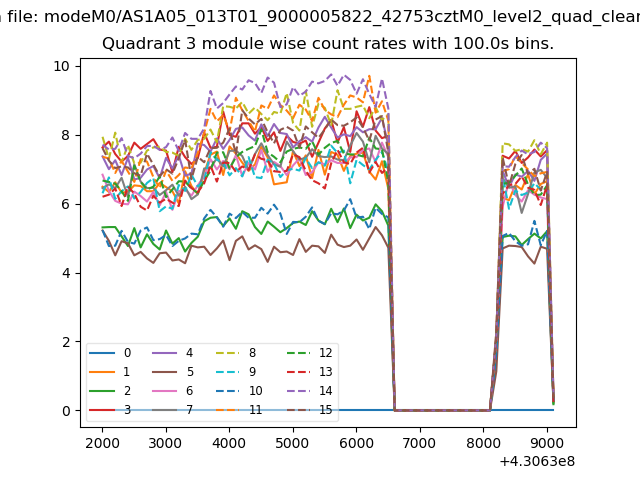
| Module-wise count rates for Quadrant A Data is divided into 100 sec bins |
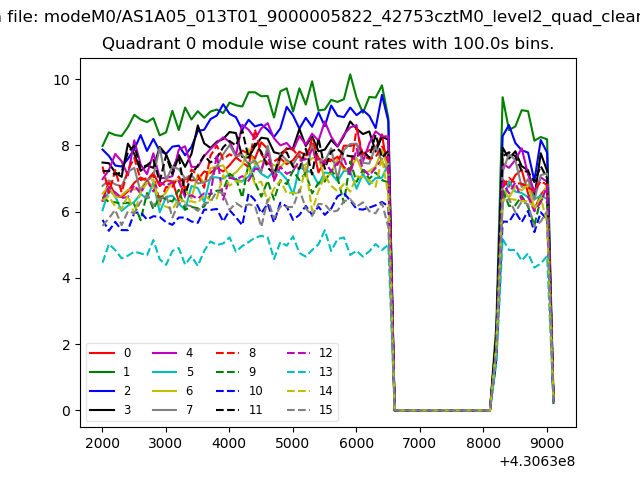 |
 |
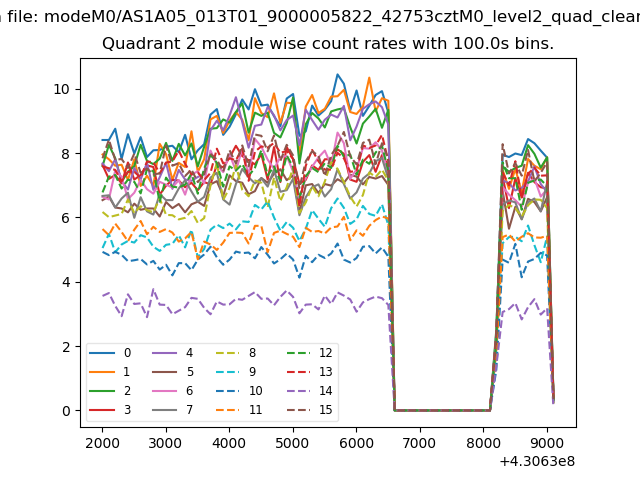
| Module-wise count rates for Quadrant B Data is divided into 100 sec bins |
 |
 |
| Module-wise count rates for Quadrant C Data is divided into 100 sec bins |
 |
 |
| Module-wise count rates for Quadrant D Data is divided into 100 sec bins |
 |
 |
| Parameter | Plot |
|---|---|
| CZT HV Monitor | 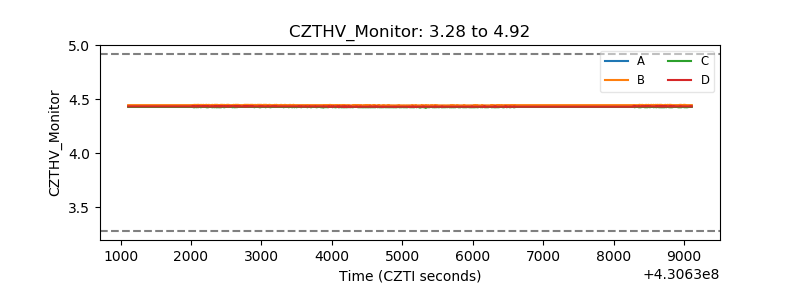 |
| D_VDD | 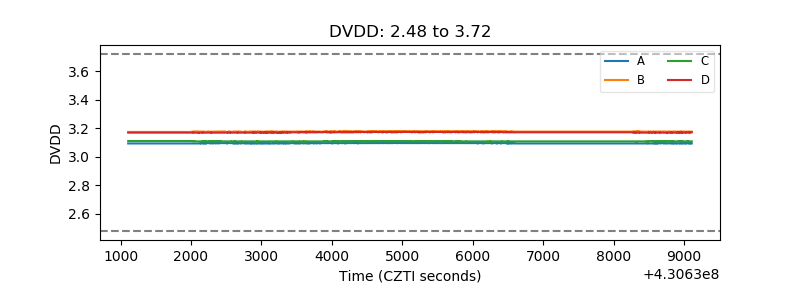 |
| Temperature 1 | 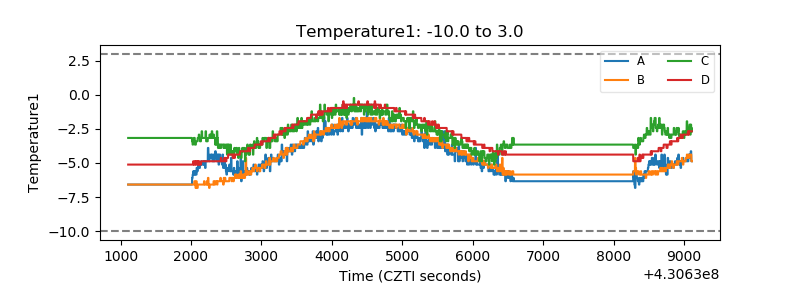 |
| Veto HV Monitor | 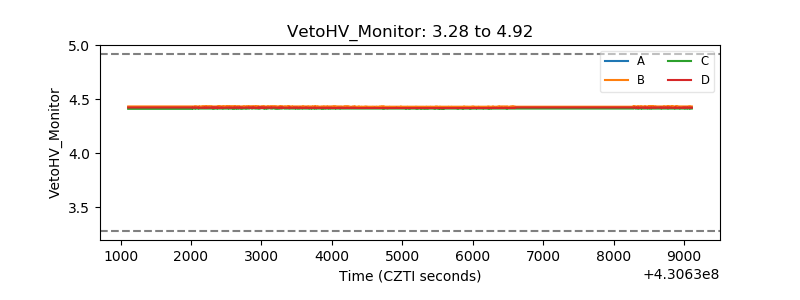 |
| Veto LLD | 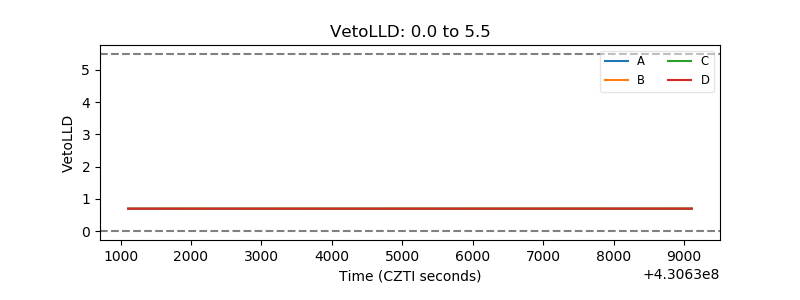 |
| Alpha Counter | 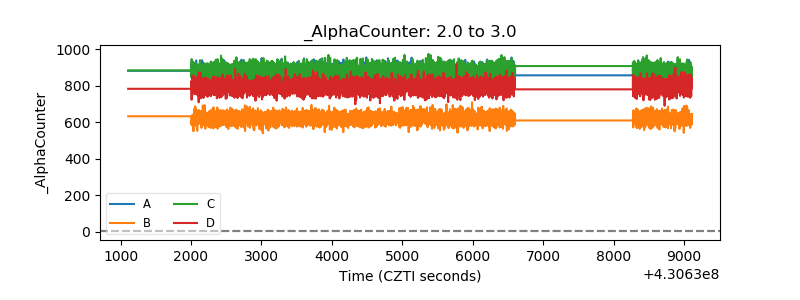 |
| _CPM_Rate | 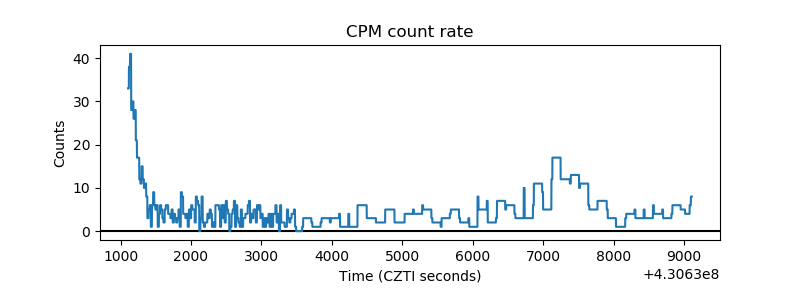 |
| CZT Counter | 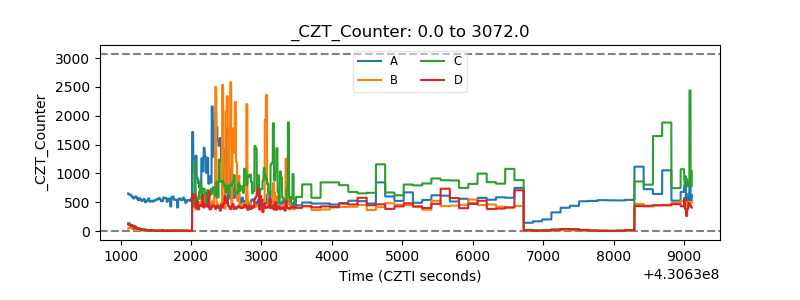 |
| +2.5 Volts monitor | 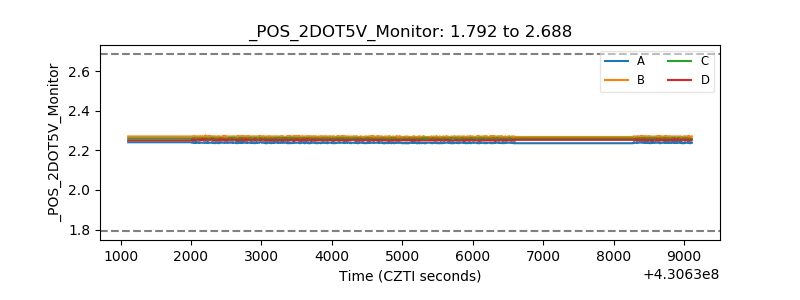 |
| +5 Volts monitor |  |
| _ROLL_ROT | 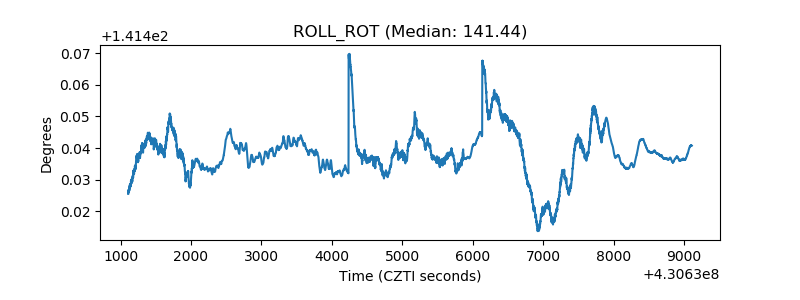 |
| _Roll_DEC | 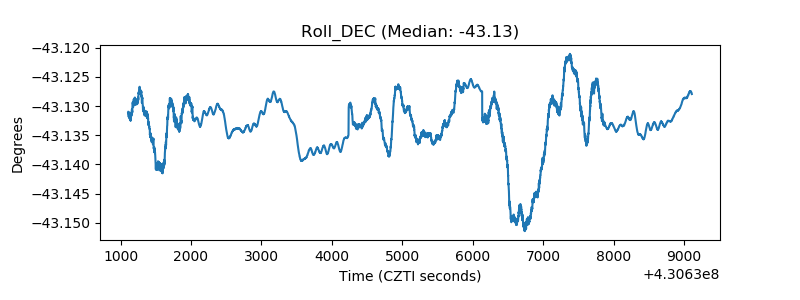 |
| _Roll_RA | 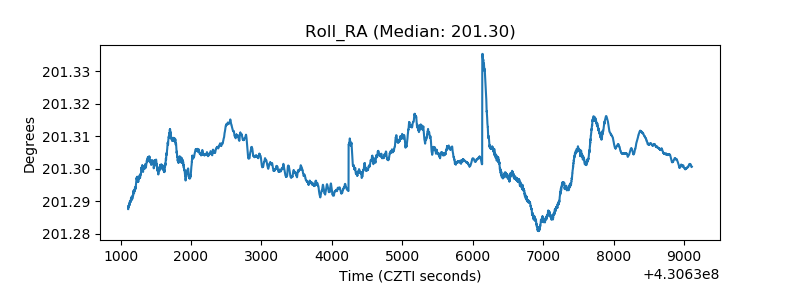 |
| Veto Counter | 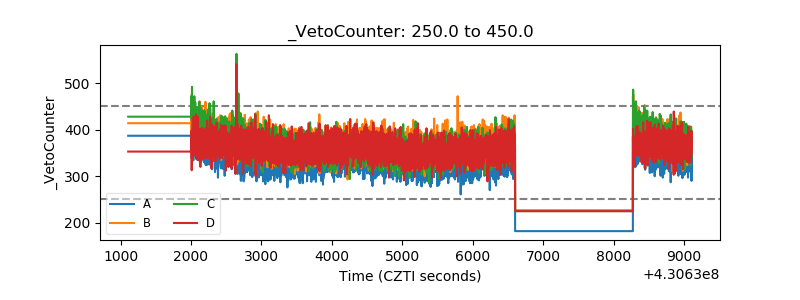 |