| Param | Original file | Final file |
|---|---|---|
| Filename | modeM0/AS1A05_013T01_9000005822_42754cztM0_level2.fits | modeM0/AS1A05_013T01_9000005822_42754cztM0_level2_quad_clean.evt |
| Size (bytes) | 420,405,120 | 98,424,000 |
| Size | 400.9 MB | 93.9 MB |
| Events in quadrant A | 4,064,148 | 655,480 |
| Events in quadrant B | 3,073,948 | 656,104 |
| Events in quadrant C | 5,145,976 | 647,482 |
| Events in quadrant D | 2,822,652 | 611,317 |
| Mode M0 | |||
|---|---|---|---|
| Quadrant | BADHDUFLAG | Total packets | Discarded packets |
| A | 0 | 15703 | 2 |
| B | 0 | 13044 | 2 |
| C | 0 | 19513 | 2 |
| D | 0 | 12443 | 2 |
| Mode M9 | |||
|---|---|---|---|
| Quadrant | BADHDUFLAG | Total packets | Discarded packets |
| A | 0 | 24 | 0 |
| B | 0 | 25 | 0 |
| C | 0 | 25 | 0 |
| D | 0 | 25 | 0 |
| Mode SS | |||
|---|---|---|---|
| Quadrant | BADHDUFLAG | Total packets | Discarded packets |
| A | 0 | 120 | 0 |
| B | 0 | 120 | 0 |
| C | 0 | 120 | 0 |
| D | 0 | 120 | 0 |
| Quadrant | Total seconds | Saturated seconds | Saturation percentage |
|---|---|---|---|
| A | 5862 | 171 | 2.917093% |
| B | 5862 | 94 | 1.603548% |
| C | 5862 | 186 | 3.172979% |
| D | 5862 | 23 | 0.392358% |
Noise dominated data is calculated using 1-second bins in cleaned event files. If a bin has >2000 counts, and if more than 50% of those come from <1% of pixels, then it is considered to be noise-dominated and hence unusable.
| Quadrant | # 1 sec bins | Bins with >0 counts | Bins with >2000 counts | High rate bins dominated by noise | Noise dominated (total time) | Noise dominated (detector-on time) | Marked lightcurve |
|---|---|---|---|---|---|---|---|
| A | 7264 | 5863 | 130 | 130 | 1.79% | 2.22% | 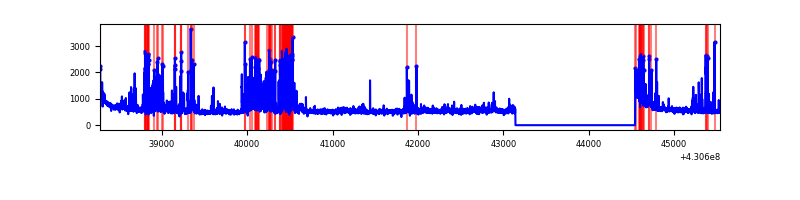 |
| B | 7264 | 5863 | 81 | 81 | 1.12% | 1.38% | 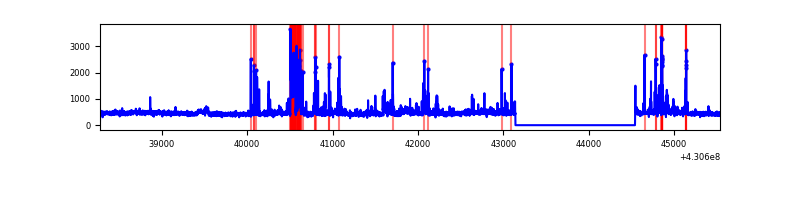 |
| C | 7264 | 5863 | 179 | 179 | 2.46% | 3.05% | 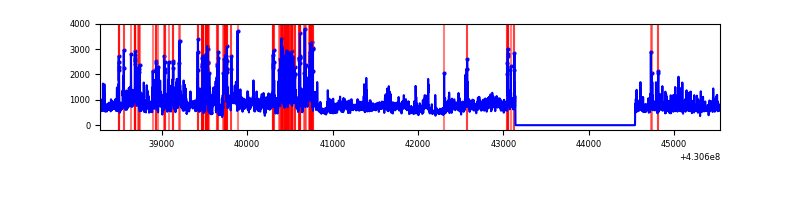 |
| D | 7264 | 5863 | 17 | 17 | 0.23% | 0.29% | 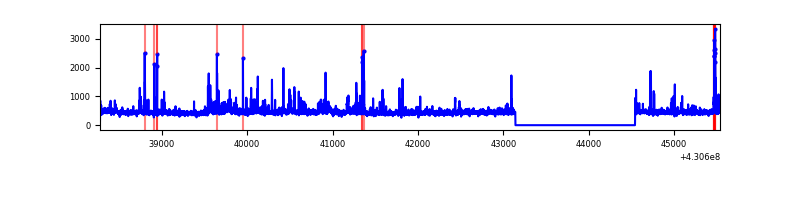 |
Top three noisy pixels from each quadrant. If the there are fewer than three noisy pixels in the level2.evt file, extra rows are filled as -1
| Pixel properties | Quadrant properties | ||||||
|---|---|---|---|---|---|---|---|
| Quadrant | DetID | PixID | Counts | Sigma | Mean | Median | Sigma |
| A | 13 | 248 | 831050 | 6192.88 | 651 | 637 | 134.1 |
| A | 10 | 83 | 614234 | 4575.96 | 651 | 637 | 134.1 |
| A | 12 | 189 | 94100 | 697.01 | 651 | 637 | 134.1 |
| B | 5 | 172 | 253116 | 2011.21 | 641 | 624 | 125.5 |
| B | 10 | 246 | 133201 | 1056.04 | 641 | 624 | 125.5 |
| B | 5 | 255 | 74447 | 588.03 | 641 | 624 | 125.5 |
| C | 0 | 239 | 2291780 | 15344.73 | 633 | 637 | 149.3 |
| C | 15 | 214 | 244661 | 1634.33 | 633 | 637 | 149.3 |
| C | 14 | 254 | 116531 | 776.19 | 633 | 637 | 149.3 |
| D | 2 | 249 | 109296 | 687.16 | 645 | 627 | 158.1 |
| D | 1 | 52 | 52184 | 326.02 | 645 | 627 | 158.1 |
| D | 5 | 171 | 42477 | 264.64 | 645 | 627 | 158.1 |
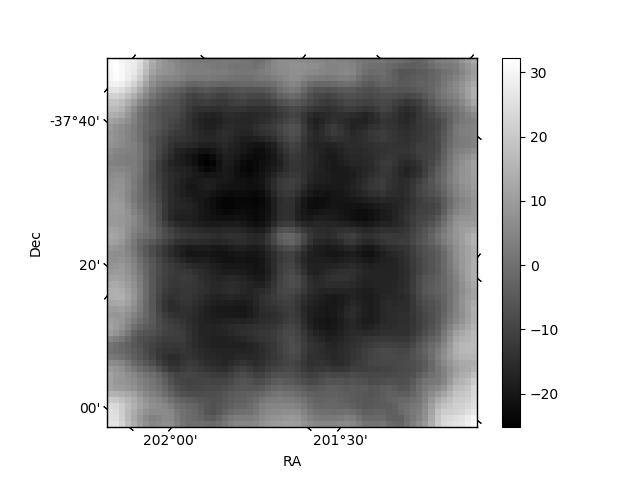
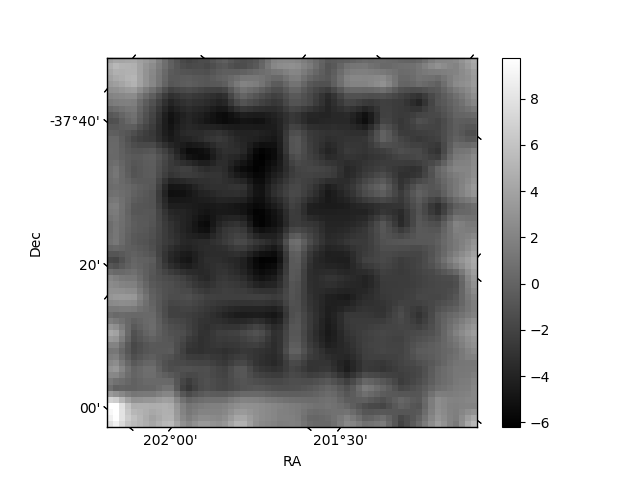
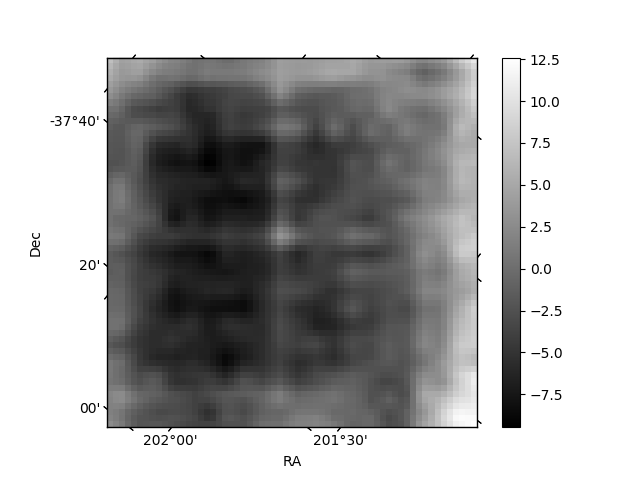
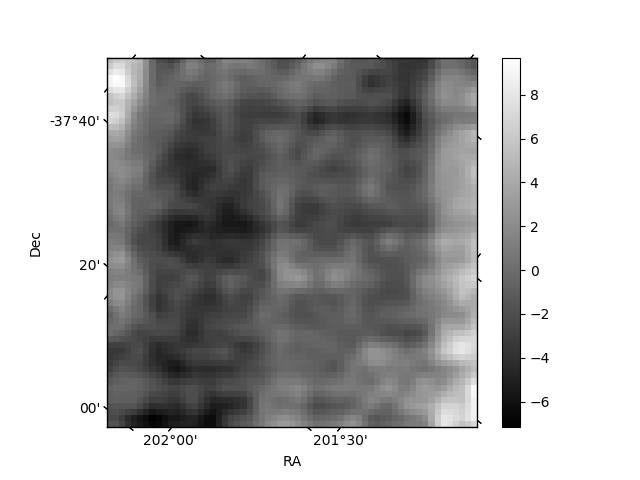
Histogram calculated using DETX and DETY for each event in the final _common_clean file
| Quadrant A | 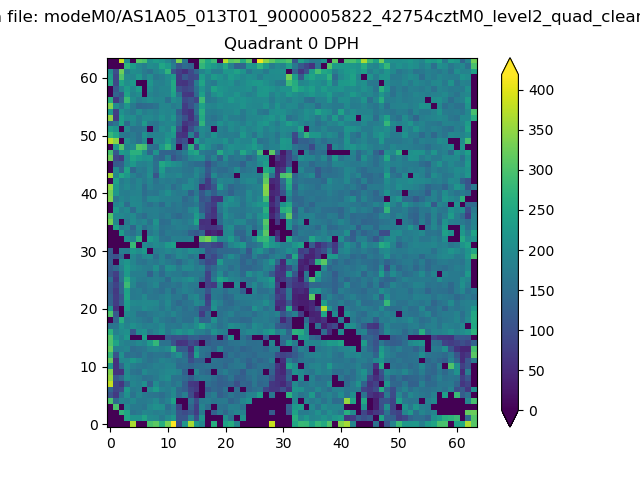 |
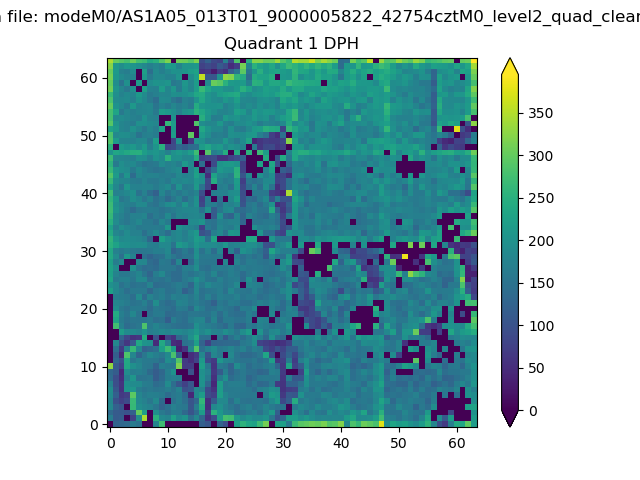 |
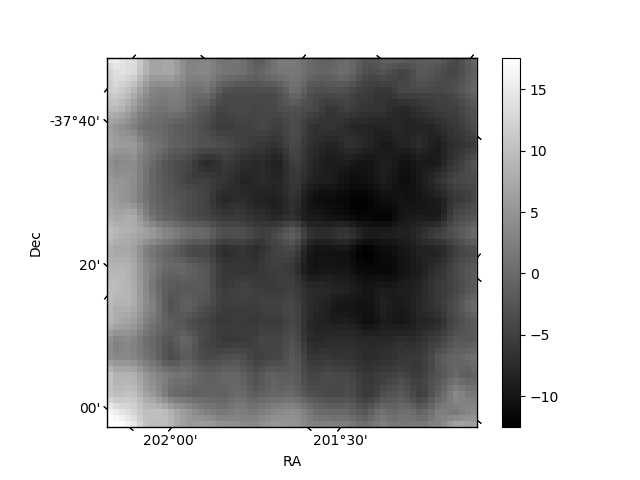
Quadrant B |
|---|---|---|---|
| Quadrant D | 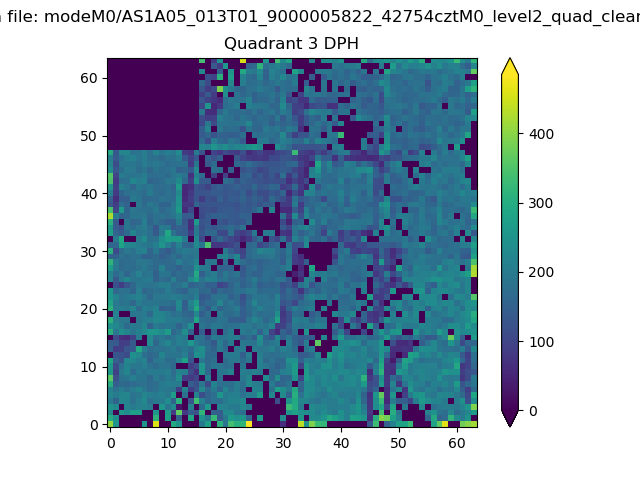 |
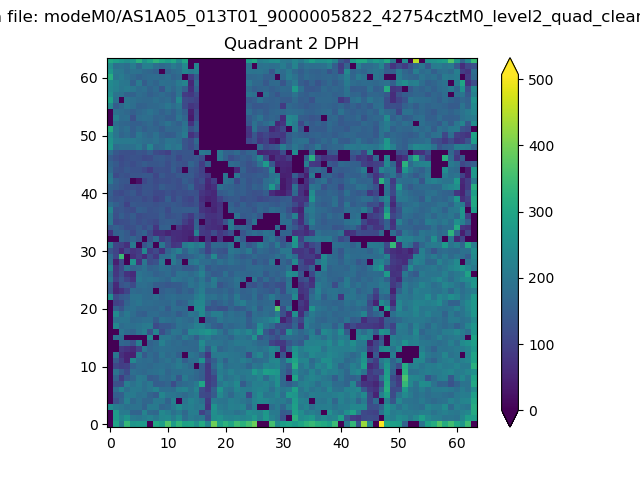 |
Quadrant C |
| Plot type | Count rate plots | Images |
|---|---|---|
| Comparison with Poisson distribution Blue bars denote a histogram of data divided into 1 sec bins. Red curve is a Poisson curve with rate = median count rate of data. |
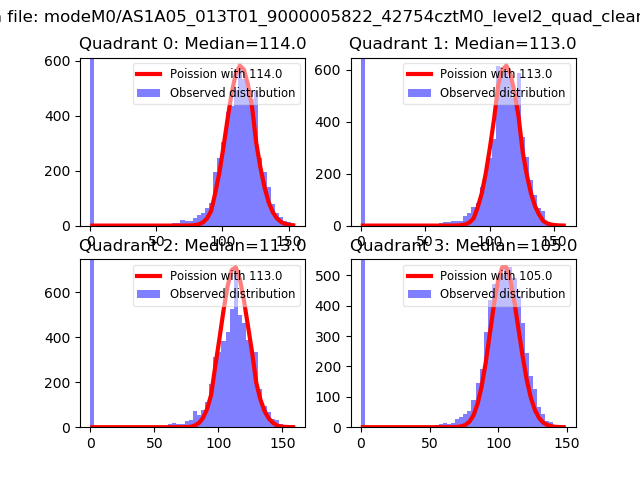 |
 |
| Quadrant-wise count rates Data is divided into 100 sec bins |
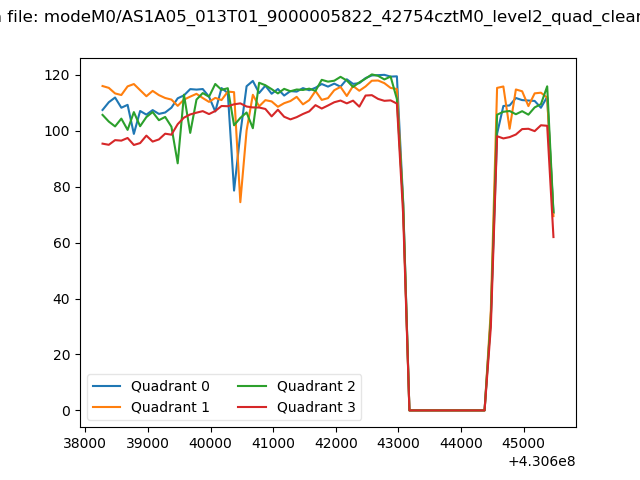 |
|
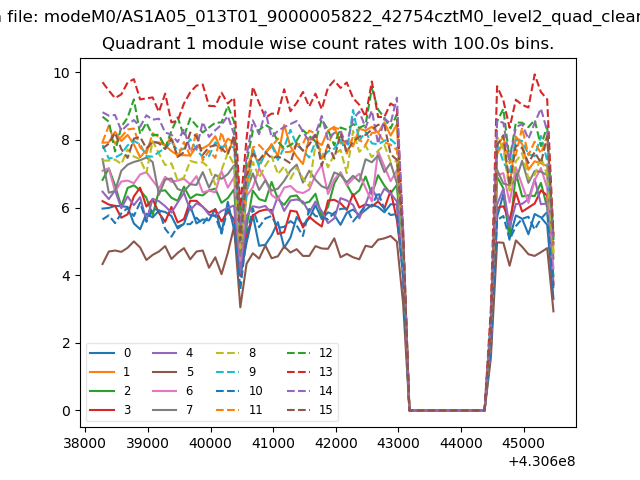
| Module-wise count rates for Quadrant A Data is divided into 100 sec bins |
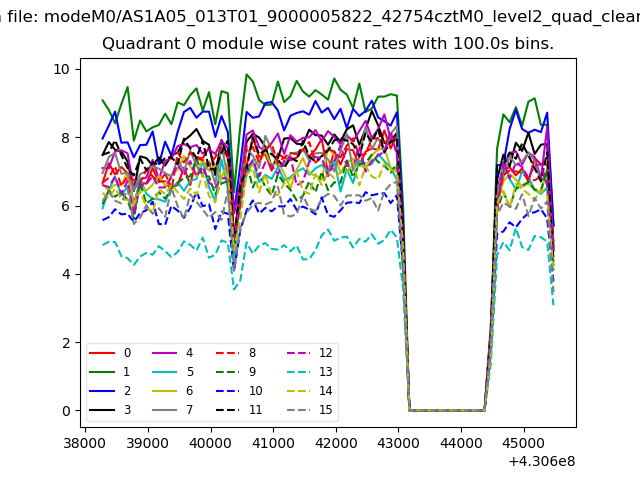 |
 |
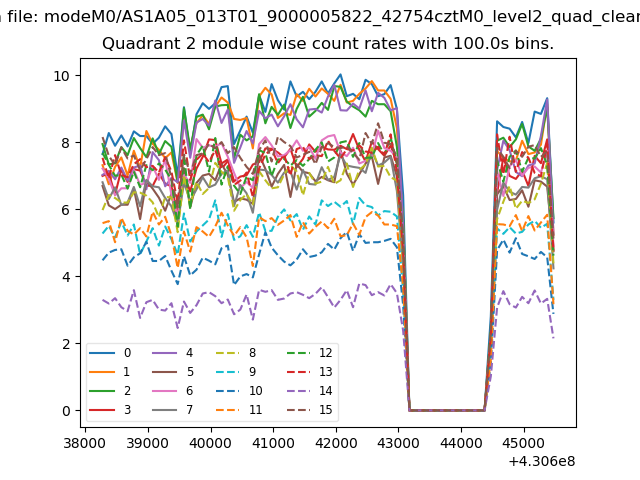
| Module-wise count rates for Quadrant B Data is divided into 100 sec bins |
 |
 |
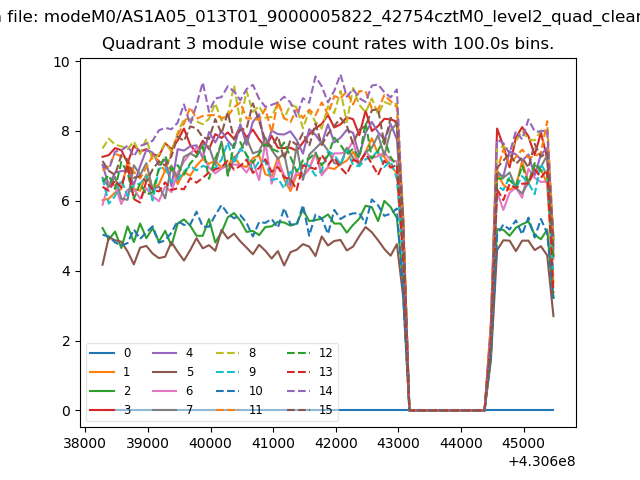
| Module-wise count rates for Quadrant C Data is divided into 100 sec bins |
 |
 |
| Module-wise count rates for Quadrant D Data is divided into 100 sec bins |
 |
 |
| Parameter | Plot |
|---|---|
| CZT HV Monitor | 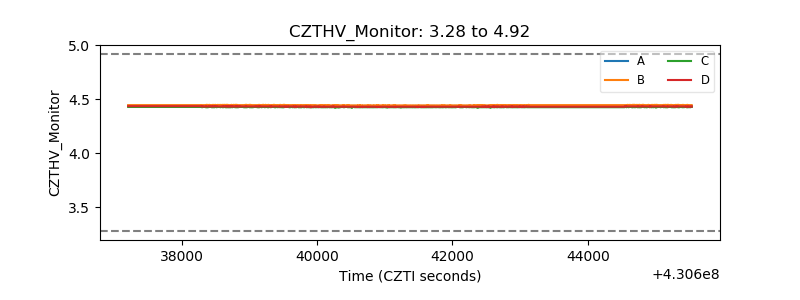 |
| D_VDD | 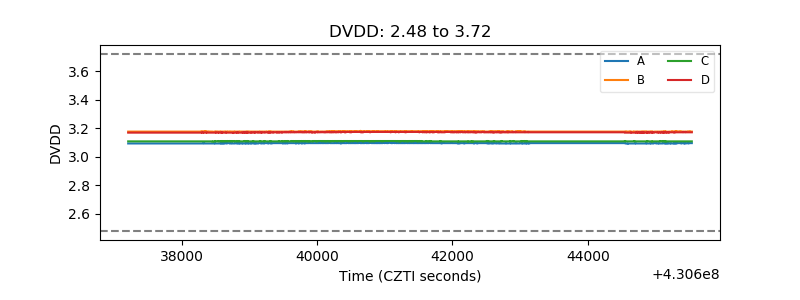 |
| Temperature 1 | 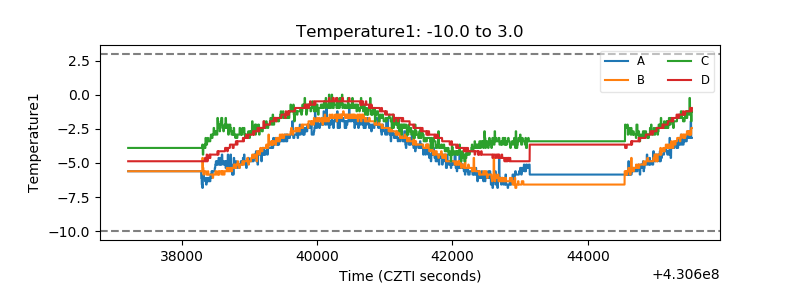 |
| Veto HV Monitor | 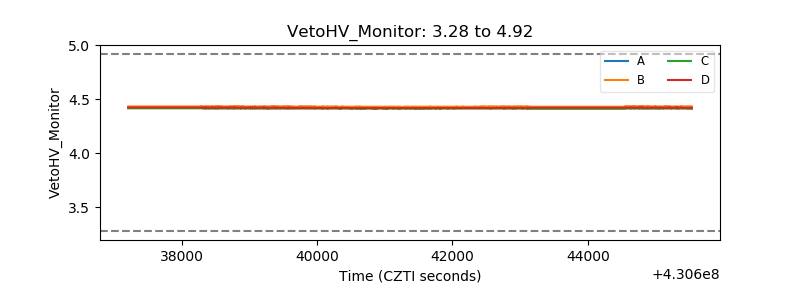 |
| Veto LLD | 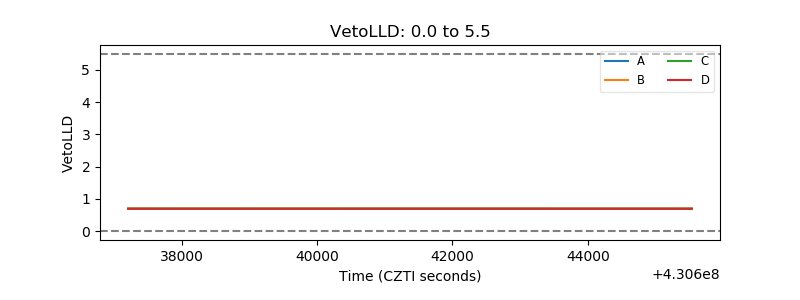 |
| Alpha Counter | 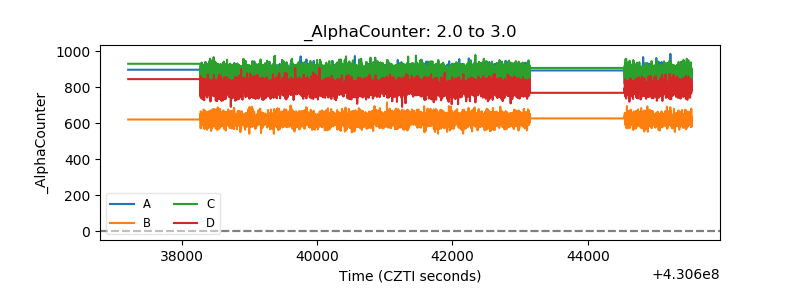 |
| _CPM_Rate | 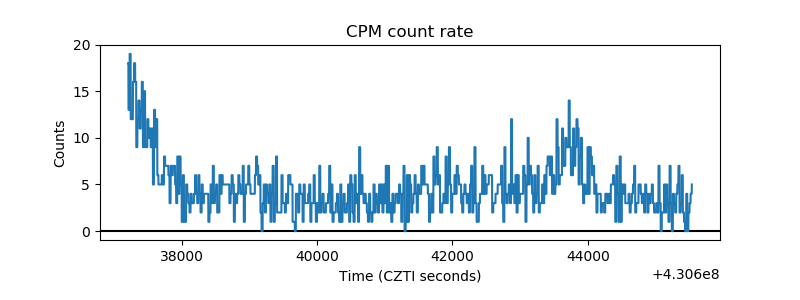 |
| CZT Counter | 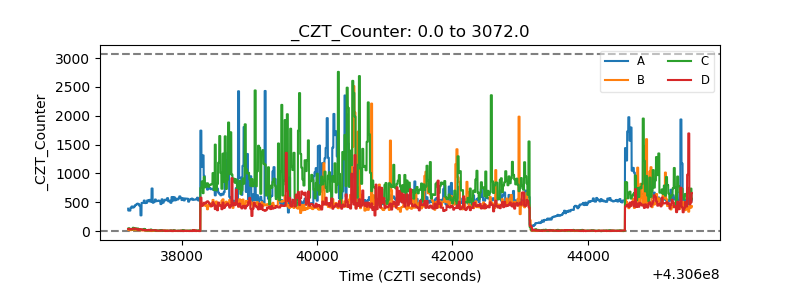 |
| +2.5 Volts monitor | 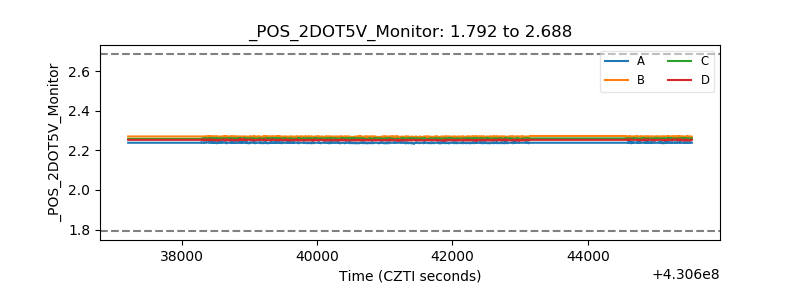 |
| +5 Volts monitor | 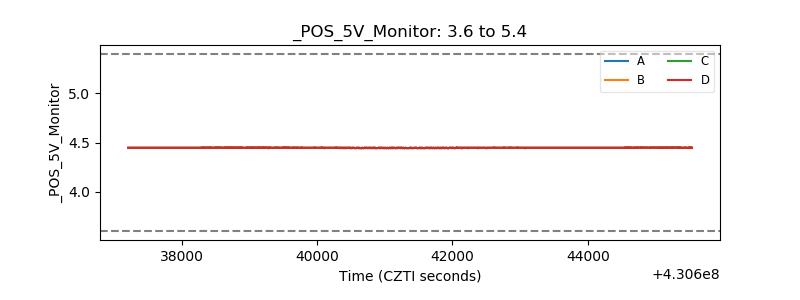 |
| _ROLL_ROT | 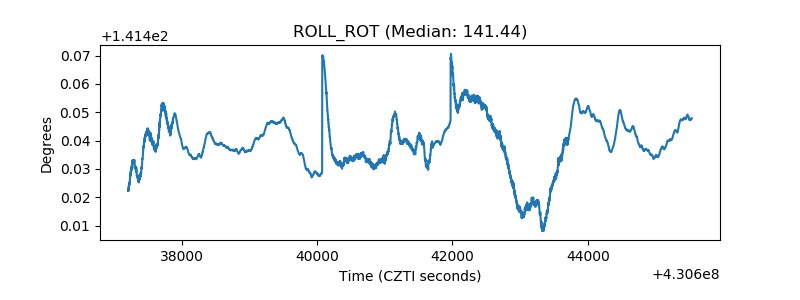 |
| _Roll_DEC | 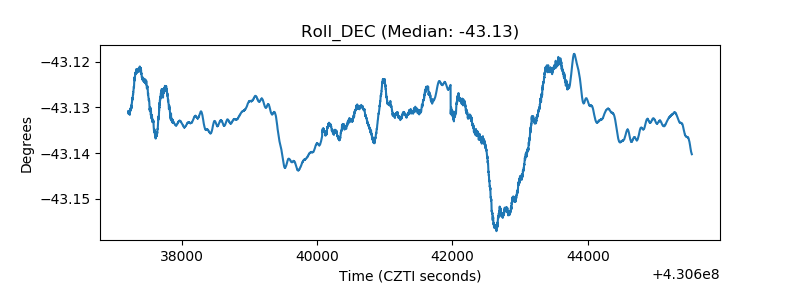 |
| _Roll_RA | 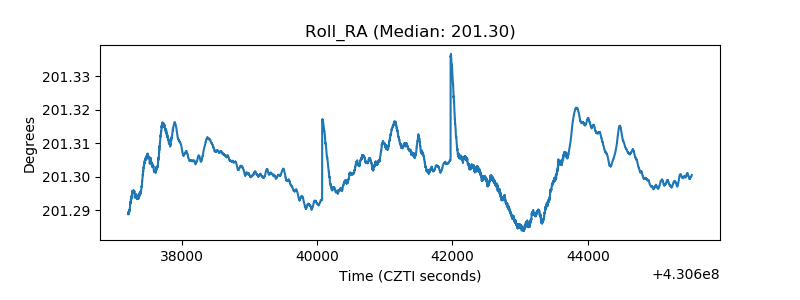 |
| Veto Counter | 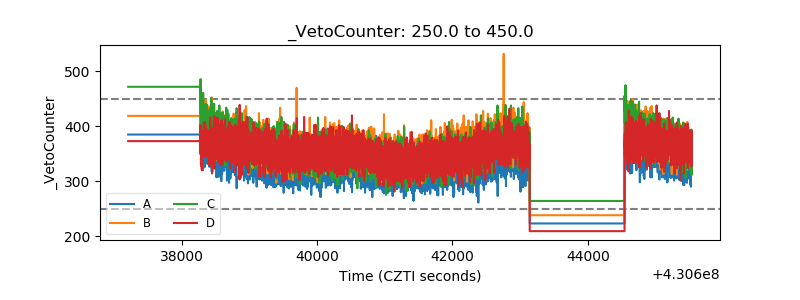 |