| Param | Original file | Final file |
|---|---|---|
| Filename | modeM0/AS1A05_013T01_9000005822_42755cztM0_level2.fits | modeM0/AS1A05_013T01_9000005822_42755cztM0_level2_quad_clean.evt |
| Size (bytes) | 469,391,040 | 97,856,640 |
| Size | 447.6 MB | 93.3 MB |
| Events in quadrant A | 4,281,100 | 653,256 |
| Events in quadrant B | 3,085,962 | 656,316 |
| Events in quadrant C | 5,815,047 | 630,450 |
| Events in quadrant D | 3,734,828 | 610,148 |
| Mode M0 | |||
|---|---|---|---|
| Quadrant | BADHDUFLAG | Total packets | Discarded packets |
| A | 0 | 16440 | 1 |
| B | 0 | 13253 | 2 |
| C | 0 | 21440 | 2 |
| D | 0 | 15124 | 2 |
| Mode M9 | |||
|---|---|---|---|
| Quadrant | BADHDUFLAG | Total packets | Discarded packets |
| A | 0 | 14 | 0 |
| B | 0 | 14 | 0 |
| C | 0 | 14 | 0 |
| D | 0 | 14 | 0 |
| Mode SS | |||
|---|---|---|---|
| Quadrant | BADHDUFLAG | Total packets | Discarded packets |
| A | 0 | 120 | 0 |
| B | 0 | 120 | 0 |
| C | 0 | 120 | 0 |
| D | 0 | 120 | 0 |
| Quadrant | Total seconds | Saturated seconds | Saturation percentage |
|---|---|---|---|
| A | 5905 | 253 | 4.284505% |
| B | 5906 | 114 | 1.930240% |
| C | 5906 | 410 | 6.942093% |
| D | 5906 | 183 | 3.098544% |
Noise dominated data is calculated using 1-second bins in cleaned event files. If a bin has >2000 counts, and if more than 50% of those come from <1% of pixels, then it is considered to be noise-dominated and hence unusable.
| Quadrant | # 1 sec bins | Bins with >0 counts | Bins with >2000 counts | High rate bins dominated by noise | Noise dominated (total time) | Noise dominated (detector-on time) | Marked lightcurve |
|---|---|---|---|---|---|---|---|
| A | 7218 | 5906 | 206 | 206 | 2.85% | 3.49% | 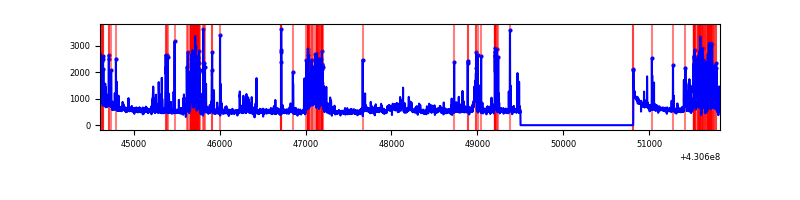 |
| B | 7219 | 5907 | 98 | 98 | 1.36% | 1.66% | 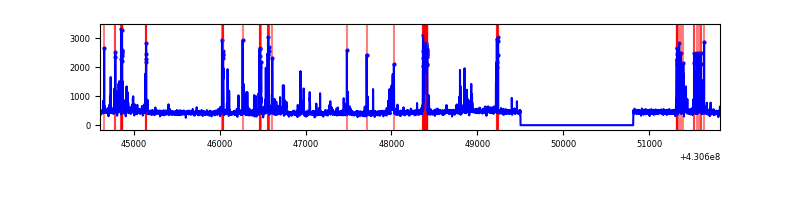 |
| C | 7219 | 5907 | 394 | 394 | 5.46% | 6.67% | 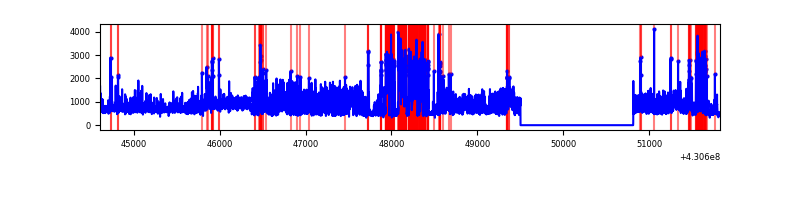 |
| D | 7219 | 5907 | 184 | 184 | 2.55% | 3.11% | 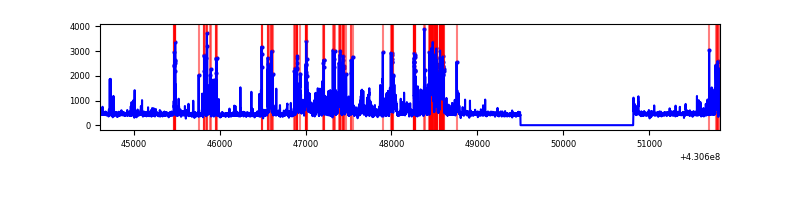 |
Top three noisy pixels from each quadrant. If the there are fewer than three noisy pixels in the level2.evt file, extra rows are filled as -1
| Pixel properties | Quadrant properties | ||||||
|---|---|---|---|---|---|---|---|
| Quadrant | DetID | PixID | Counts | Sigma | Mean | Median | Sigma |
| A | 13 | 248 | 875139 | 6483.61 | 656 | 642 | 134.9 |
| A | 10 | 83 | 582973 | 4317.46 | 656 | 642 | 134.9 |
| A | 12 | 189 | 137658 | 1015.85 | 656 | 642 | 134.9 |
| B | 5 | 172 | 202846 | 1598.67 | 644 | 628 | 126.5 |
| B | 10 | 246 | 198251 | 1562.34 | 644 | 628 | 126.5 |
| B | 5 | 255 | 74488 | 583.91 | 644 | 628 | 126.5 |
| C | 0 | 239 | 2985614 | 20237.23 | 627 | 631 | 147.5 |
| C | 15 | 214 | 242149 | 1637.41 | 627 | 631 | 147.5 |
| C | 14 | 254 | 111879 | 754.23 | 627 | 631 | 147.5 |
| D | 2 | 249 | 962918 | 6034.71 | 646 | 628 | 159.5 |
| D | 13 | 249 | 102335 | 637.82 | 646 | 628 | 159.5 |
| D | 5 | 171 | 40639 | 250.92 | 646 | 628 | 159.5 |
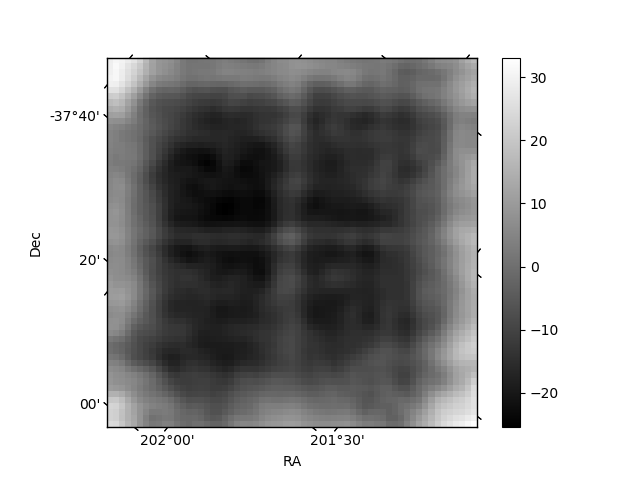
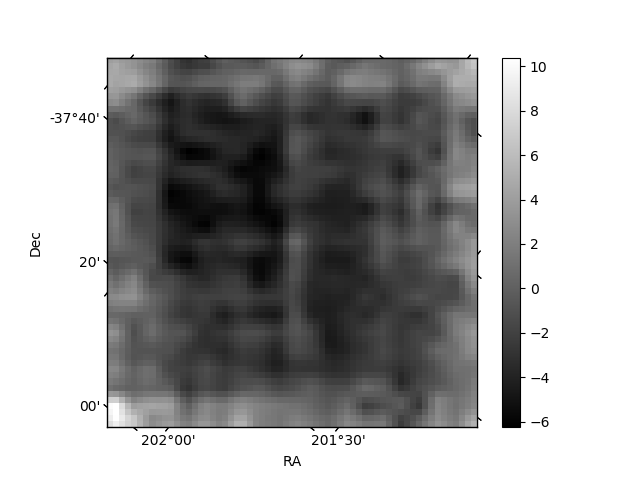
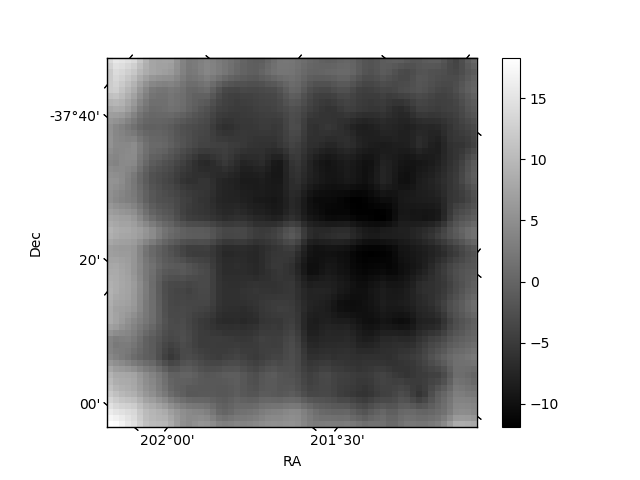
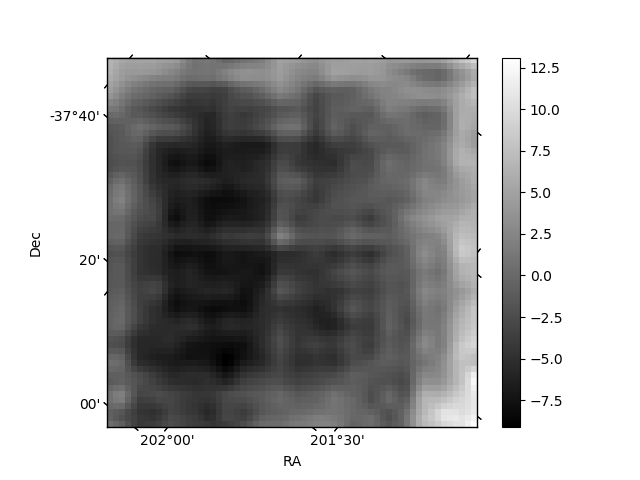
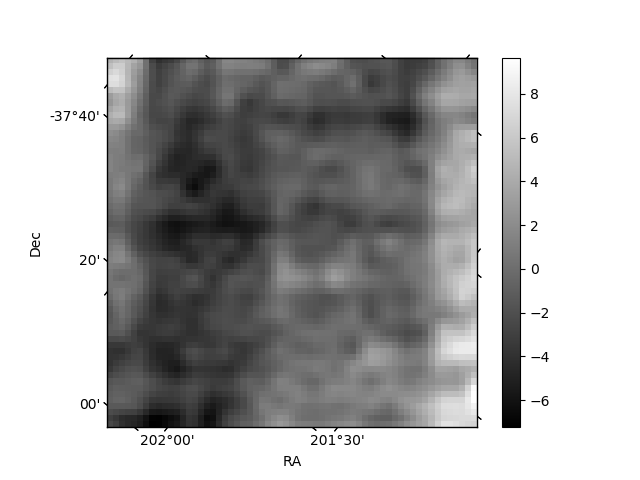
Histogram calculated using DETX and DETY for each event in the final _common_clean file
| Quadrant A | 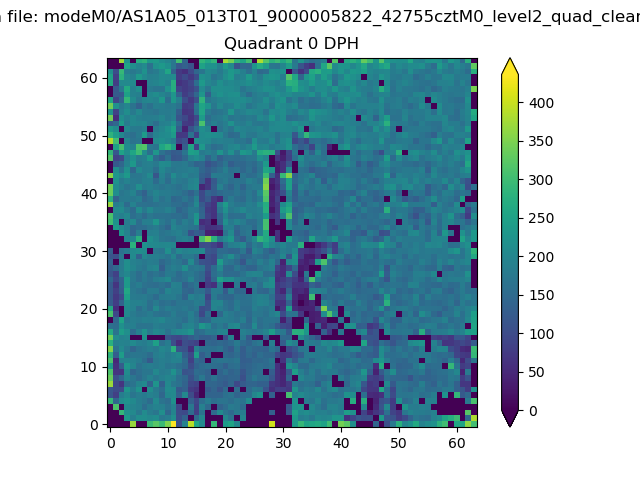 |
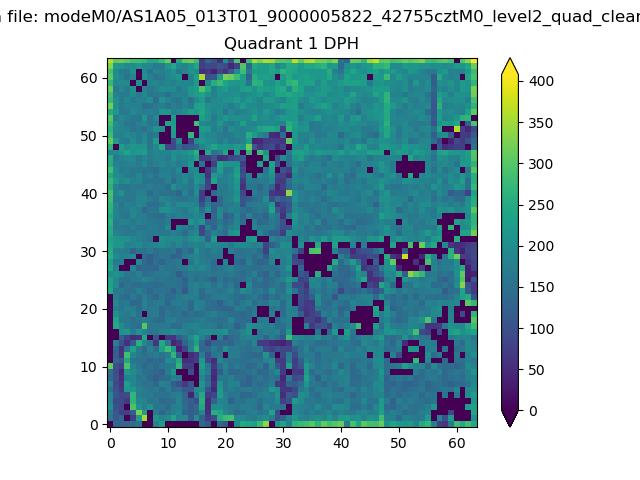 |
Quadrant B |
|---|---|---|---|
| Quadrant D | 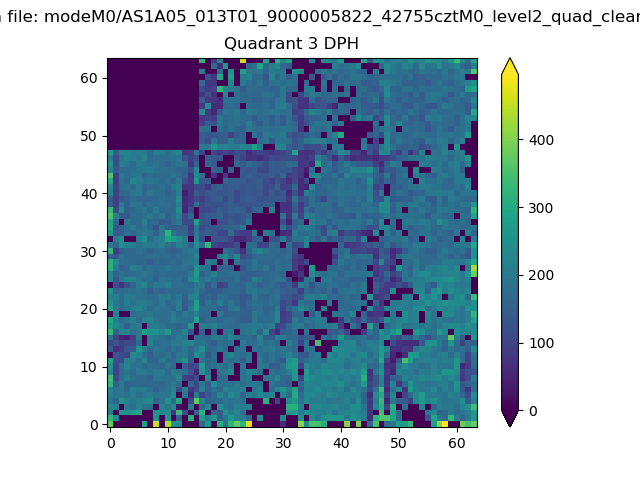 |
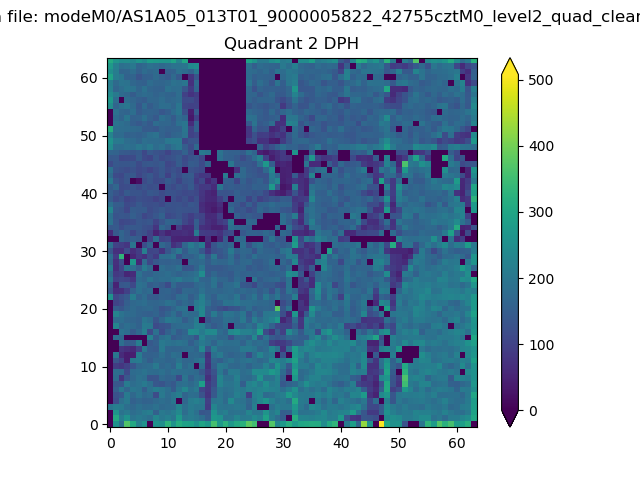 |
Quadrant C |
| Plot type | Count rate plots | Images |
|---|---|---|
| Comparison with Poisson distribution Blue bars denote a histogram of data divided into 1 sec bins. Red curve is a Poisson curve with rate = median count rate of data. |
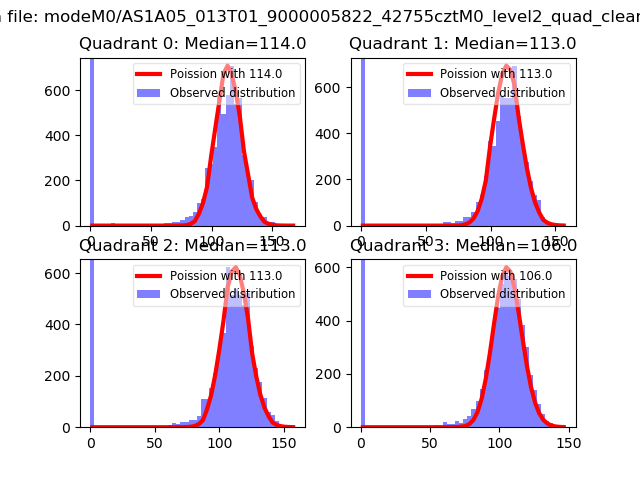 |
 |
| Quadrant-wise count rates Data is divided into 100 sec bins |
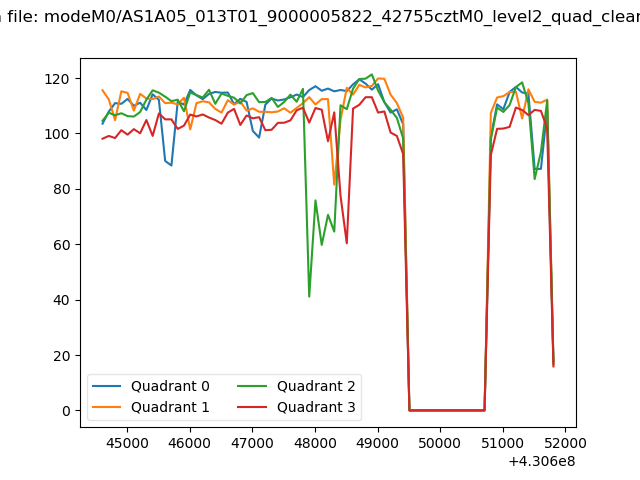 |
|
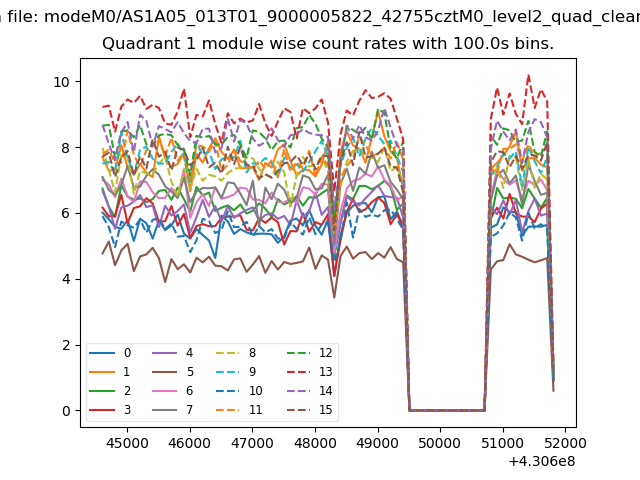
| Module-wise count rates for Quadrant A Data is divided into 100 sec bins |
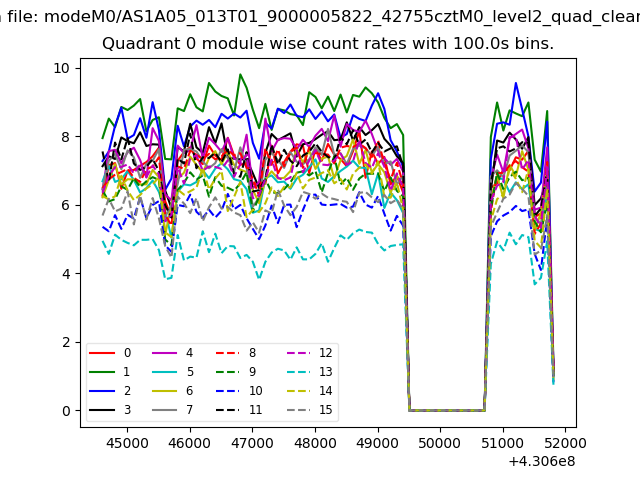 |
 |
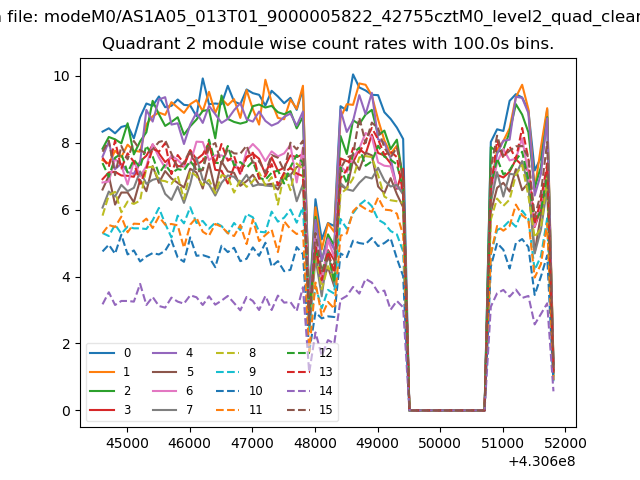
| Module-wise count rates for Quadrant B Data is divided into 100 sec bins |
 |
 |
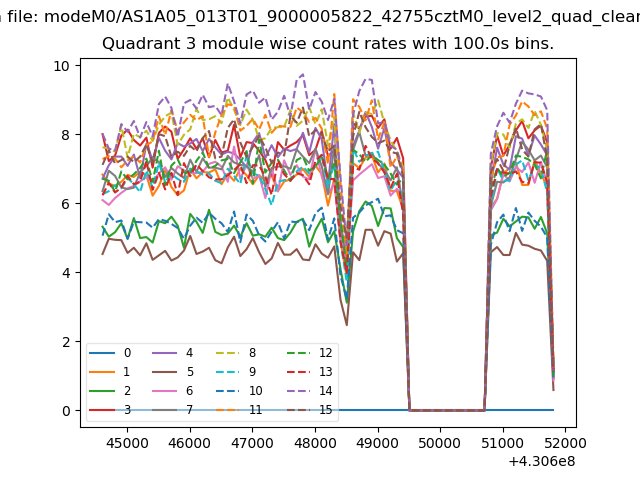
| Module-wise count rates for Quadrant C Data is divided into 100 sec bins |
 |
 |
| Module-wise count rates for Quadrant D Data is divided into 100 sec bins |
 |
 |
| Parameter | Plot |
|---|---|
| CZT HV Monitor | 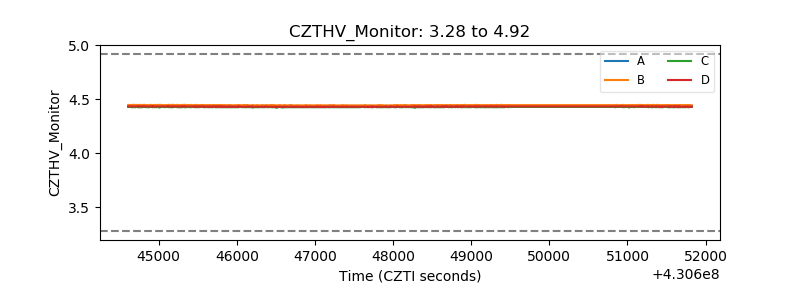 |
| D_VDD | 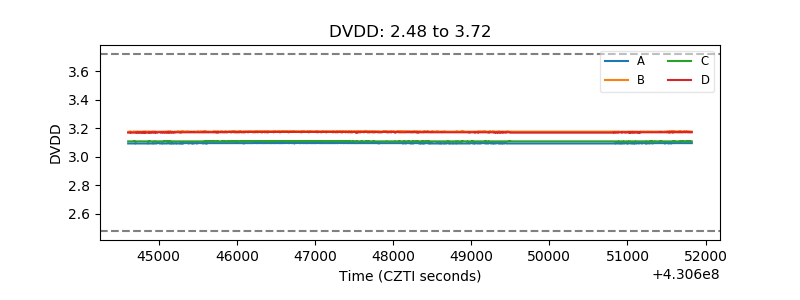 |
| Temperature 1 | 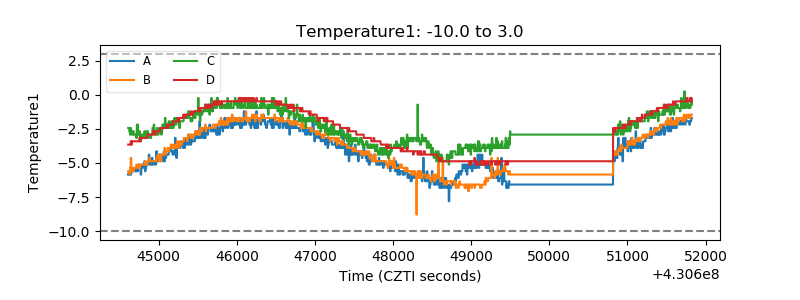 |
| Veto HV Monitor | 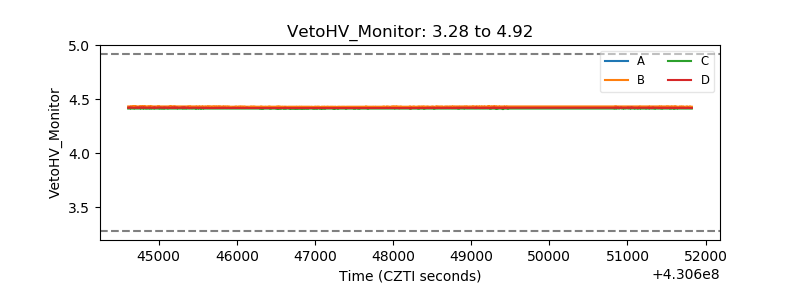 |
| Veto LLD | 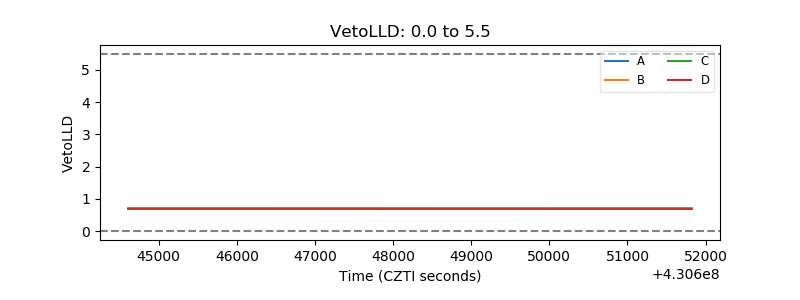 |
| Alpha Counter | 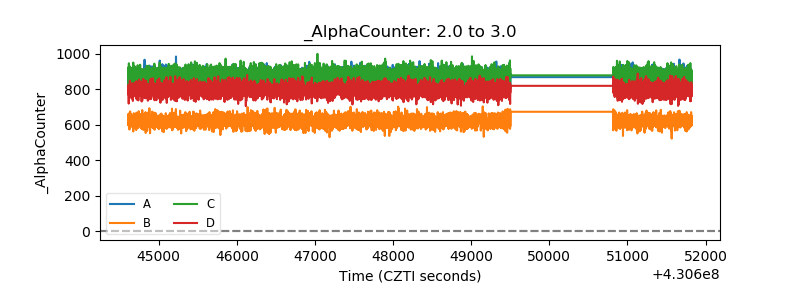 |
| _CPM_Rate | 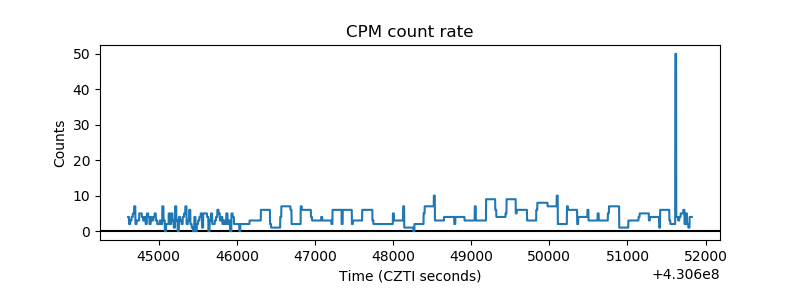 |
| CZT Counter | 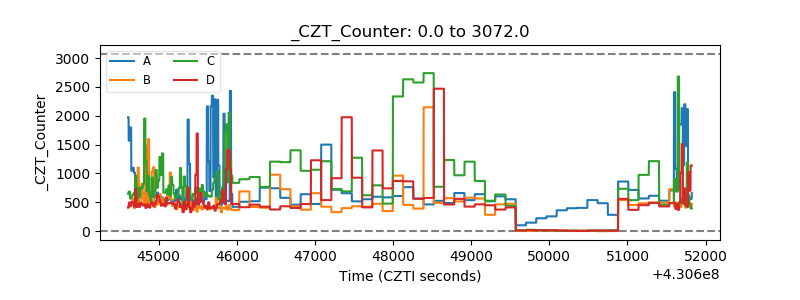 |
| +2.5 Volts monitor |  |
| +5 Volts monitor | 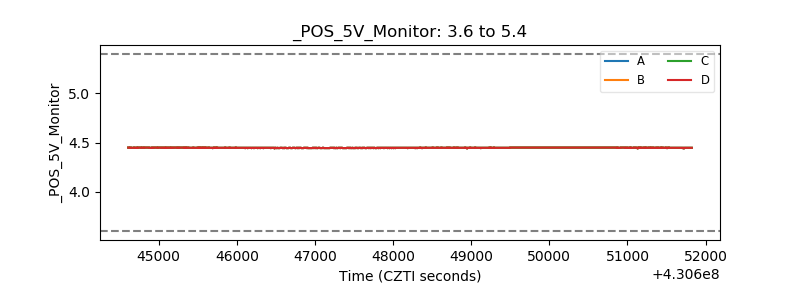 |
| _ROLL_ROT | 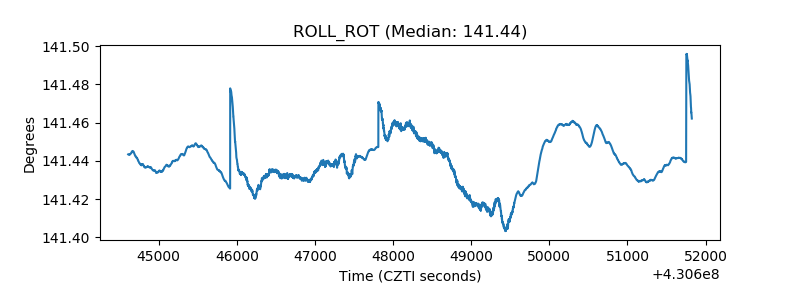 |
| _Roll_DEC | 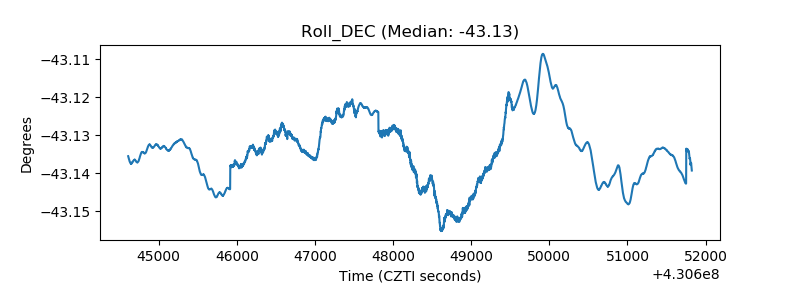 |
| _Roll_RA | 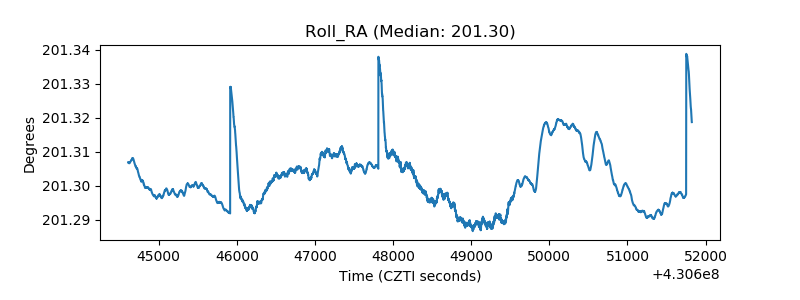 |
| Veto Counter | 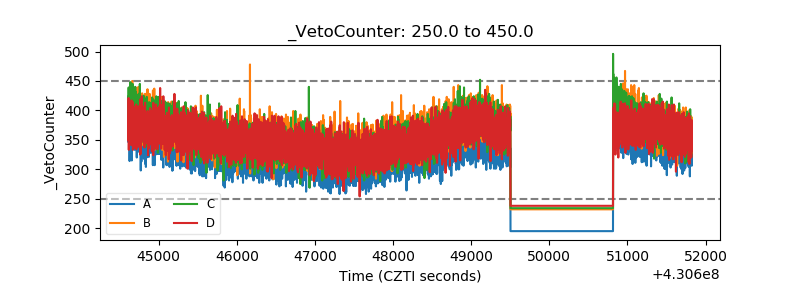 |