| Param | Original file | Final file |
|---|---|---|
| Filename | modeM0/AS1A05_013T01_9000005822_42758cztM0_level2.fits | modeM0/AS1A05_013T01_9000005822_42758cztM0_level2_quad_clean.evt |
| Size (bytes) | 1,134,273,600 | 252,241,920 |
| Size | 1.1 GB | 240.6 MB |
| Events in quadrant A | 10,439,246 | 1,691,973 |
| Events in quadrant B | 8,204,187 | 1,687,287 |
| Events in quadrant C | 13,211,511 | 1,620,871 |
| Events in quadrant D | 8,928,358 | 1,563,140 |
| Mode M0 | |||
|---|---|---|---|
| Quadrant | BADHDUFLAG | Total packets | Discarded packets |
| A | 0 | 40381 | 4 |
| B | 0 | 34886 | 4 |
| C | 0 | 49442 | 4 |
| D | 0 | 37408 | 5 |
| Mode M9 | |||
|---|---|---|---|
| Quadrant | BADHDUFLAG | Total packets | Discarded packets |
| A | 0 | 46 | 0 |
| B | 0 | 47 | 0 |
| C | 0 | 47 | 0 |
| D | 0 | 47 | 0 |
| Mode SS | |||
|---|---|---|---|
| Quadrant | BADHDUFLAG | Total packets | Discarded packets |
| A | 0 | 316 | 0 |
| B | 0 | 316 | 0 |
| C | 0 | 316 | 0 |
| D | 0 | 316 | 0 |
| Quadrant | Total seconds | Saturated seconds | Saturation percentage |
|---|---|---|---|
| A | 15565 | 596 | 3.829104% |
| B | 15565 | 398 | 2.557019% |
| C | 15565 | 1095 | 7.035014% |
| D | 15564 | 485 | 3.116166% |
Noise dominated data is calculated using 1-second bins in cleaned event files. If a bin has >2000 counts, and if more than 50% of those come from <1% of pixels, then it is considered to be noise-dominated and hence unusable.
| Quadrant | # 1 sec bins | Bins with >0 counts | Bins with >2000 counts | High rate bins dominated by noise | Noise dominated (total time) | Noise dominated (detector-on time) | Marked lightcurve |
|---|---|---|---|---|---|---|---|
| A | 19773 | 15568 | 466 | 466 | 2.36% | 2.99% | 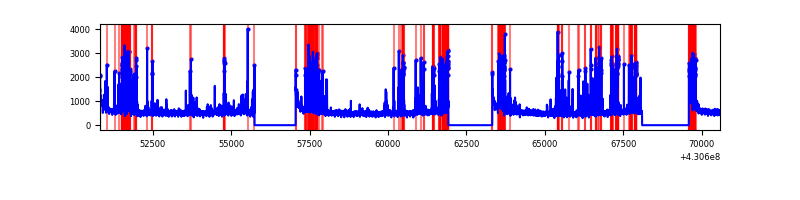 |
| B | 19773 | 15567 | 354 | 354 | 1.79% | 2.27% | 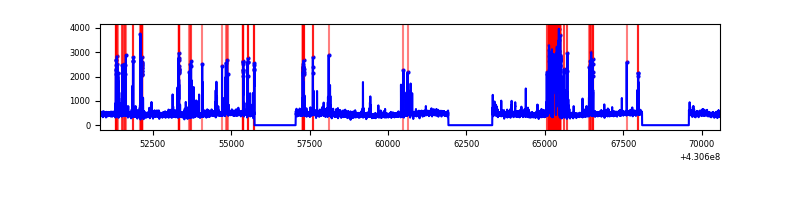 |
| C | 19773 | 15568 | 1082 | 1082 | 5.47% | 6.95% | 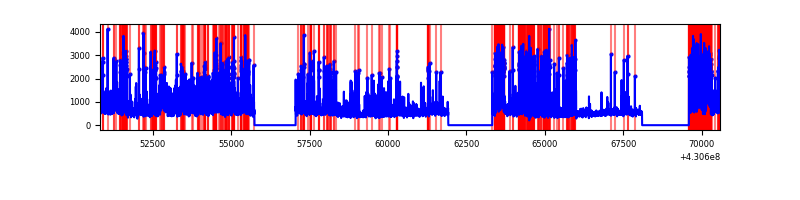 |
| D | 19772 | 15567 | 484 | 484 | 2.45% | 3.11% | 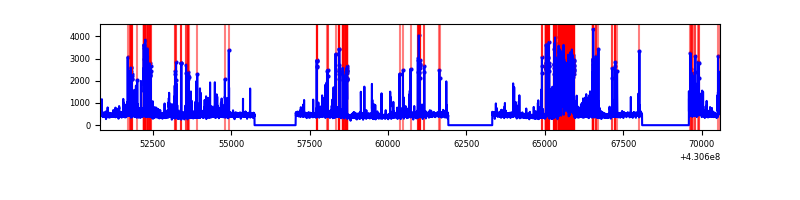 |
Top three noisy pixels from each quadrant. If the there are fewer than three noisy pixels in the level2.evt file, extra rows are filled as -1
| Pixel properties | Quadrant properties | ||||||
|---|---|---|---|---|---|---|---|
| Quadrant | DetID | PixID | Counts | Sigma | Mean | Median | Sigma |
| A | 10 | 83 | 1571246 | 4482.87 | 1713 | 1677 | 350.1 |
| A | 13 | 248 | 1359603 | 3878.39 | 1713 | 1677 | 350.1 |
| A | 15 | 237 | 594514 | 1693.21 | 1713 | 1677 | 350.1 |
| B | 0 | 229 | 782949 | 2403.64 | 1690 | 1642 | 325.1 |
| B | 5 | 172 | 299734 | 917.06 | 1690 | 1642 | 325.1 |
| B | 10 | 246 | 120682 | 366.22 | 1690 | 1642 | 325.1 |
| C | 0 | 239 | 5326661 | 13866.54 | 1643 | 1655 | 384.0 |
| C | 14 | 254 | 778841 | 2023.83 | 1643 | 1655 | 384.0 |
| C | 15 | 214 | 624831 | 1622.78 | 1643 | 1655 | 384.0 |
| D | 12 | 233 | 1115671 | 2694.75 | 1681 | 1635 | 413.4 |
| D | 2 | 249 | 336081 | 808.99 | 1681 | 1635 | 413.4 |
| D | 13 | 249 | 270968 | 651.49 | 1681 | 1635 | 413.4 |
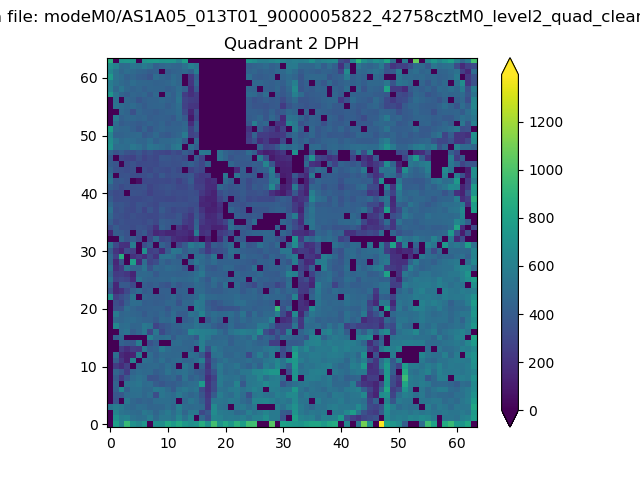
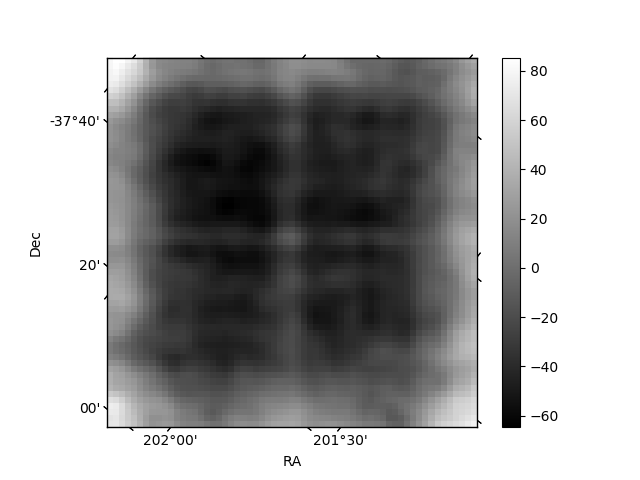
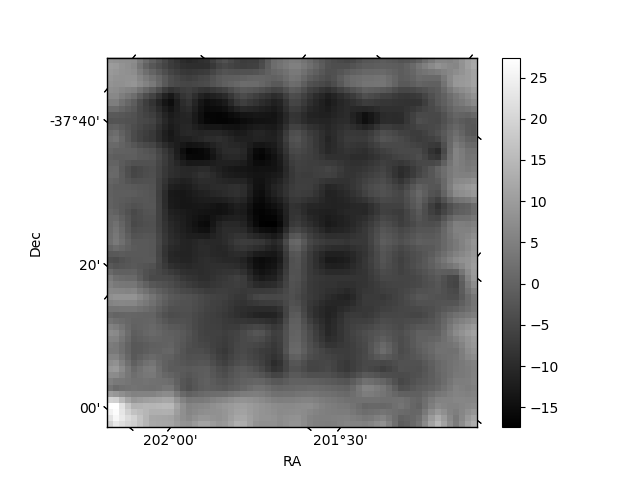
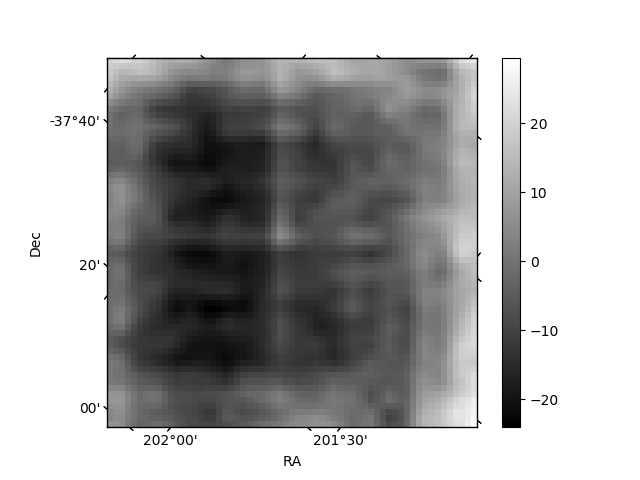
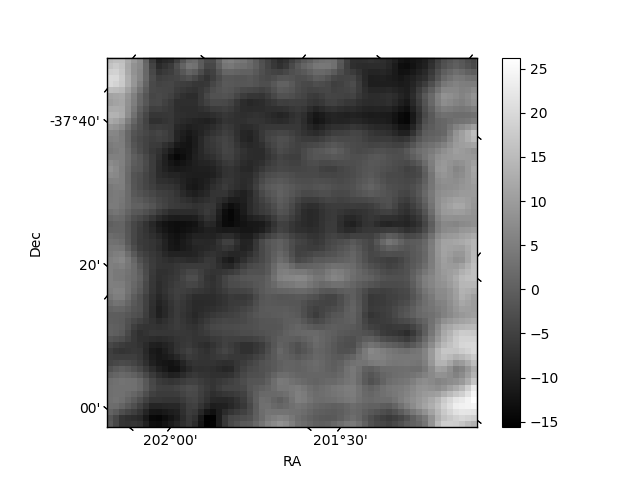
Histogram calculated using DETX and DETY for each event in the final _common_clean file
| Quadrant A | 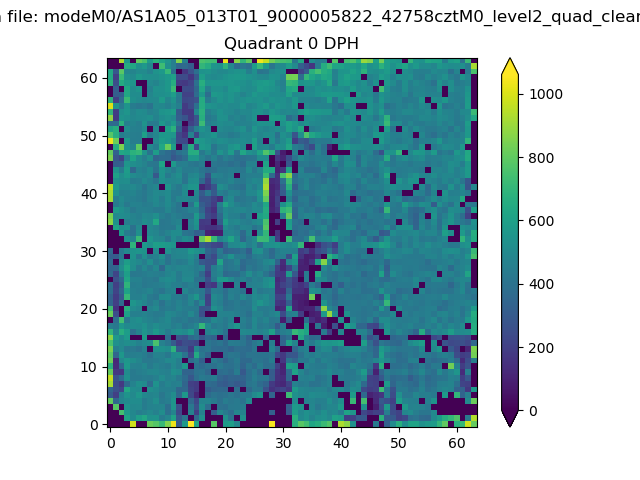 |
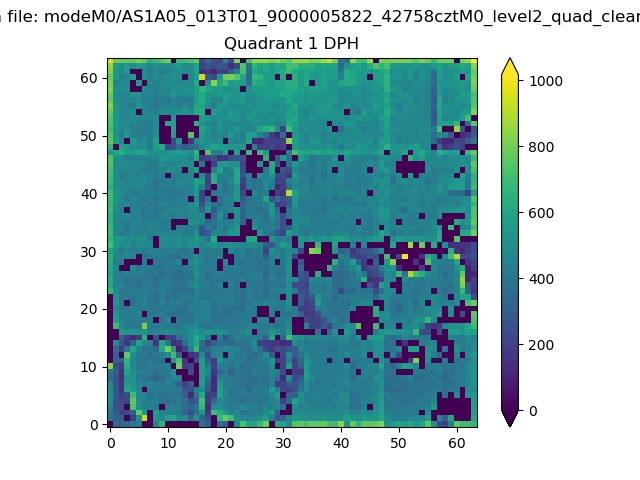 |
Quadrant B |
|---|---|---|---|
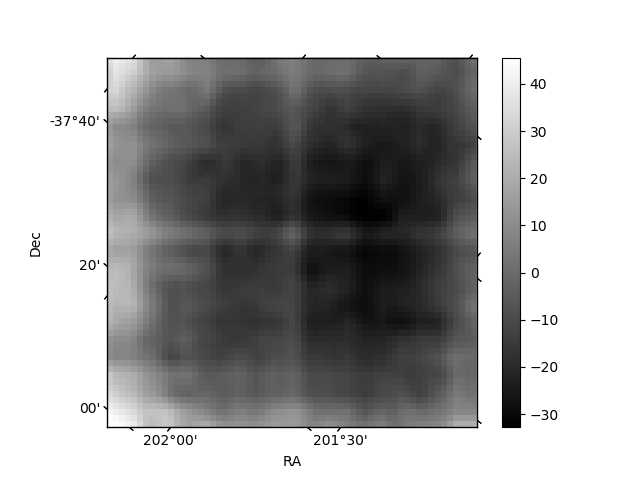
| Quadrant D | 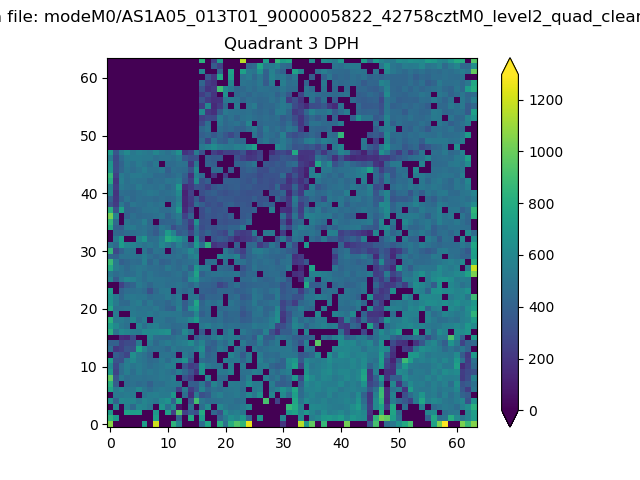 |
 |
Quadrant C |
| Plot type | Count rate plots | Images |
|---|---|---|
| Comparison with Poisson distribution Blue bars denote a histogram of data divided into 1 sec bins. Red curve is a Poisson curve with rate = median count rate of data. |
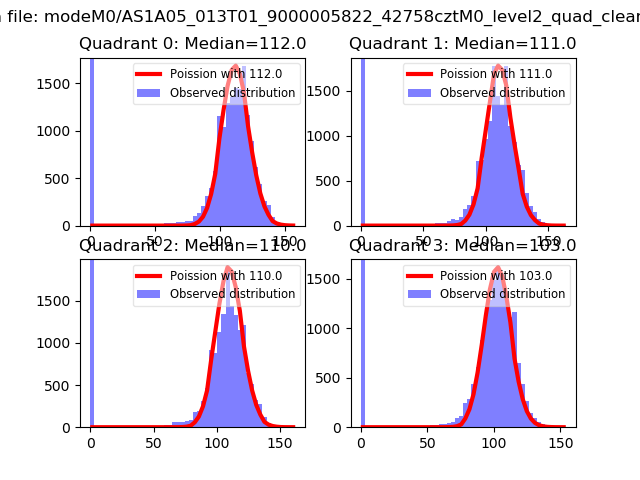 |
 |
| Quadrant-wise count rates Data is divided into 100 sec bins |
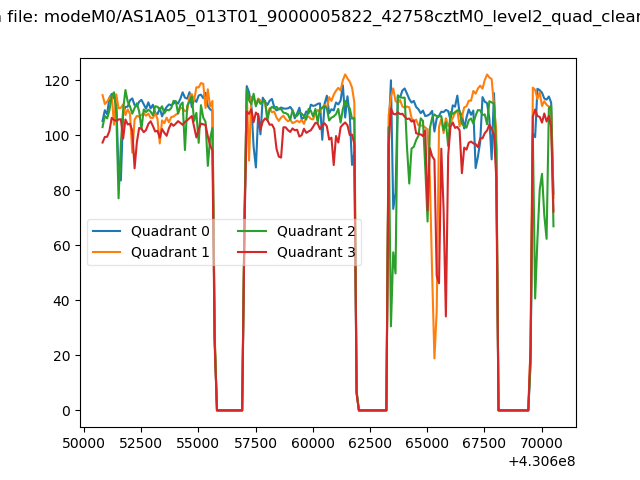 |
|
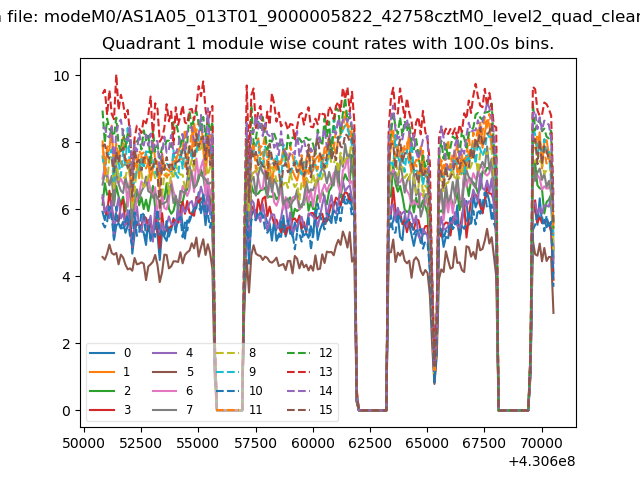
| Module-wise count rates for Quadrant A Data is divided into 100 sec bins |
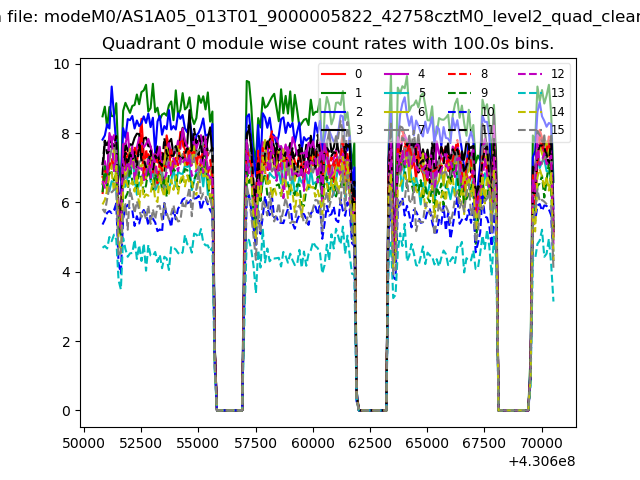 |
 |
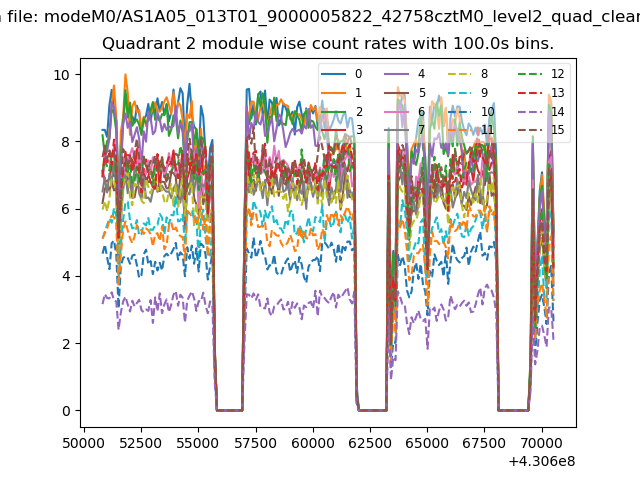
| Module-wise count rates for Quadrant B Data is divided into 100 sec bins |
 |
 |
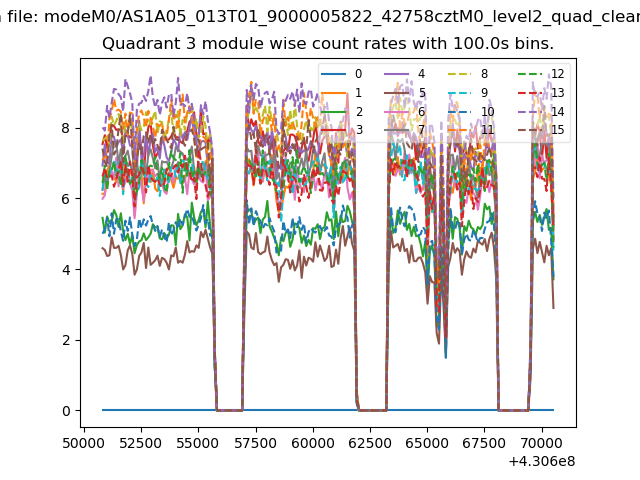
| Module-wise count rates for Quadrant C Data is divided into 100 sec bins |
 |
 |
| Module-wise count rates for Quadrant D Data is divided into 100 sec bins |
 |
 |
| Parameter | Plot |
|---|---|
| CZT HV Monitor | 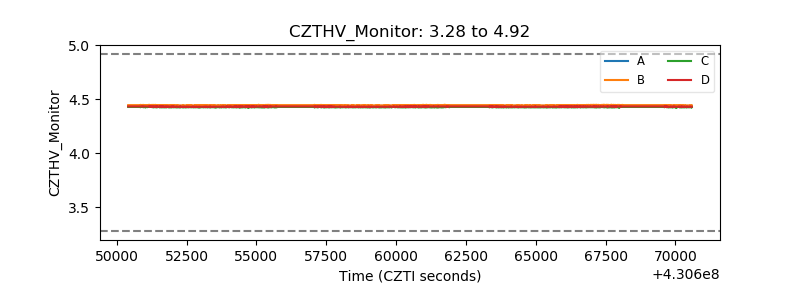 |
| D_VDD | 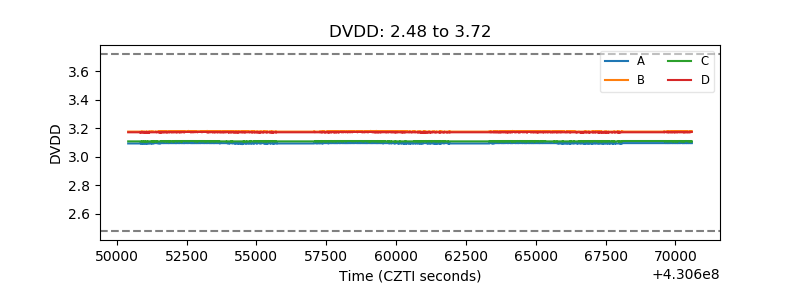 |
| Temperature 1 | 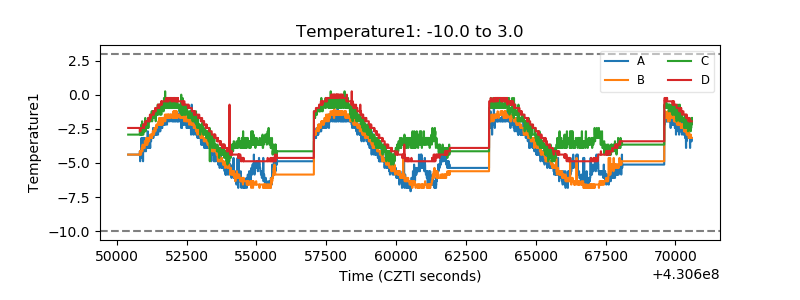 |
| Veto HV Monitor | 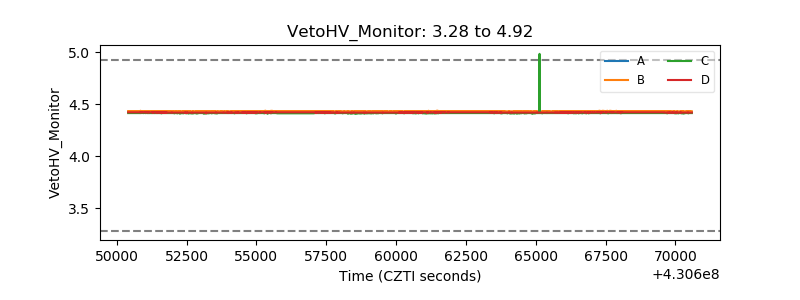 |
| Veto LLD | 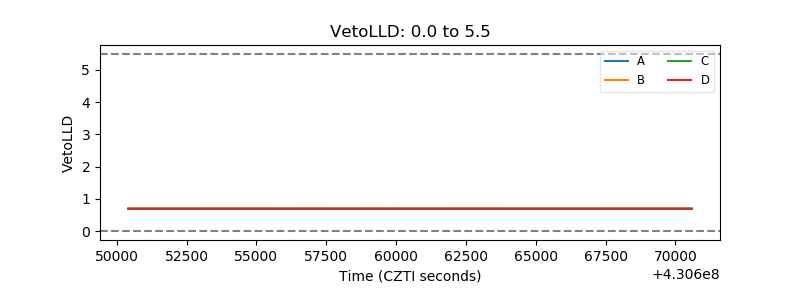 |
| Alpha Counter | 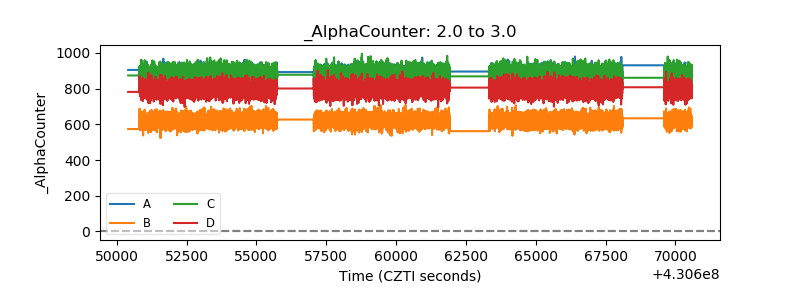 |
| _CPM_Rate | 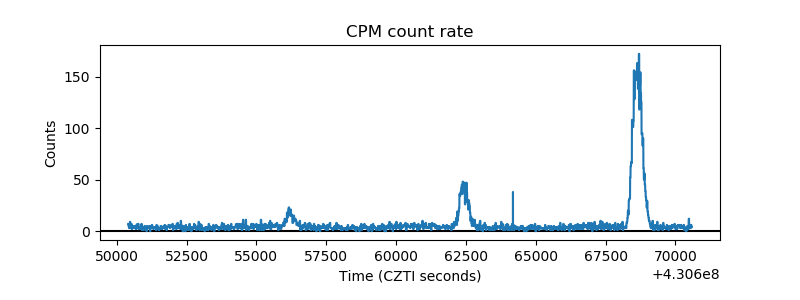 |
| CZT Counter | 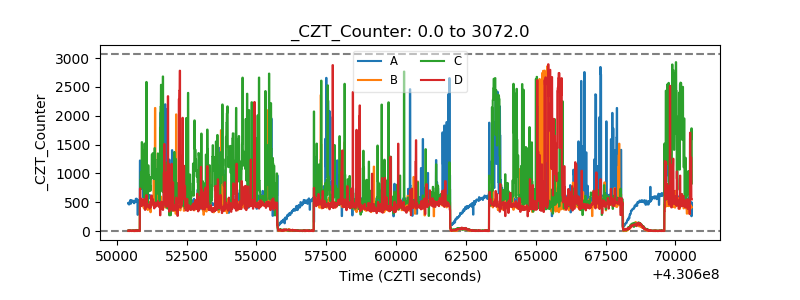 |
| +2.5 Volts monitor | 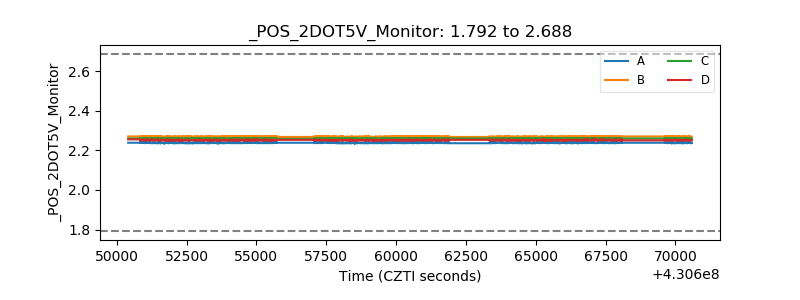 |
| +5 Volts monitor |  |
| _ROLL_ROT | 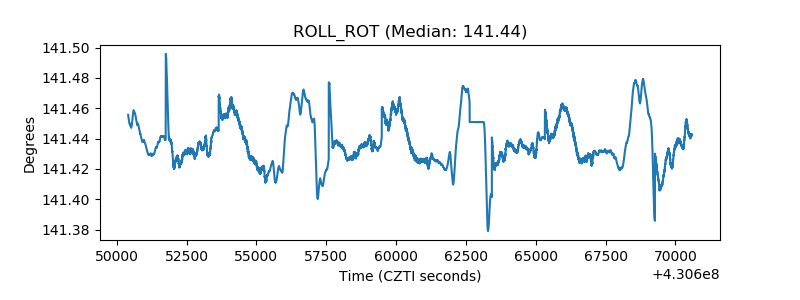 |
| _Roll_DEC | 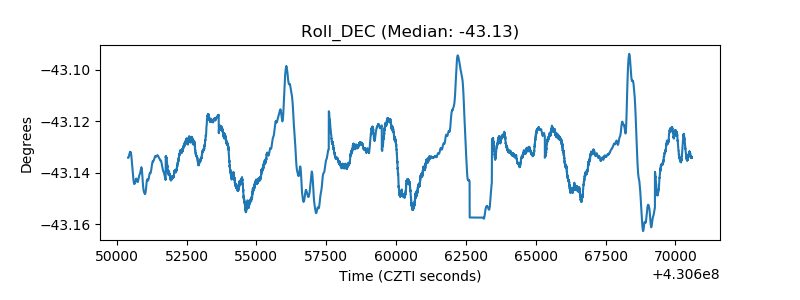 |
| _Roll_RA | 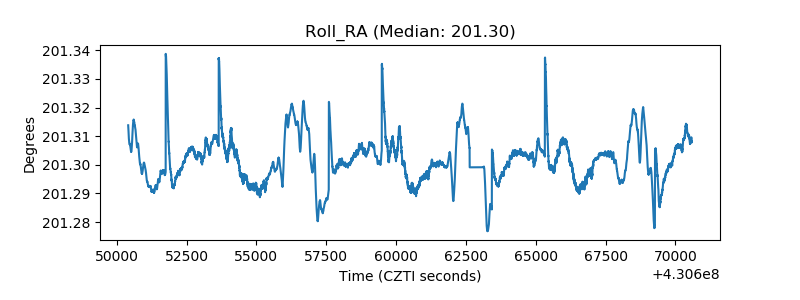 |
| Veto Counter | 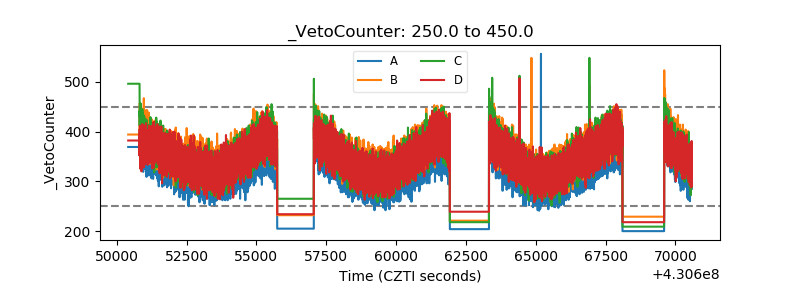 |