| Param | Original file | Final file |
|---|---|---|
| Filename | modeM0/AS1A05_013T01_9000005822_42759cztM0_level2.fits | modeM0/AS1A05_013T01_9000005822_42759cztM0_level2_quad_clean.evt |
| Size (bytes) | 398,888,640 | 84,919,680 |
| Size | 380.4 MB | 81.0 MB |
| Events in quadrant A | 3,349,620 | 573,983 |
| Events in quadrant B | 2,547,947 | 579,999 |
| Events in quadrant C | 5,702,379 | 513,721 |
| Events in quadrant D | 2,757,700 | 536,010 |
| Mode M0 | |||
|---|---|---|---|
| Quadrant | BADHDUFLAG | Total packets | Discarded packets |
| A | 0 | 13141 | 1 |
| B | 0 | 11192 | 1 |
| C | 0 | 20276 | 1 |
| D | 0 | 11942 | 1 |
| Mode M9 | |||
|---|---|---|---|
| Quadrant | BADHDUFLAG | Total packets | Discarded packets |
| A | 0 | 16 | 0 |
| B | 0 | 16 | 0 |
| C | 0 | 16 | 0 |
| D | 0 | 16 | 0 |
| Mode SS | |||
|---|---|---|---|
| Quadrant | BADHDUFLAG | Total packets | Discarded packets |
| A | 0 | 108 | 0 |
| B | 0 | 108 | 0 |
| C | 0 | 108 | 0 |
| D | 0 | 108 | 0 |
| Quadrant | Total seconds | Saturated seconds | Saturation percentage |
|---|---|---|---|
| A | 5244 | 153 | 2.917620% |
| B | 5244 | 49 | 0.934401% |
| C | 5244 | 809 | 15.427155% |
| D | 5244 | 71 | 1.353928% |
Noise dominated data is calculated using 1-second bins in cleaned event files. If a bin has >2000 counts, and if more than 50% of those come from <1% of pixels, then it is considered to be noise-dominated and hence unusable.
| Quadrant | # 1 sec bins | Bins with >0 counts | Bins with >2000 counts | High rate bins dominated by noise | Noise dominated (total time) | Noise dominated (detector-on time) | Marked lightcurve |
|---|---|---|---|---|---|---|---|
| A | 6887 | 5245 | 125 | 125 | 1.82% | 2.38% | 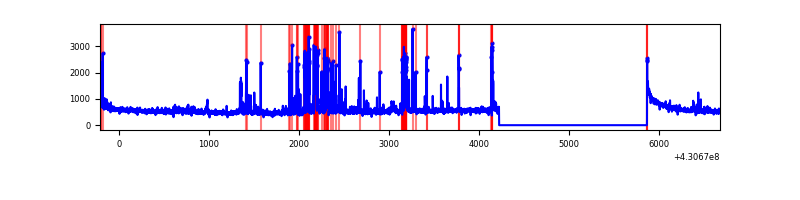 |
| B | 6887 | 5245 | 39 | 39 | 0.57% | 0.74% | 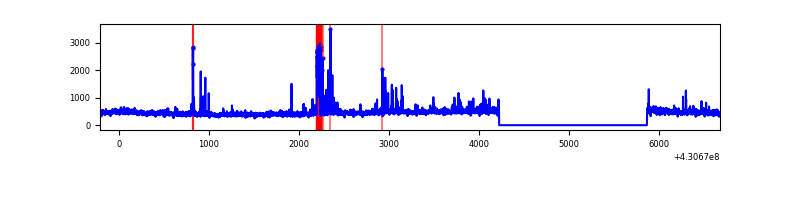 |
| C | 6887 | 5245 | 869 | 869 | 12.62% | 16.57% | 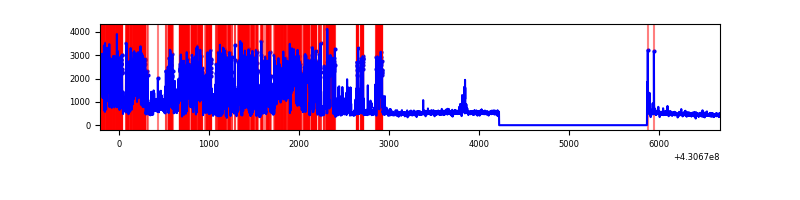 |
| D | 6887 | 5245 | 74 | 74 | 1.07% | 1.41% | 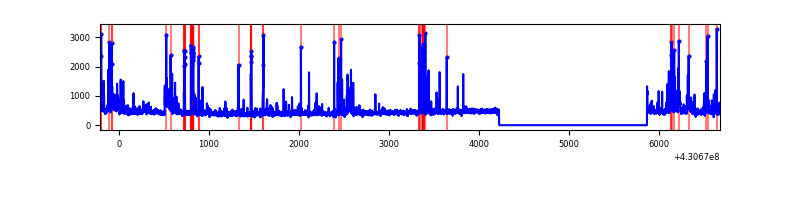 |
Top three noisy pixels from each quadrant. If the there are fewer than three noisy pixels in the level2.evt file, extra rows are filled as -1
| Pixel properties | Quadrant properties | ||||||
|---|---|---|---|---|---|---|---|
| Quadrant | DetID | PixID | Counts | Sigma | Mean | Median | Sigma |
| A | 10 | 83 | 521224 | 4367.63 | 574 | 562 | 119.2 |
| A | 15 | 223 | 209882 | 1755.9 | 574 | 562 | 119.2 |
| A | 15 | 237 | 201541 | 1685.93 | 574 | 562 | 119.2 |
| B | 5 | 255 | 99518 | 886.3 | 569 | 553 | 111.7 |
| B | 0 | 229 | 67467 | 599.26 | 569 | 553 | 111.7 |
| B | 0 | 156 | 48451 | 428.96 | 569 | 553 | 111.7 |
| C | 0 | 239 | 3243004 | 25873.52 | 532 | 536 | 125.3 |
| C | 15 | 214 | 205684 | 1636.99 | 532 | 536 | 125.3 |
| C | 14 | 254 | 152630 | 1213.65 | 532 | 536 | 125.3 |
| D | 5 | 171 | 109601 | 794.88 | 560 | 544 | 137.2 |
| D | 9 | 19 | 92870 | 672.93 | 560 | 544 | 137.2 |
| D | 12 | 6 | 77736 | 562.63 | 560 | 544 | 137.2 |
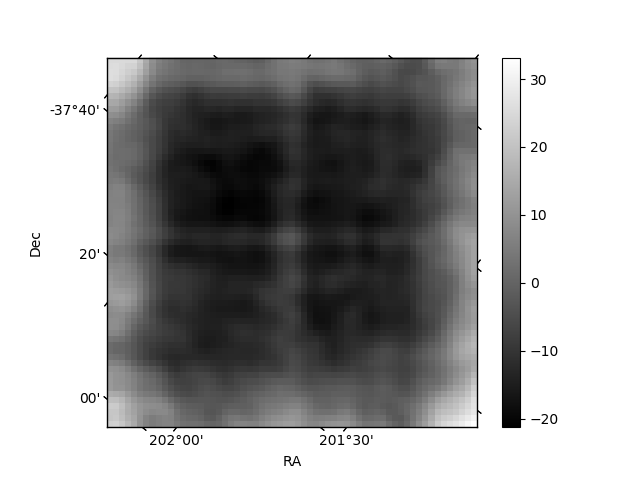
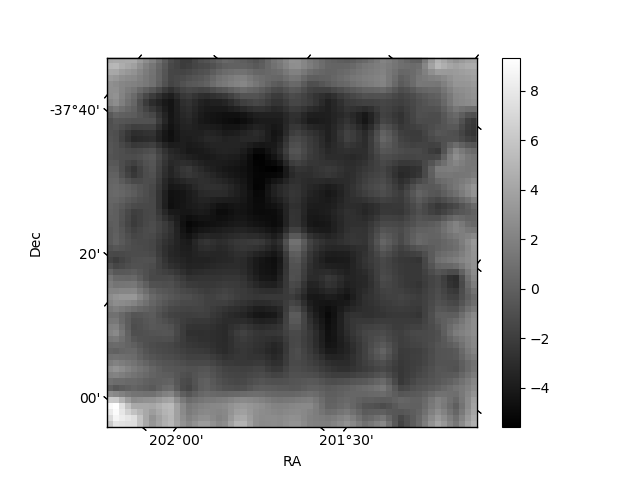
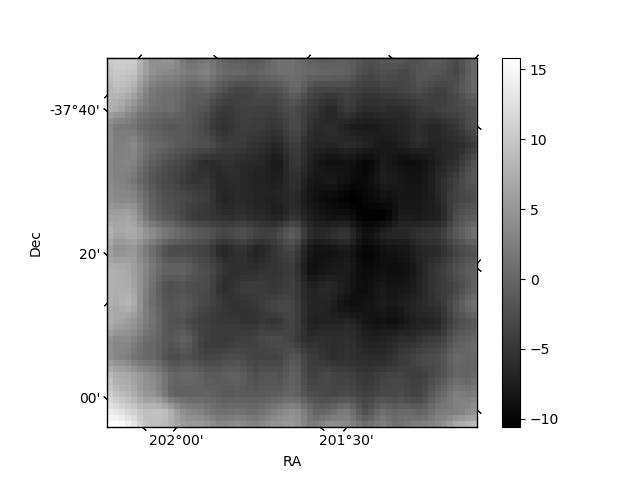
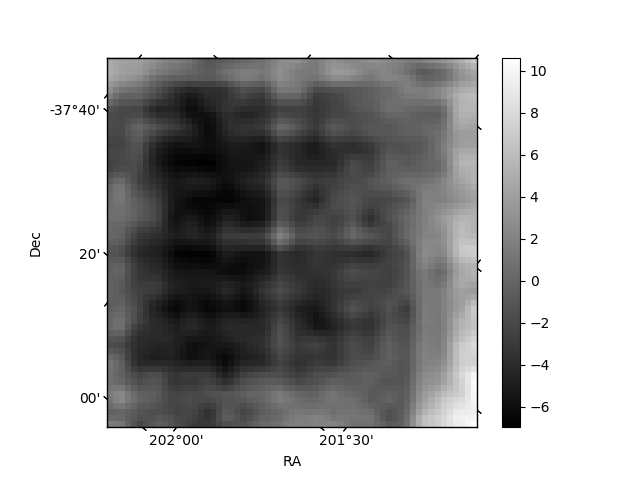
Histogram calculated using DETX and DETY for each event in the final _common_clean file
| Quadrant A | 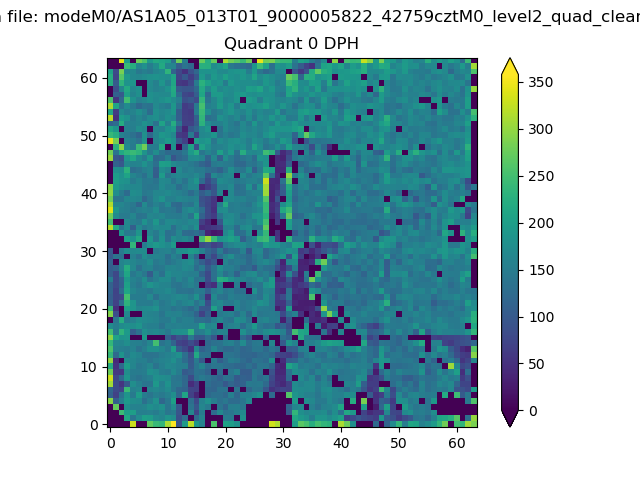 |
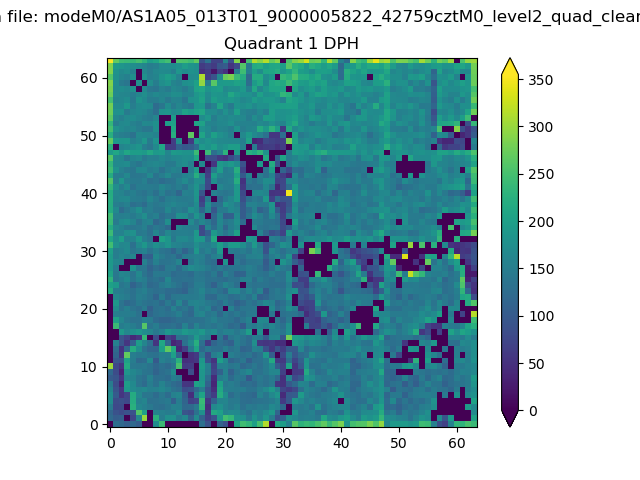 |
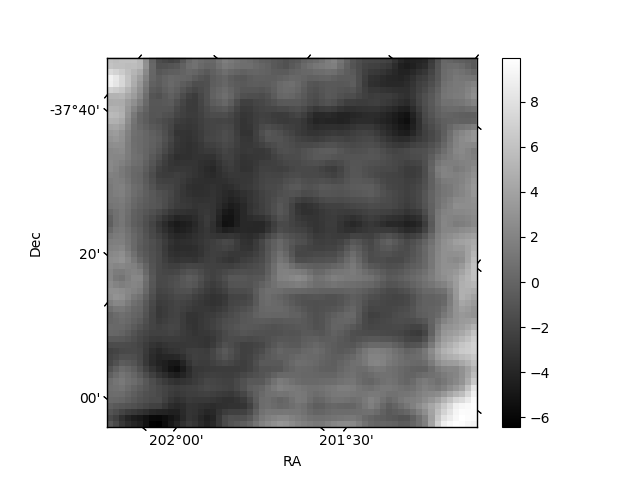
Quadrant B |
|---|---|---|---|
| Quadrant D | 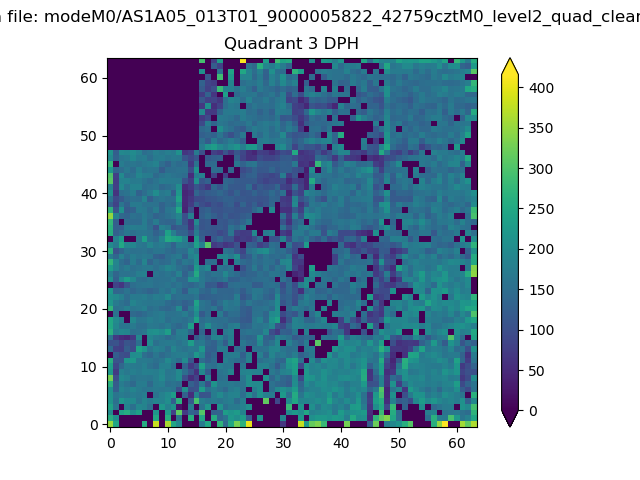 |
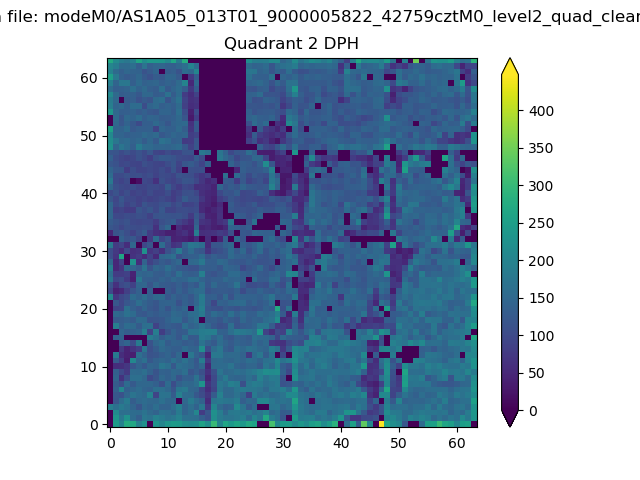 |
Quadrant C |
| Plot type | Count rate plots | Images |
|---|---|---|
| Comparison with Poisson distribution Blue bars denote a histogram of data divided into 1 sec bins. Red curve is a Poisson curve with rate = median count rate of data. |
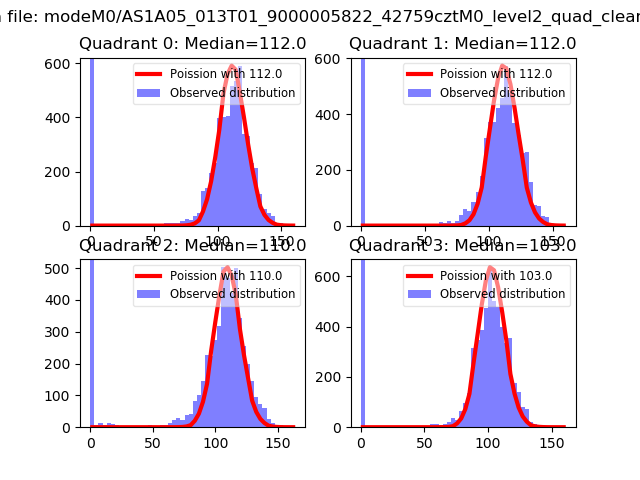 |
 |
| Quadrant-wise count rates Data is divided into 100 sec bins |
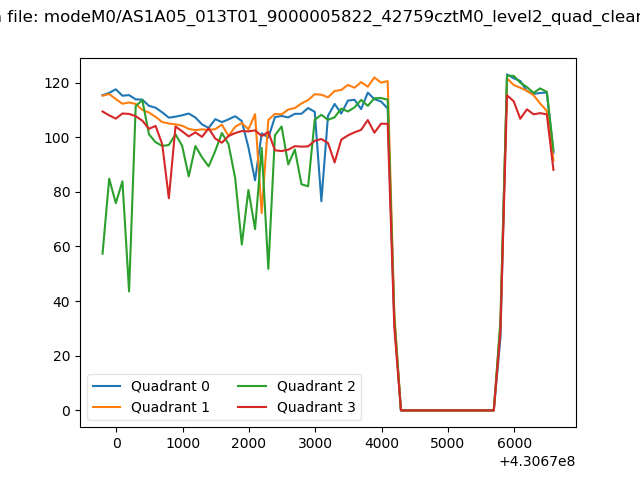 |
|
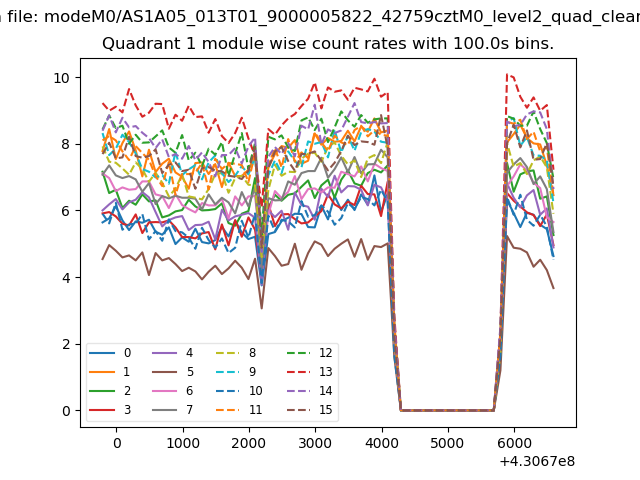
| Module-wise count rates for Quadrant A Data is divided into 100 sec bins |
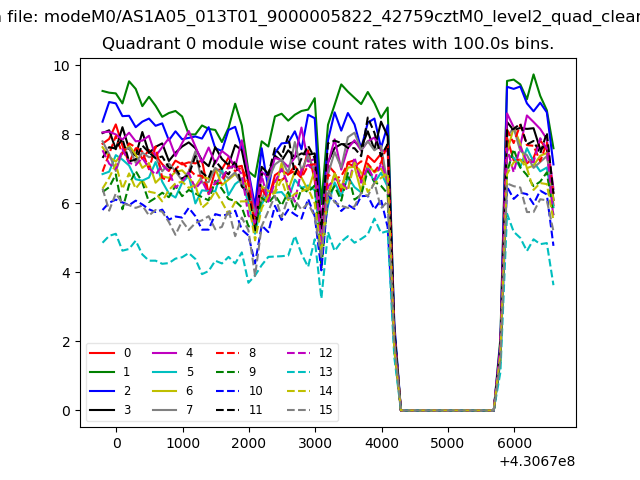 |
 |
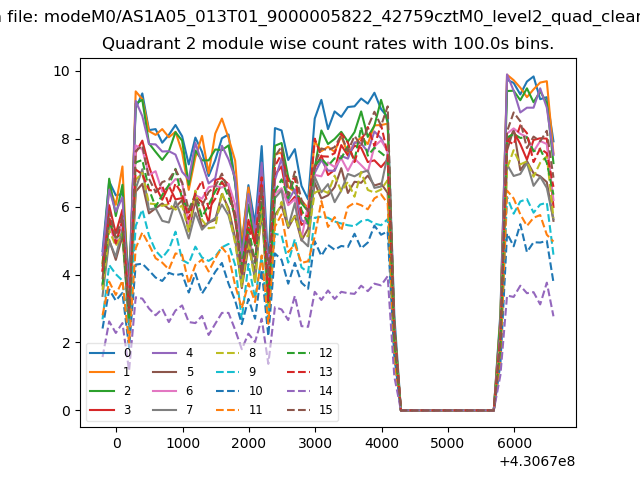
| Module-wise count rates for Quadrant B Data is divided into 100 sec bins |
 |
 |
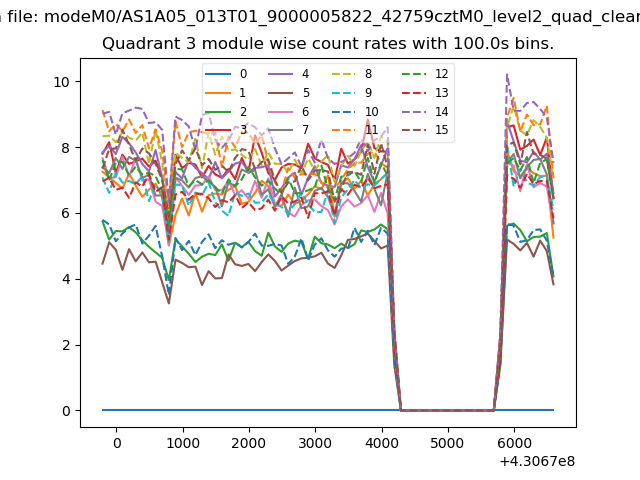
| Module-wise count rates for Quadrant C Data is divided into 100 sec bins |
 |
 |
| Module-wise count rates for Quadrant D Data is divided into 100 sec bins |
 |
 |
| Parameter | Plot |
|---|---|
| CZT HV Monitor | 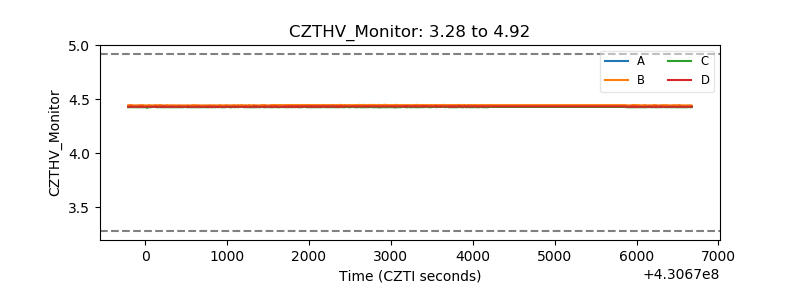 |
| D_VDD | 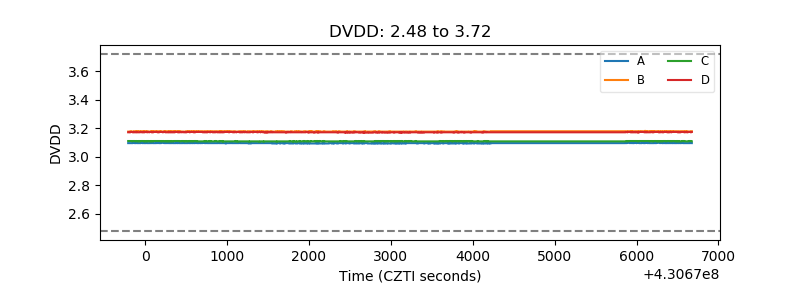 |
| Temperature 1 |  |
| Veto HV Monitor | 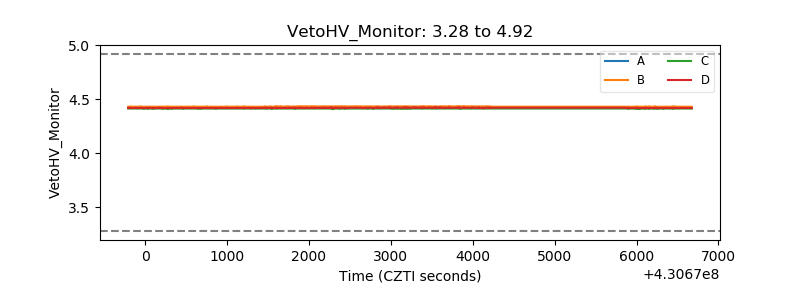 |
| Veto LLD | 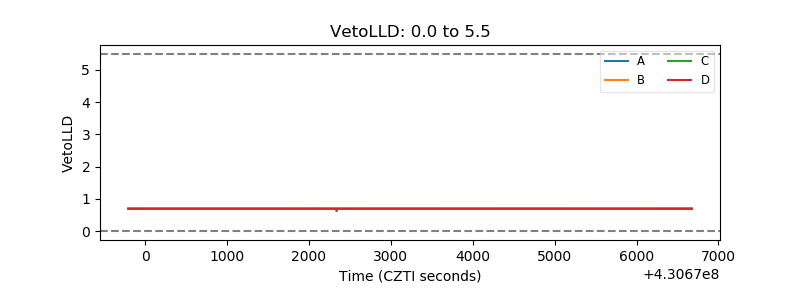 |
| Alpha Counter | 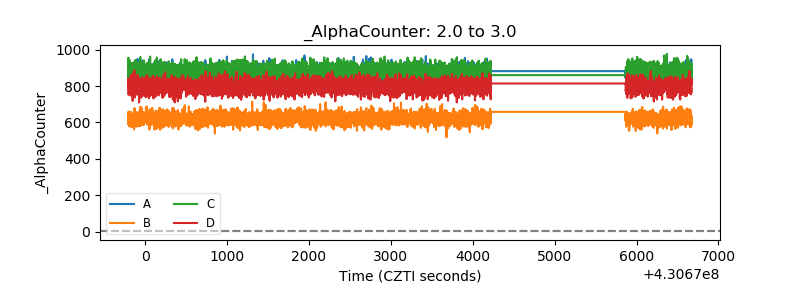 |
| _CPM_Rate | 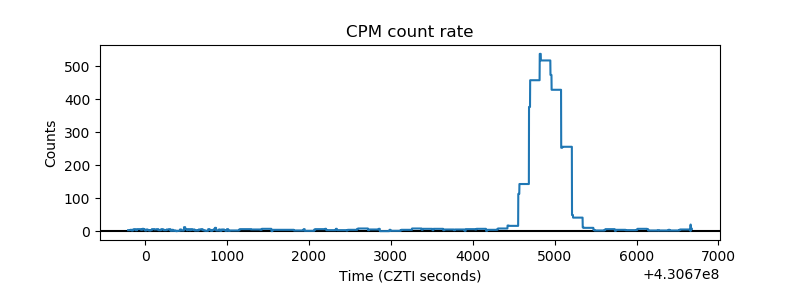 |
| CZT Counter | 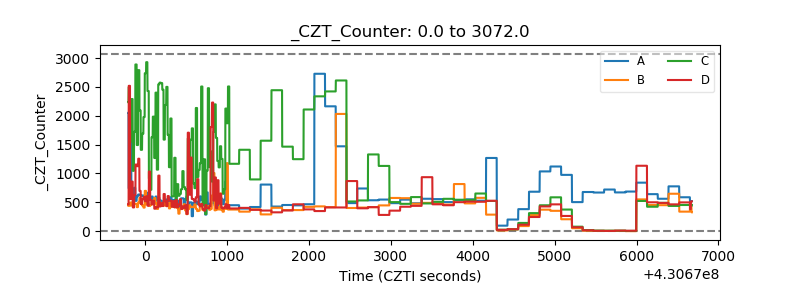 |
| +2.5 Volts monitor | 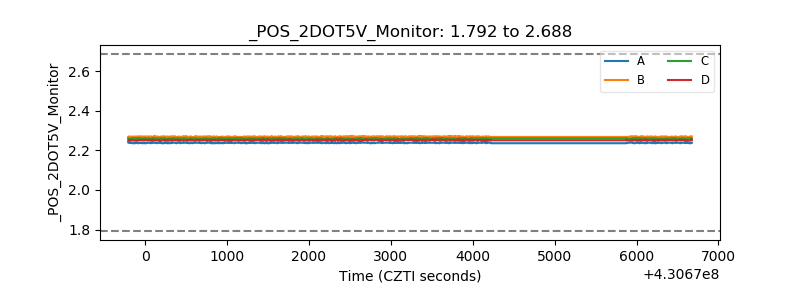 |
| +5 Volts monitor | 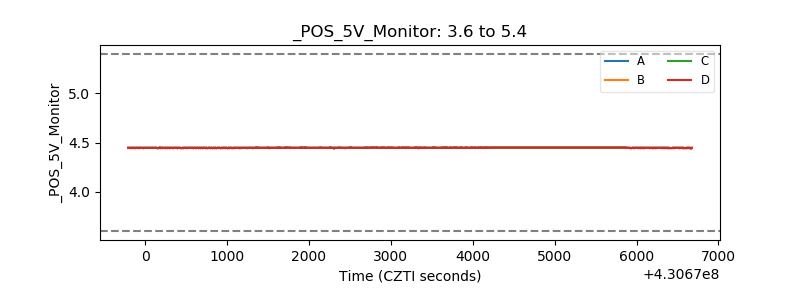 |
| _ROLL_ROT | 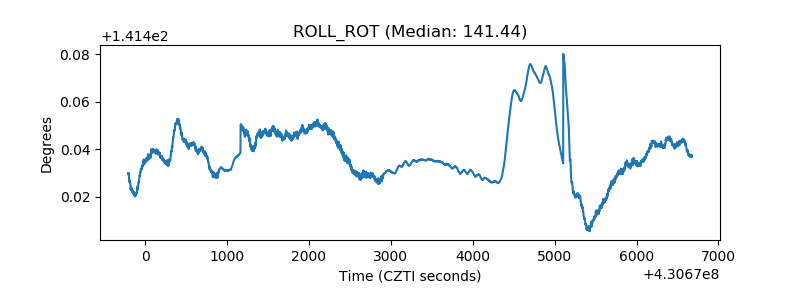 |
| _Roll_DEC | 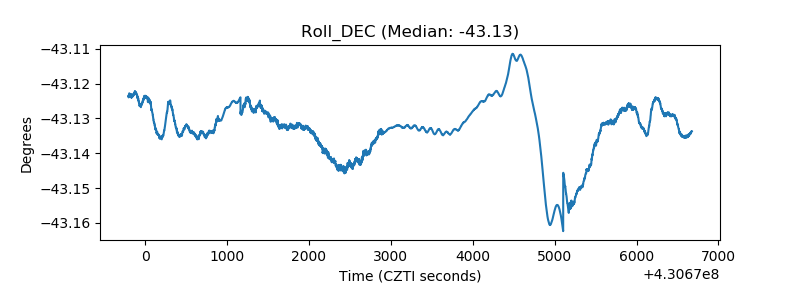 |
| _Roll_RA | 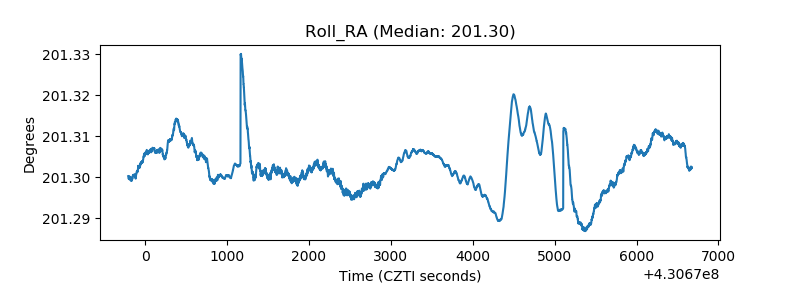 |
| Veto Counter | 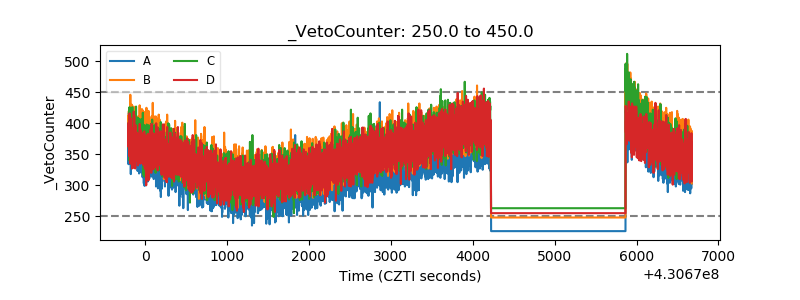 |