| Param | Original file | Final file |
|---|---|---|
| Filename | modeM0/AS1A05_013T01_9000005822_42761cztM0_level2.fits | modeM0/AS1A05_013T01_9000005822_42761cztM0_level2_quad_clean.evt |
| Size (bytes) | 304,395,840 | 88,957,440 |
| Size | 290.3 MB | 84.8 MB |
| Events in quadrant A | 3,136,093 | 593,105 |
| Events in quadrant B | 2,526,371 | 597,290 |
| Events in quadrant C | 2,593,060 | 588,876 |
| Events in quadrant D | 2,602,853 | 546,323 |
| Mode M0 | |||
|---|---|---|---|
| Quadrant | BADHDUFLAG | Total packets | Discarded packets |
| A | 0 | 12456 | 2 |
| B | 0 | 11037 | 2 |
| C | 0 | 11030 | 2 |
| D | 0 | 11503 | 2 |
| Mode M9 | |||
|---|---|---|---|
| Quadrant | BADHDUFLAG | Total packets | Discarded packets |
| A | 0 | 18 | 0 |
| B | 0 | 19 | 0 |
| C | 0 | 19 | 0 |
| D | 0 | 19 | 0 |
| Mode SS | |||
|---|---|---|---|
| Quadrant | BADHDUFLAG | Total packets | Discarded packets |
| A | 0 | 108 | 0 |
| B | 0 | 108 | 0 |
| C | 0 | 108 | 0 |
| D | 0 | 108 | 0 |
| Quadrant | Total seconds | Saturated seconds | Saturation percentage |
|---|---|---|---|
| A | 5251 | 88 | 1.675871% |
| B | 5251 | 38 | 0.723672% |
| C | 5251 | 24 | 0.457056% |
| D | 5251 | 34 | 0.647496% |
Noise dominated data is calculated using 1-second bins in cleaned event files. If a bin has >2000 counts, and if more than 50% of those come from <1% of pixels, then it is considered to be noise-dominated and hence unusable.
| Quadrant | # 1 sec bins | Bins with >0 counts | Bins with >2000 counts | High rate bins dominated by noise | Noise dominated (total time) | Noise dominated (detector-on time) | Marked lightcurve |
|---|---|---|---|---|---|---|---|
| A | 7014 | 5252 | 62 | 62 | 0.88% | 1.18% | 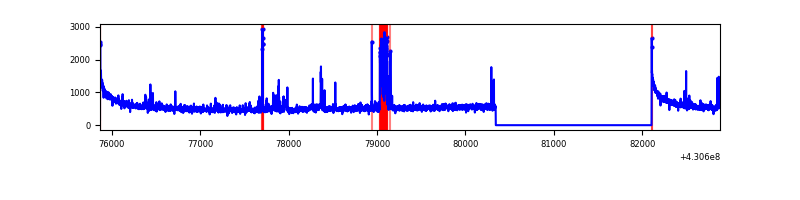 |
| B | 7014 | 5252 | 25 | 25 | 0.36% | 0.48% | 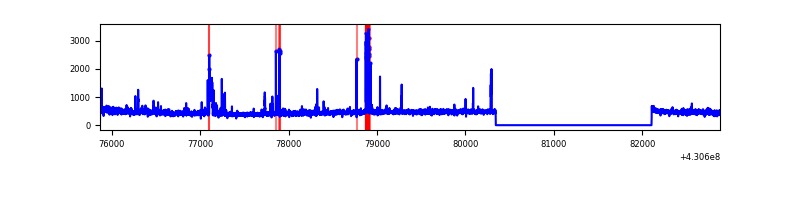 |
| C | 7014 | 5252 | 21 | 21 | 0.30% | 0.40% | 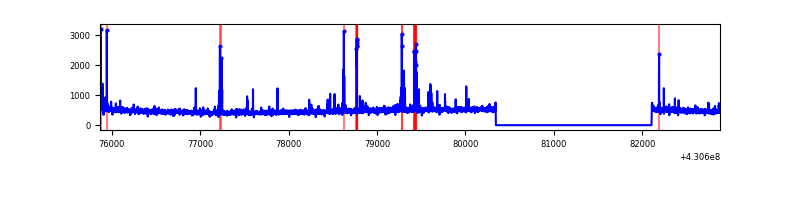 |
| D | 7014 | 5251 | 32 | 32 | 0.46% | 0.61% | 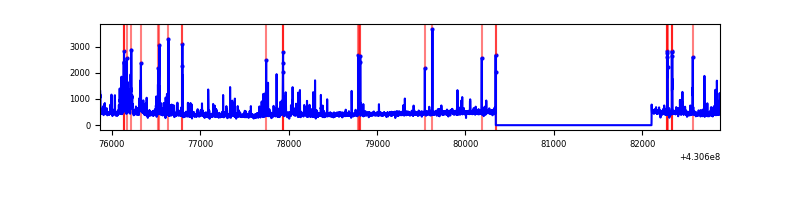 |
Top three noisy pixels from each quadrant. If the there are fewer than three noisy pixels in the level2.evt file, extra rows are filled as -1
| Pixel properties | Quadrant properties | ||||||
|---|---|---|---|---|---|---|---|
| Quadrant | DetID | PixID | Counts | Sigma | Mean | Median | Sigma |
| A | 10 | 83 | 586588 | 4902.93 | 580 | 570 | 119.5 |
| A | 13 | 248 | 169495 | 1413.31 | 580 | 570 | 119.5 |
| A | 15 | 237 | 55620 | 460.58 | 580 | 570 | 119.5 |
| B | 4 | 141 | 80475 | 707.44 | 577 | 562 | 113.0 |
| B | 0 | 229 | 76009 | 667.9 | 577 | 562 | 113.0 |
| B | 0 | 245 | 33739 | 293.7 | 577 | 562 | 113.0 |
| C | 15 | 214 | 218267 | 1630.55 | 566 | 570 | 133.5 |
| C | 14 | 254 | 142421 | 1062.46 | 566 | 570 | 133.5 |
| C | 3 | 233 | 11290 | 80.29 | 566 | 570 | 133.5 |
| D | 10 | 118 | 69850 | 498.46 | 566 | 550 | 139.0 |
| D | 9 | 19 | 54471 | 387.84 | 566 | 550 | 139.0 |
| D | 5 | 171 | 49932 | 355.19 | 566 | 550 | 139.0 |
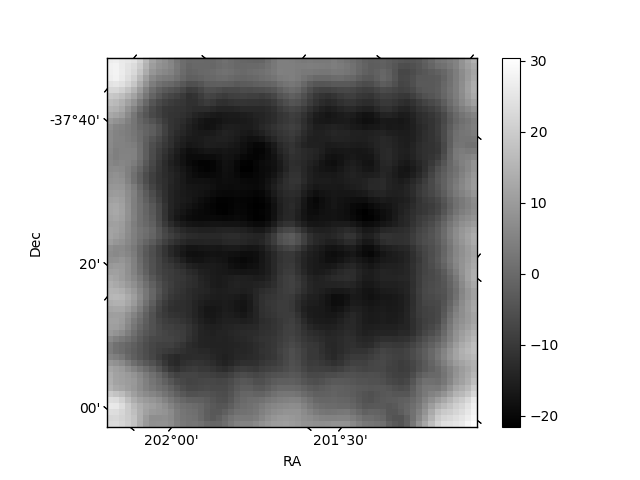
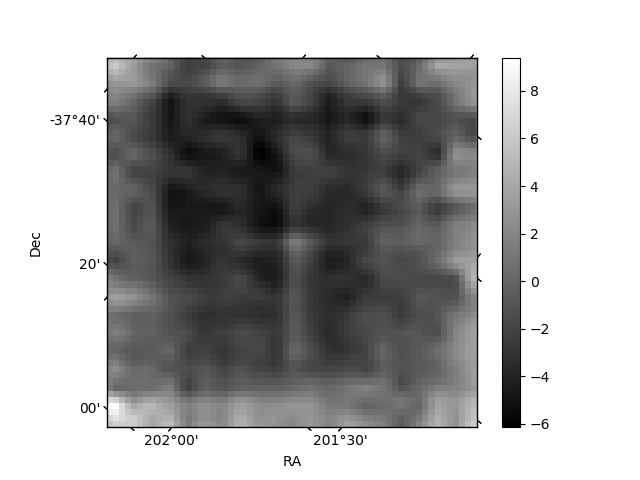
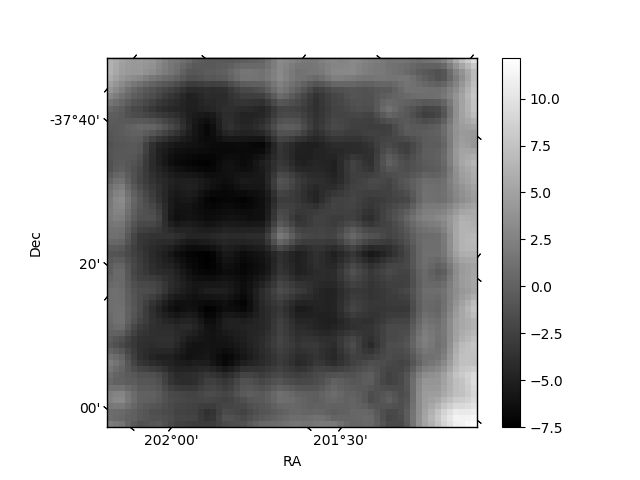
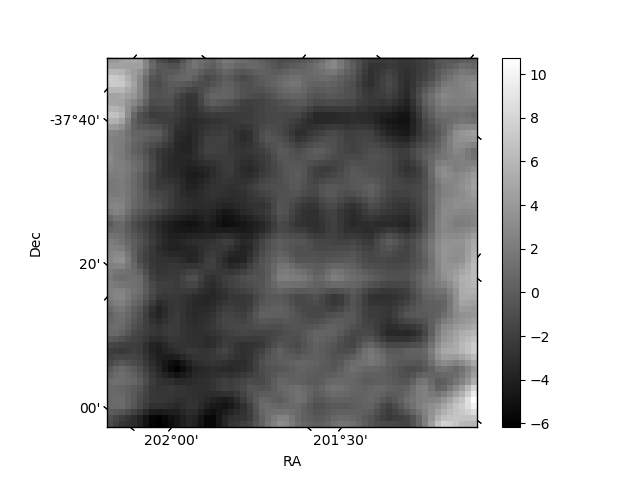
Histogram calculated using DETX and DETY for each event in the final _common_clean file
| Quadrant A | 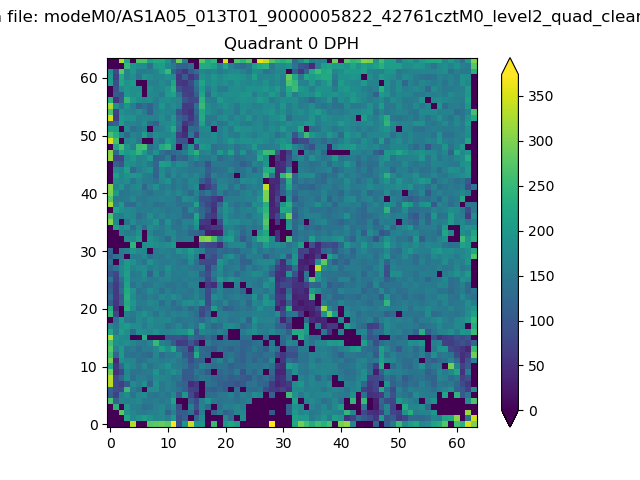 |
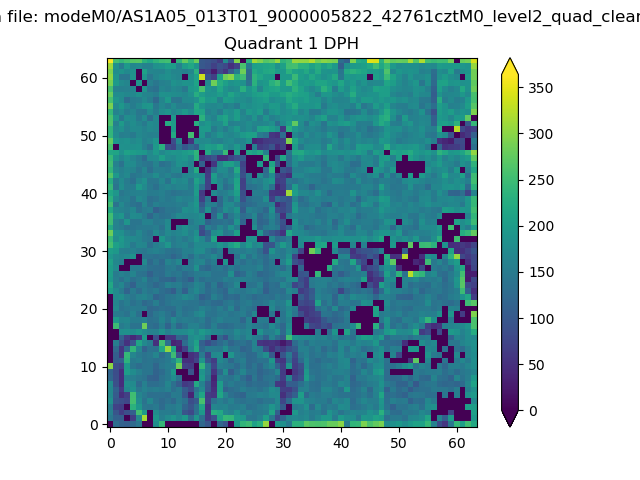 |
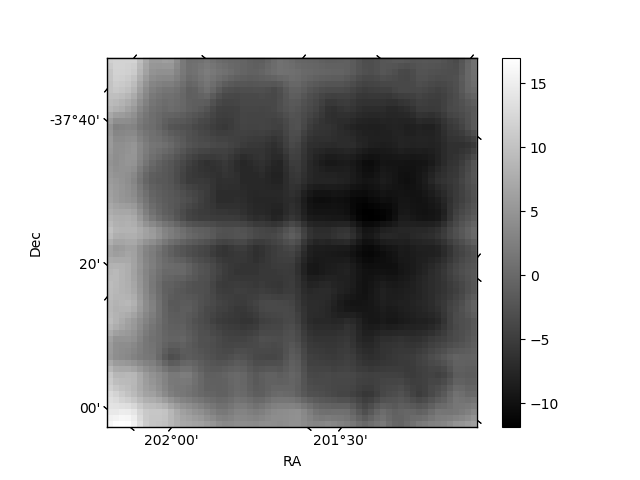
Quadrant B |
|---|---|---|---|
| Quadrant D | 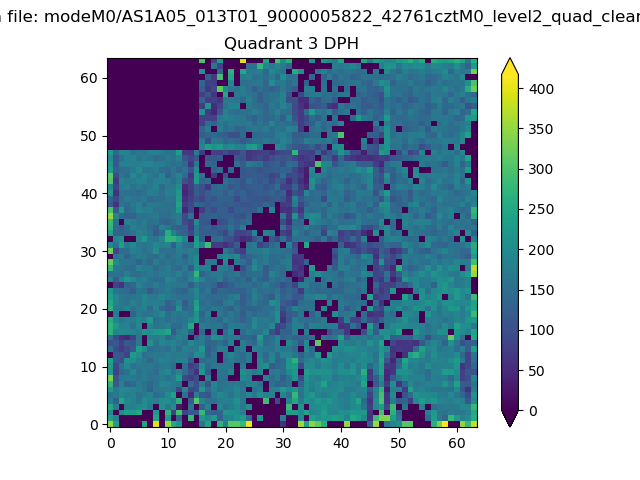 |
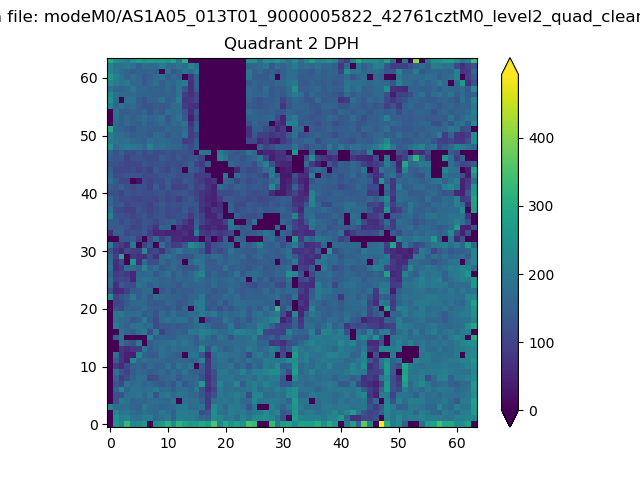 |
Quadrant C |
| Plot type | Count rate plots | Images |
|---|---|---|
| Comparison with Poisson distribution Blue bars denote a histogram of data divided into 1 sec bins. Red curve is a Poisson curve with rate = median count rate of data. |
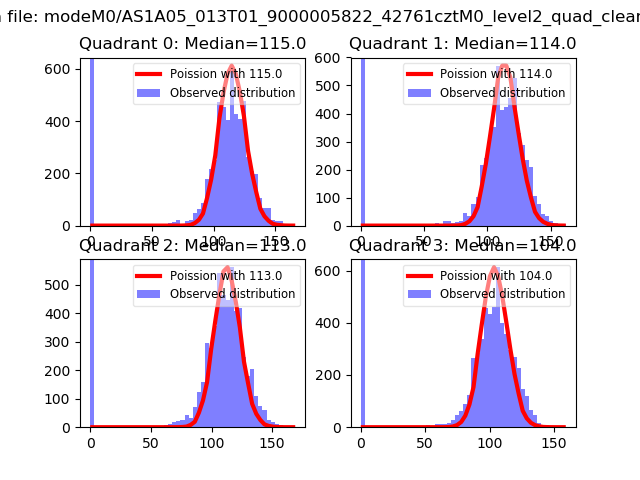 |
 |
| Quadrant-wise count rates Data is divided into 100 sec bins |
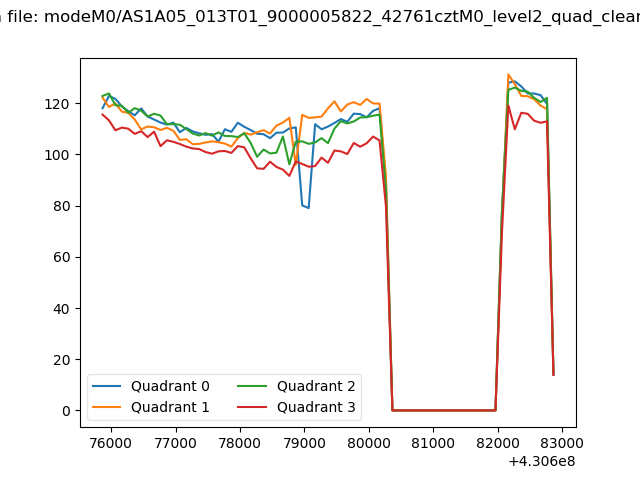 |
|
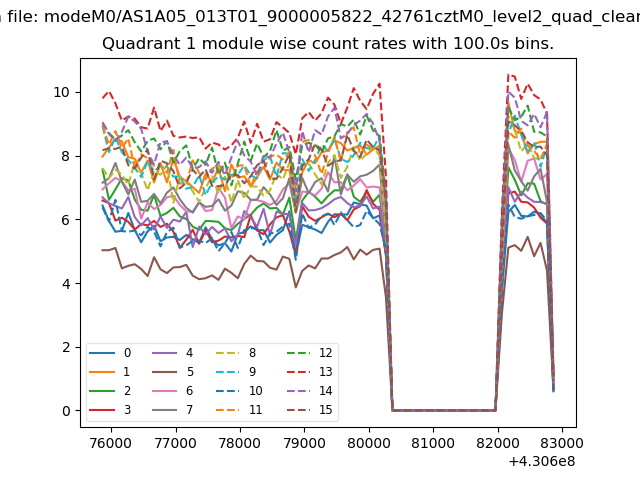
| Module-wise count rates for Quadrant A Data is divided into 100 sec bins |
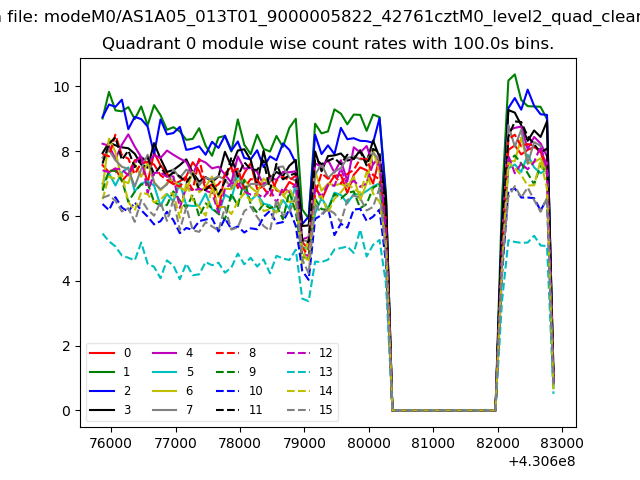 |
 |
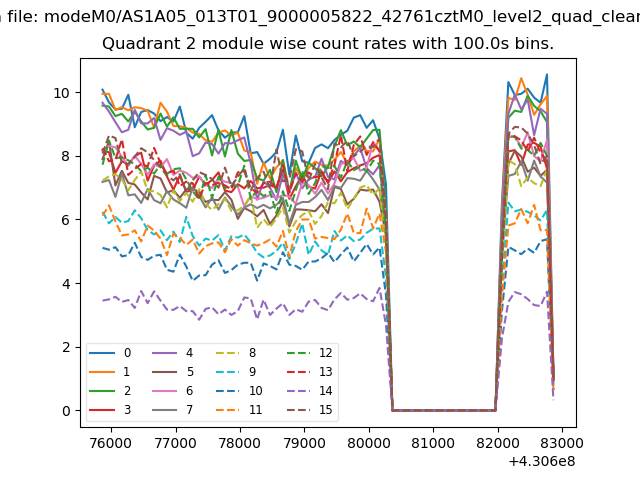
| Module-wise count rates for Quadrant B Data is divided into 100 sec bins |
 |
 |
| Module-wise count rates for Quadrant C Data is divided into 100 sec bins |
 |
 |
| Module-wise count rates for Quadrant D Data is divided into 100 sec bins |
 |
 |
| Parameter | Plot |
|---|---|
| CZT HV Monitor | 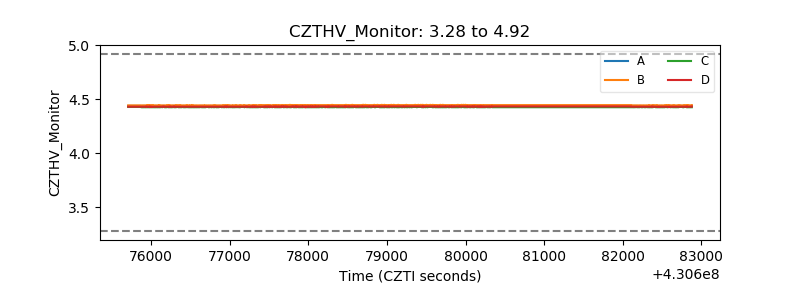 |
| D_VDD | 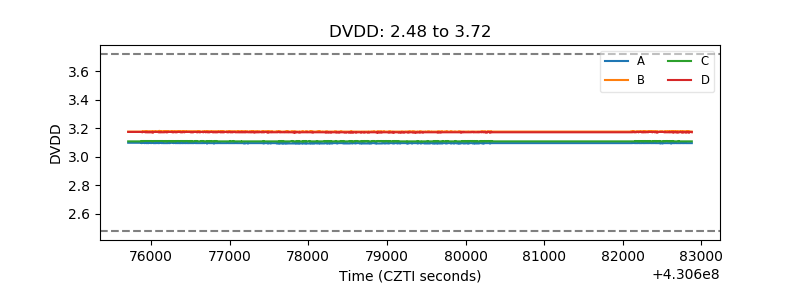 |
| Temperature 1 | 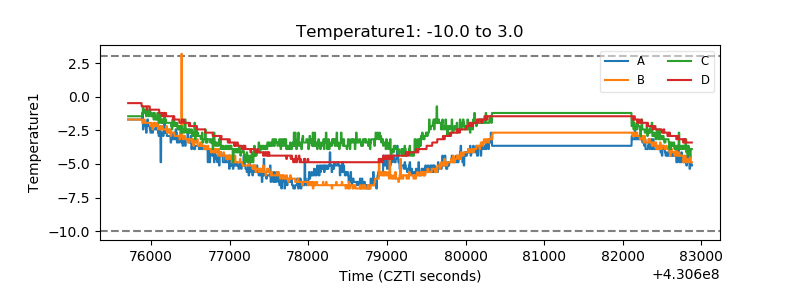 |
| Veto HV Monitor |  |
| Veto LLD | 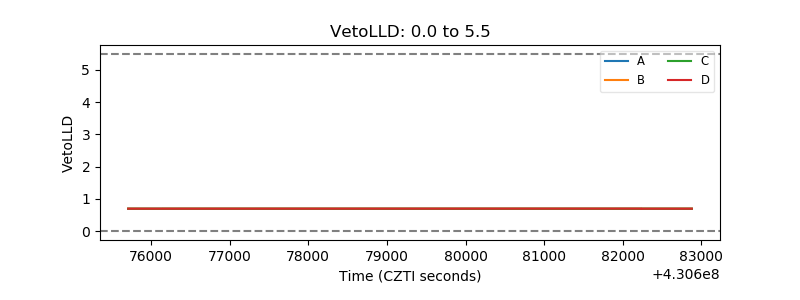 |
| Alpha Counter | 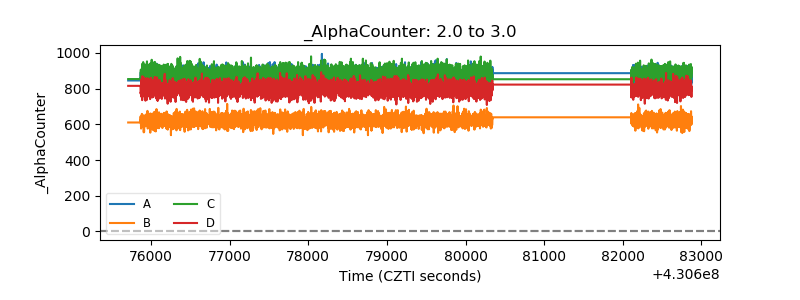 |
| _CPM_Rate | 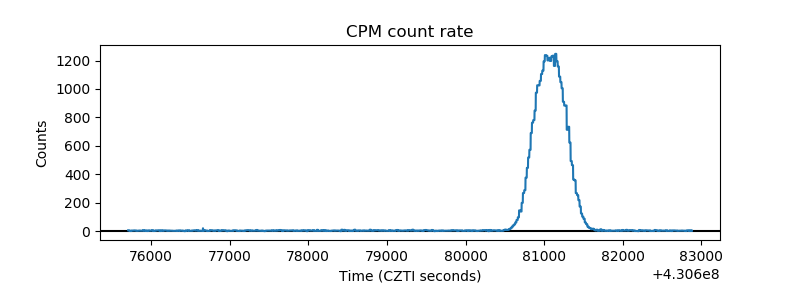 |
| CZT Counter | 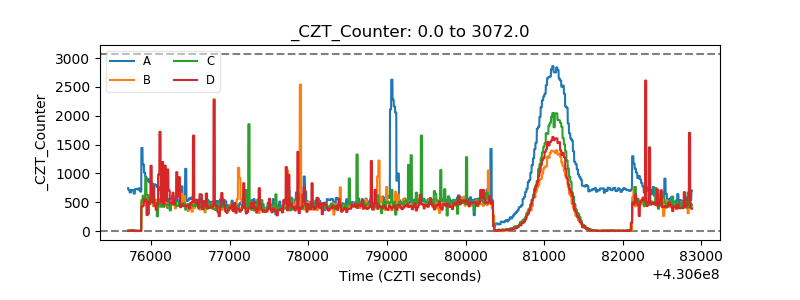 |
| +2.5 Volts monitor | 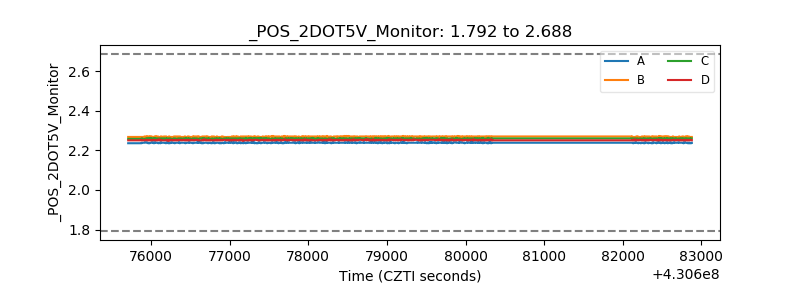 |
| +5 Volts monitor | 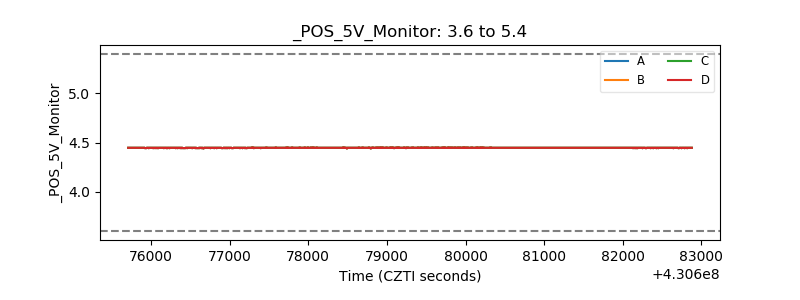 |
| _ROLL_ROT | 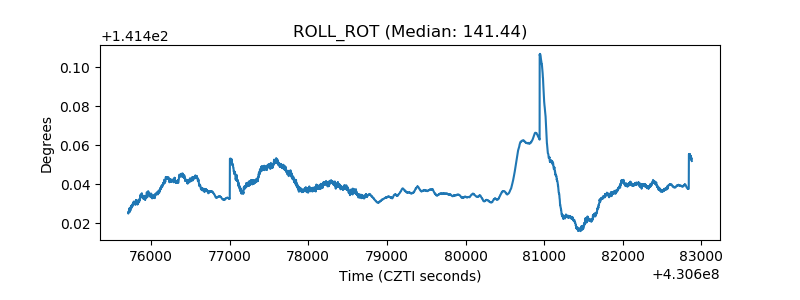 |
| _Roll_DEC | 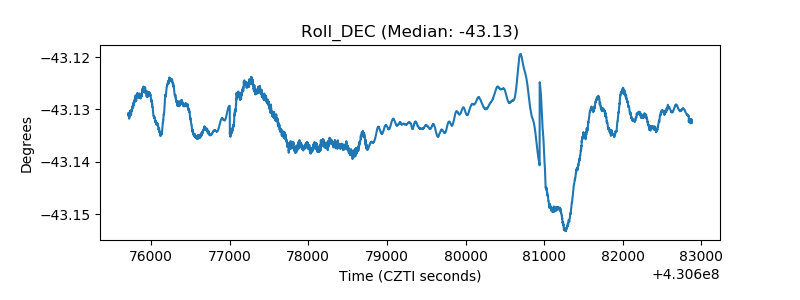 |
| _Roll_RA | 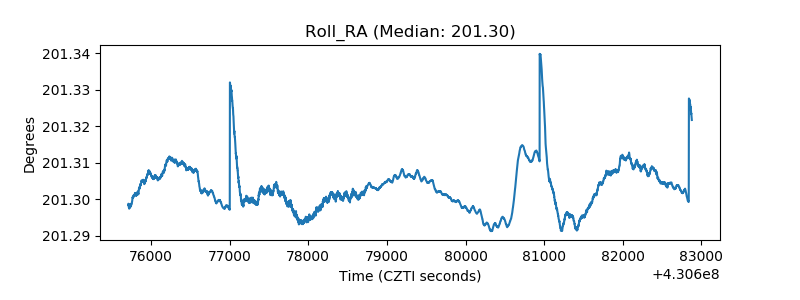 |
| Veto Counter | 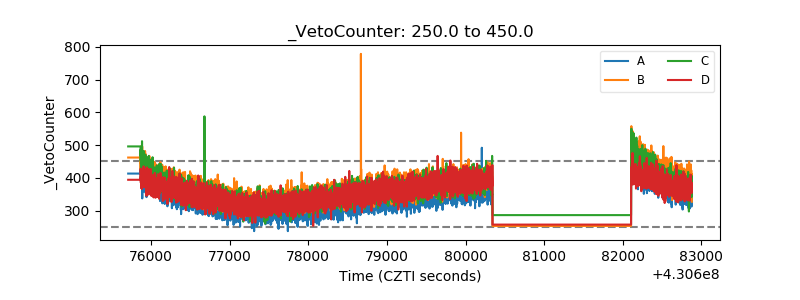 |