| Param | Original file | Final file |
|---|---|---|
| Filename | modeM0/AS1A05_013T01_9000005822_42762cztM0_level2.fits | modeM0/AS1A05_013T01_9000005822_42762cztM0_level2_quad_clean.evt |
| Size (bytes) | 339,295,680 | 90,008,640 |
| Size | 323.6 MB | 85.8 MB |
| Events in quadrant A | 3,476,040 | 600,917 |
| Events in quadrant B | 3,375,313 | 606,891 |
| Events in quadrant C | 2,620,668 | 601,060 |
| Events in quadrant D | 2,683,129 | 552,863 |
| Mode M0 | |||
|---|---|---|---|
| Quadrant | BADHDUFLAG | Total packets | Discarded packets |
| A | 0 | 13543 | 2 |
| B | 0 | 13485 | 2 |
| C | 0 | 10941 | 2 |
| D | 0 | 11595 | 2 |
| Mode M9 | |||
|---|---|---|---|
| Quadrant | BADHDUFLAG | Total packets | Discarded packets |
| A | 0 | 30 | 0 |
| B | 0 | 31 | 0 |
| C | 0 | 31 | 0 |
| D | 0 | 31 | 0 |
| Mode SS | |||
|---|---|---|---|
| Quadrant | BADHDUFLAG | Total packets | Discarded packets |
| A | 0 | 106 | 0 |
| B | 0 | 106 | 0 |
| C | 0 | 106 | 0 |
| D | 0 | 106 | 0 |
| Quadrant | Total seconds | Saturated seconds | Saturation percentage |
|---|---|---|---|
| A | 5193 | 164 | 3.158097% |
| B | 5193 | 171 | 3.292894% |
| C | 5193 | 18 | 0.346620% |
| D | 5193 | 63 | 1.213172% |
Noise dominated data is calculated using 1-second bins in cleaned event files. If a bin has >2000 counts, and if more than 50% of those come from <1% of pixels, then it is considered to be noise-dominated and hence unusable.
| Quadrant | # 1 sec bins | Bins with >0 counts | Bins with >2000 counts | High rate bins dominated by noise | Noise dominated (total time) | Noise dominated (detector-on time) | Marked lightcurve |
|---|---|---|---|---|---|---|---|
| A | 7076 | 5193 | 121 | 121 | 1.71% | 2.33% | 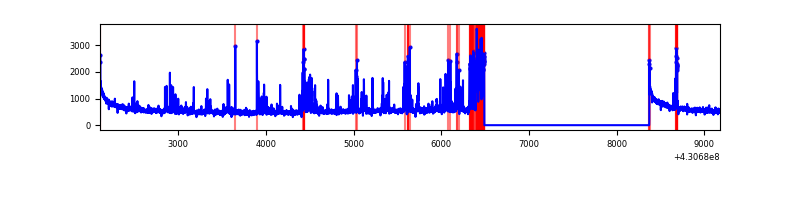 |
| B | 7076 | 5194 | 71 | 71 | 1.00% | 1.37% | 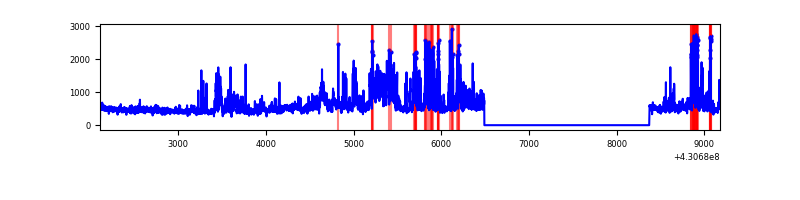 |
| C | 7076 | 5194 | 16 | 16 | 0.23% | 0.31% | 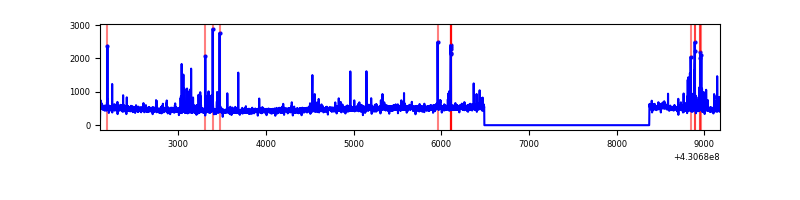 |
| D | 7076 | 5194 | 68 | 68 | 0.96% | 1.31% | 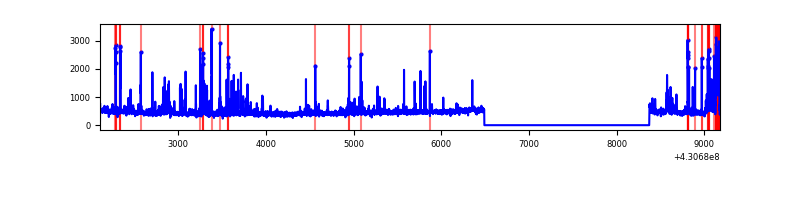 |
Top three noisy pixels from each quadrant. If the there are fewer than three noisy pixels in the level2.evt file, extra rows are filled as -1
| Pixel properties | Quadrant properties | ||||||
|---|---|---|---|---|---|---|---|
| Quadrant | DetID | PixID | Counts | Sigma | Mean | Median | Sigma |
| A | 13 | 248 | 608767 | 5099.49 | 582 | 572 | 119.3 |
| A | 10 | 83 | 560167 | 4692.0 | 582 | 572 | 119.3 |
| A | 12 | 189 | 24878 | 203.8 | 582 | 572 | 119.3 |
| B | 0 | 229 | 971122 | 8640.19 | 580 | 566 | 112.3 |
| B | 5 | 255 | 45574 | 400.68 | 580 | 566 | 112.3 |
| B | 0 | 245 | 33823 | 296.06 | 580 | 566 | 112.3 |
| C | 15 | 214 | 215209 | 1602.02 | 571 | 576 | 134.0 |
| C | 14 | 254 | 148963 | 1107.56 | 571 | 576 | 134.0 |
| C | 3 | 233 | 14147 | 101.29 | 571 | 576 | 134.0 |
| D | 12 | 233 | 145768 | 1049.0 | 568 | 553 | 138.4 |
| D | 5 | 70 | 74172 | 531.81 | 568 | 553 | 138.4 |
| D | 7 | 96 | 45546 | 325.02 | 568 | 553 | 138.4 |
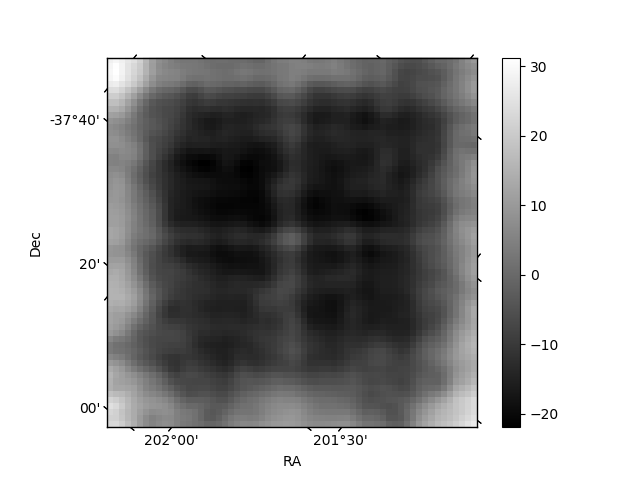
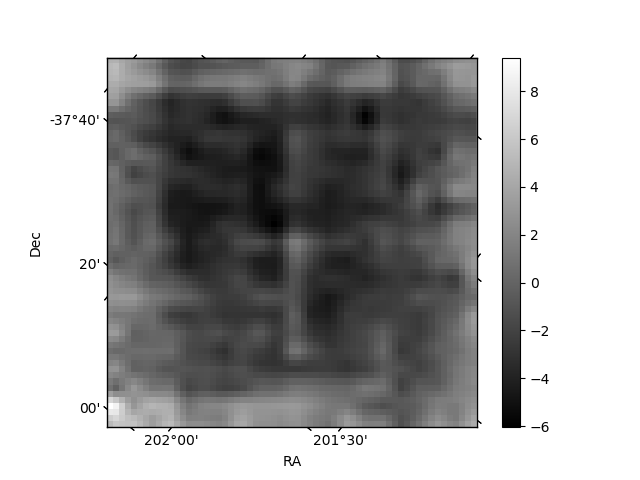
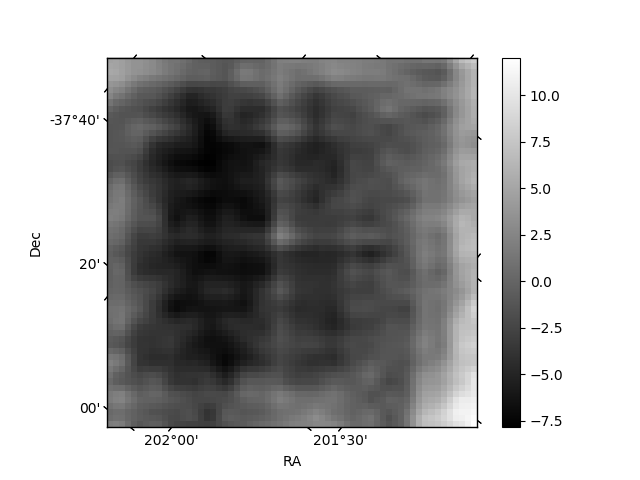
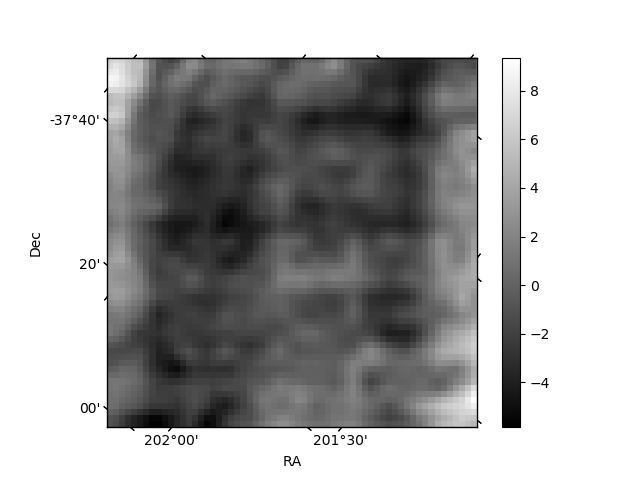
Histogram calculated using DETX and DETY for each event in the final _common_clean file
| Quadrant A | 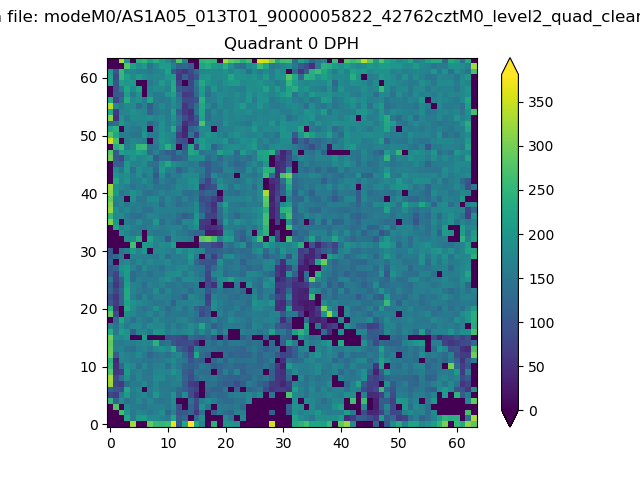 |
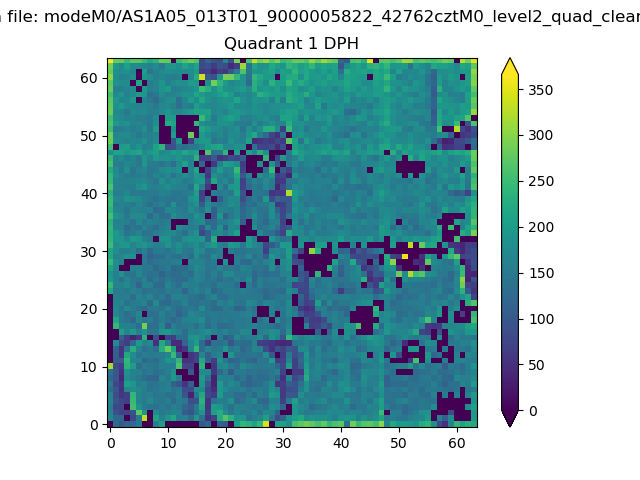 |
Quadrant B |
|---|---|---|---|
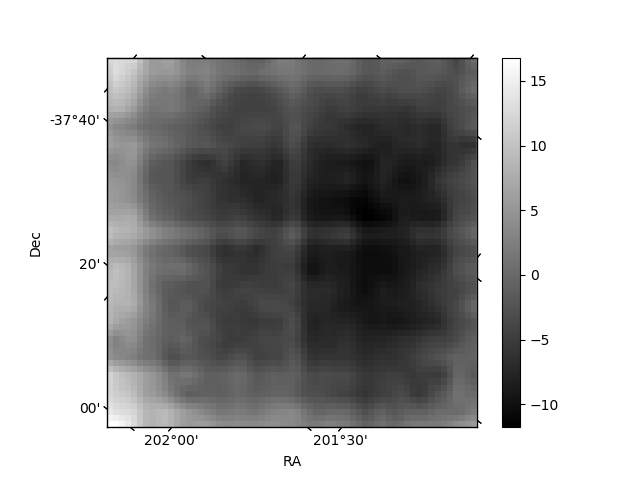
| Quadrant D | 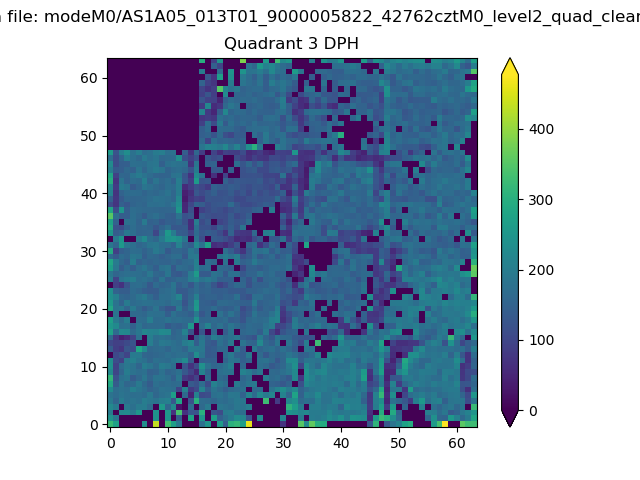 |
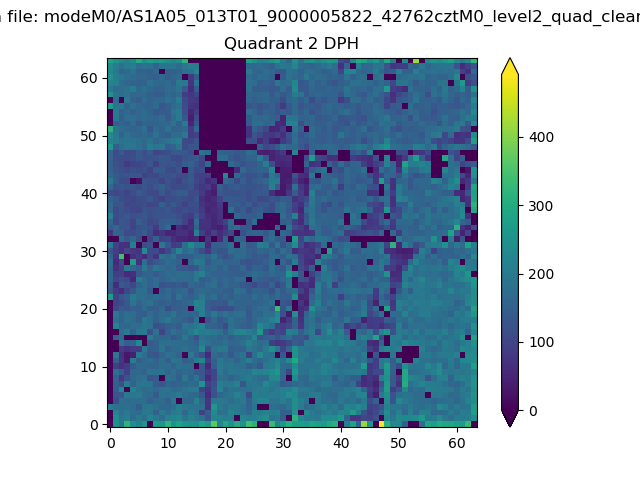 |
Quadrant C |
| Plot type | Count rate plots | Images |
|---|---|---|
| Comparison with Poisson distribution Blue bars denote a histogram of data divided into 1 sec bins. Red curve is a Poisson curve with rate = median count rate of data. |
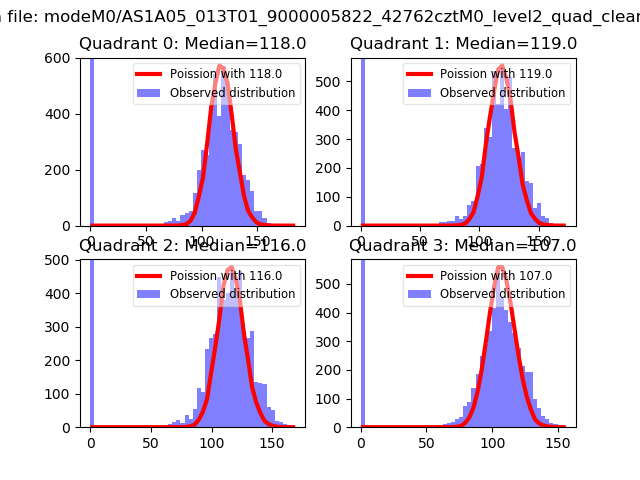 |
 |
| Quadrant-wise count rates Data is divided into 100 sec bins |
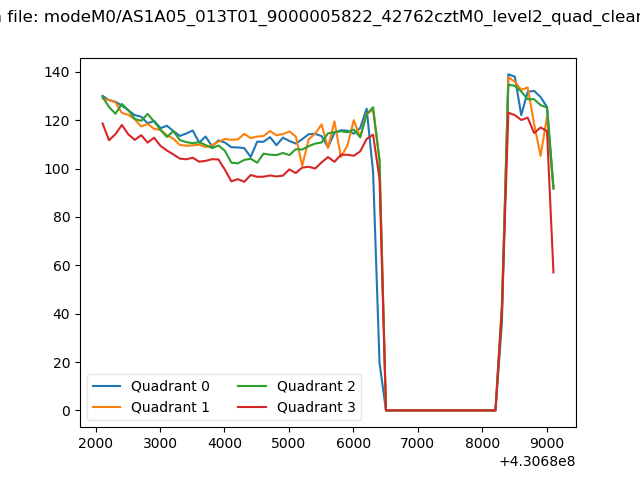 |
|
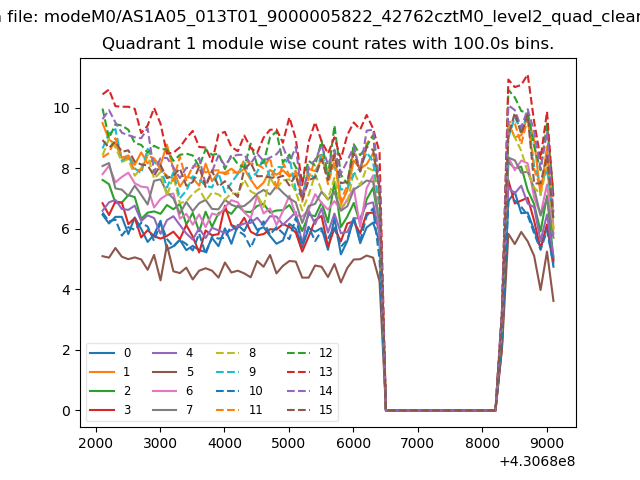
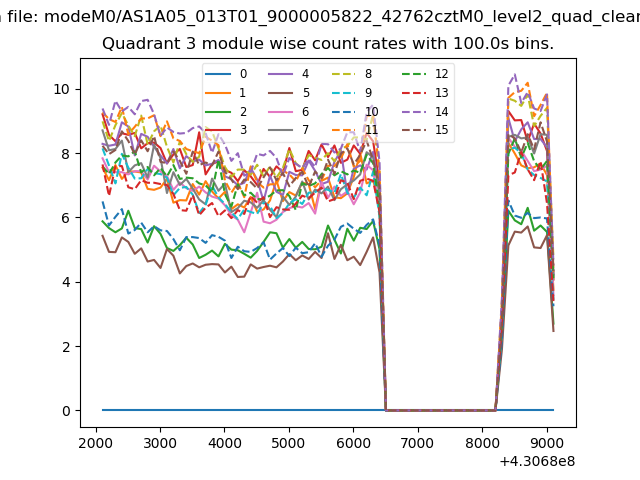
| Module-wise count rates for Quadrant A Data is divided into 100 sec bins |
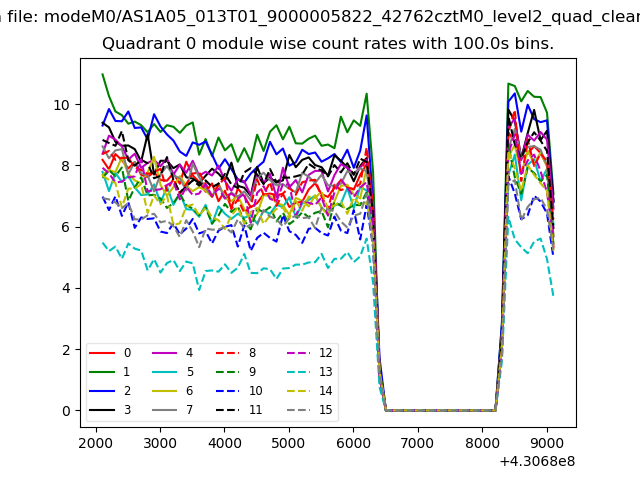 |
 |
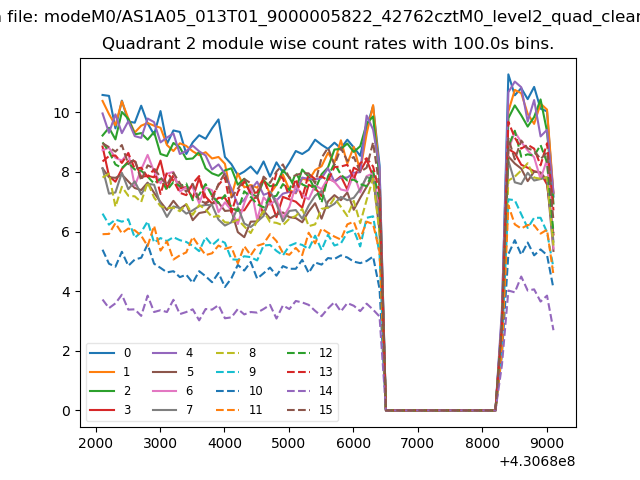
| Module-wise count rates for Quadrant B Data is divided into 100 sec bins |
 |
 |
| Module-wise count rates for Quadrant C Data is divided into 100 sec bins |
 |
 |
| Module-wise count rates for Quadrant D Data is divided into 100 sec bins |
 |
 |
| Parameter | Plot |
|---|---|
| CZT HV Monitor | 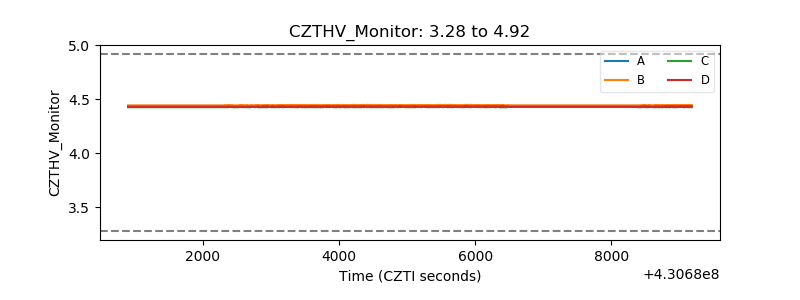 |
| D_VDD | 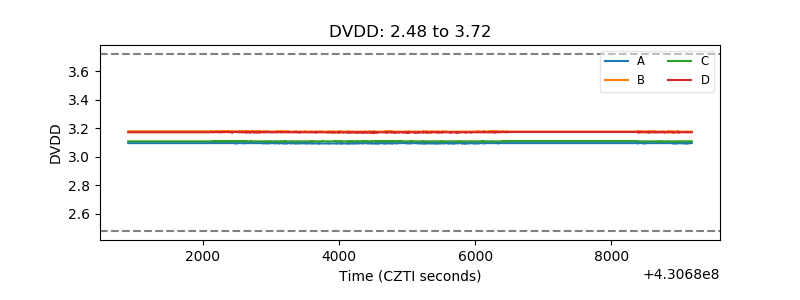 |
| Temperature 1 | 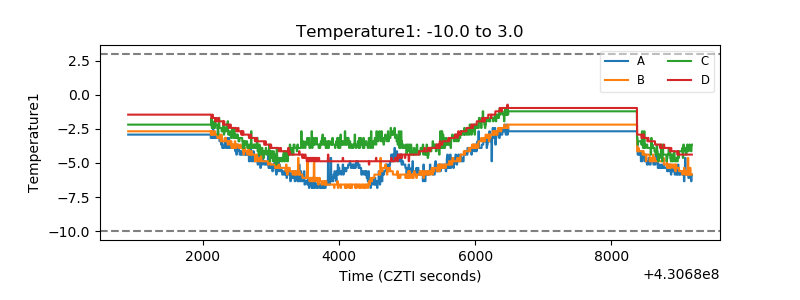 |
| Veto HV Monitor | 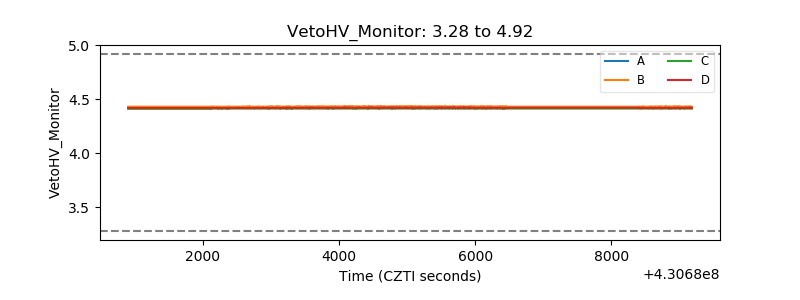 |
| Veto LLD | 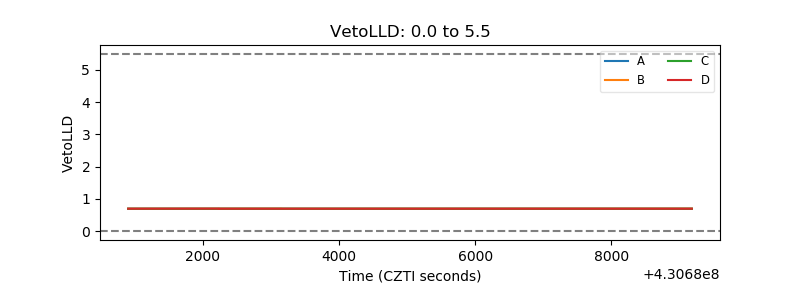 |
| Alpha Counter | 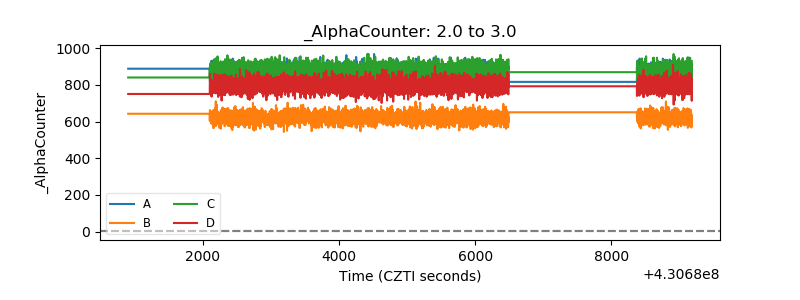 |
| _CPM_Rate | 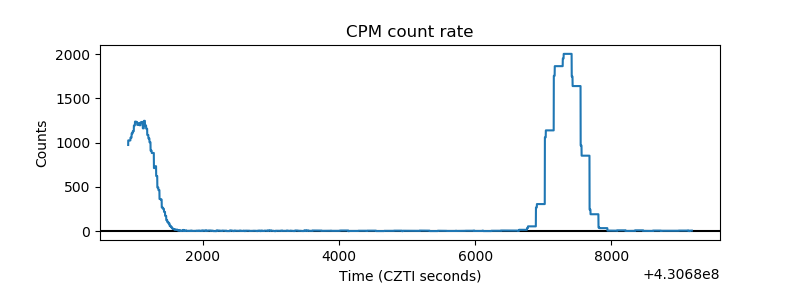 |
| CZT Counter | 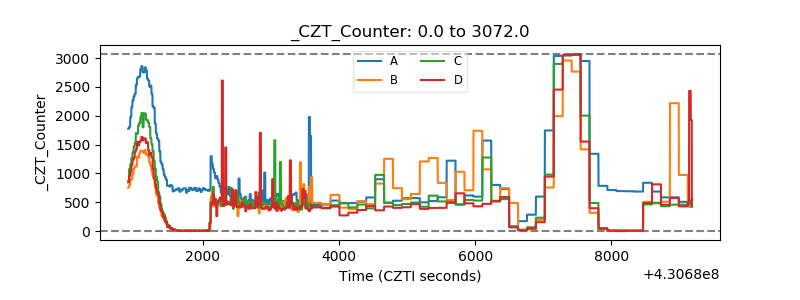 |
| +2.5 Volts monitor | 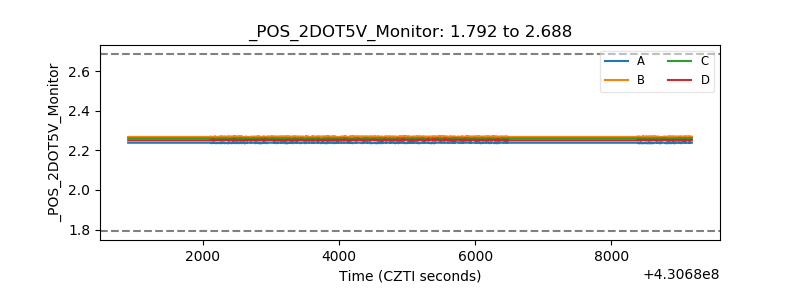 |
| +5 Volts monitor | 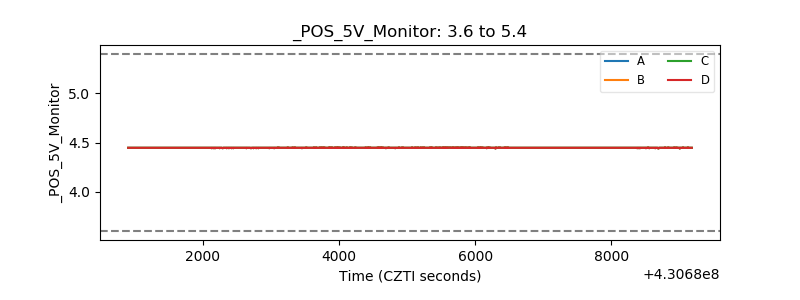 |
| _ROLL_ROT | 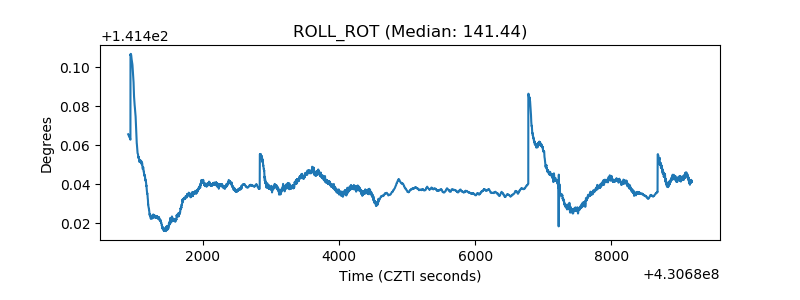 |
| _Roll_DEC |  |
| _Roll_RA | 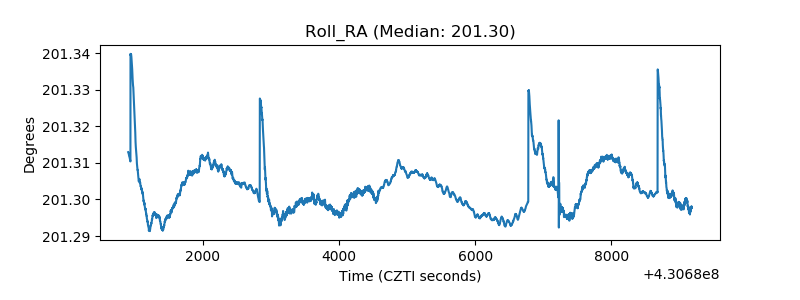 |
| Veto Counter | 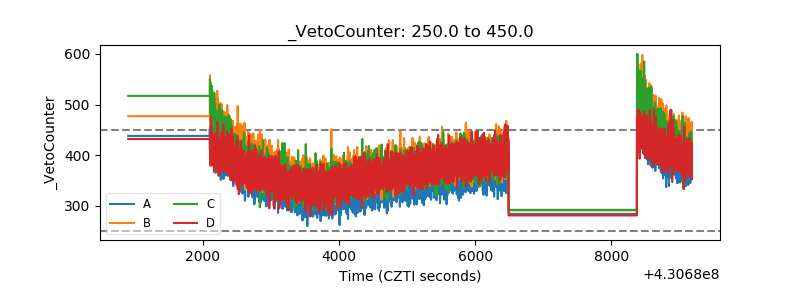 |