| Param | Original file | Final file |
|---|---|---|
| Filename | modeM0/AS1A05_013T01_9000005822_42763cztM0_level2.fits | modeM0/AS1A05_013T01_9000005822_42763cztM0_level2_quad_clean.evt |
| Size (bytes) | 348,120,000 | 86,863,680 |
| Size | 332.0 MB | 82.8 MB |
| Events in quadrant A | 3,762,036 | 567,771 |
| Events in quadrant B | 2,763,545 | 614,602 |
| Events in quadrant C | 2,616,050 | 593,767 |
| Events in quadrant D | 3,358,474 | 506,673 |
| Mode M0 | |||
|---|---|---|---|
| Quadrant | BADHDUFLAG | Total packets | Discarded packets |
| A | 0 | 14227 | 2 |
| B | 0 | 11274 | 2 |
| C | 0 | 10682 | 2 |
| D | 0 | 13401 | 2 |
| Mode M9 | |||
|---|---|---|---|
| Quadrant | BADHDUFLAG | Total packets | Discarded packets |
| A | 0 | 33 | 0 |
| B | 0 | 34 | 0 |
| C | 0 | 34 | 0 |
| D | 0 | 34 | 0 |
| Mode SS | |||
|---|---|---|---|
| Quadrant | BADHDUFLAG | Total packets | Discarded packets |
| A | 0 | 102 | 0 |
| B | 0 | 102 | 0 |
| C | 0 | 102 | 0 |
| D | 0 | 102 | 0 |
| Quadrant | Total seconds | Saturated seconds | Saturation percentage |
|---|---|---|---|
| A | 4954 | 446 | 9.002826% |
| B | 4954 | 74 | 1.493742% |
| C | 4954 | 22 | 0.444086% |
| D | 4954 | 390 | 7.872426% |
Noise dominated data is calculated using 1-second bins in cleaned event files. If a bin has >2000 counts, and if more than 50% of those come from <1% of pixels, then it is considered to be noise-dominated and hence unusable.
| Quadrant | # 1 sec bins | Bins with >0 counts | Bins with >2000 counts | High rate bins dominated by noise | Noise dominated (total time) | Noise dominated (detector-on time) | Marked lightcurve |
|---|---|---|---|---|---|---|---|
| A | 6956 | 4955 | 356 | 356 | 5.12% | 7.18% | 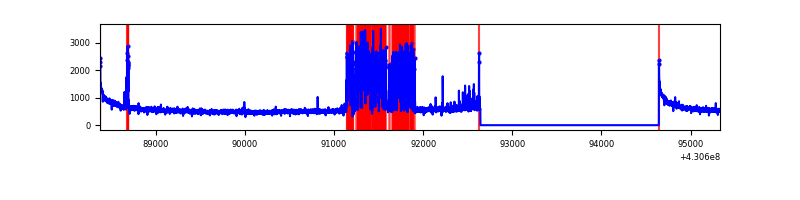 |
| B | 6956 | 4955 | 55 | 55 | 0.79% | 1.11% | 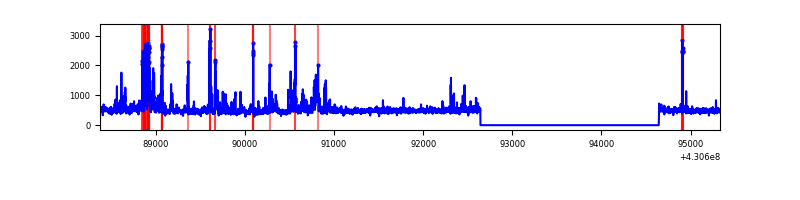 |
| C | 6956 | 4955 | 21 | 21 | 0.30% | 0.42% | 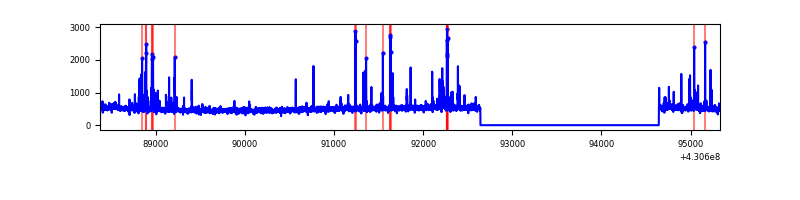 |
| D | 6956 | 4955 | 370 | 370 | 5.32% | 7.47% | 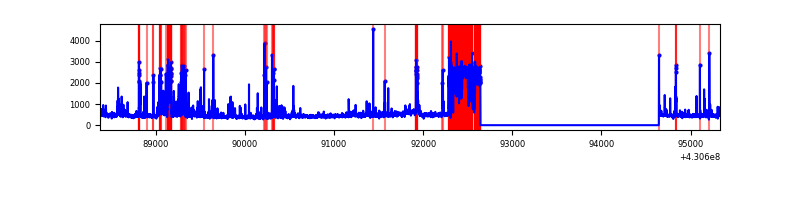 |
Top three noisy pixels from each quadrant. If the there are fewer than three noisy pixels in the level2.evt file, extra rows are filled as -1
| Pixel properties | Quadrant properties | ||||||
|---|---|---|---|---|---|---|---|
| Quadrant | DetID | PixID | Counts | Sigma | Mean | Median | Sigma |
| A | 13 | 248 | 1057204 | 9171.7 | 558 | 548 | 115.2 |
| A | 10 | 83 | 519731 | 4506.47 | 558 | 548 | 115.2 |
| A | 12 | 189 | 15492 | 129.71 | 558 | 548 | 115.2 |
| B | 0 | 229 | 359295 | 3257.87 | 571 | 556 | 110.1 |
| B | 5 | 172 | 45185 | 405.3 | 571 | 556 | 110.1 |
| B | 0 | 245 | 41760 | 374.19 | 571 | 556 | 110.1 |
| C | 15 | 214 | 205032 | 1562.81 | 561 | 565 | 130.8 |
| C | 14 | 254 | 191454 | 1459.03 | 561 | 565 | 130.8 |
| C | 3 | 233 | 20762 | 154.37 | 561 | 565 | 130.8 |
| D | 12 | 233 | 905834 | 6885.76 | 536 | 521 | 131.5 |
| D | 12 | 6 | 76520 | 578.04 | 536 | 521 | 131.5 |
| D | 12 | 217 | 66498 | 501.82 | 536 | 521 | 131.5 |
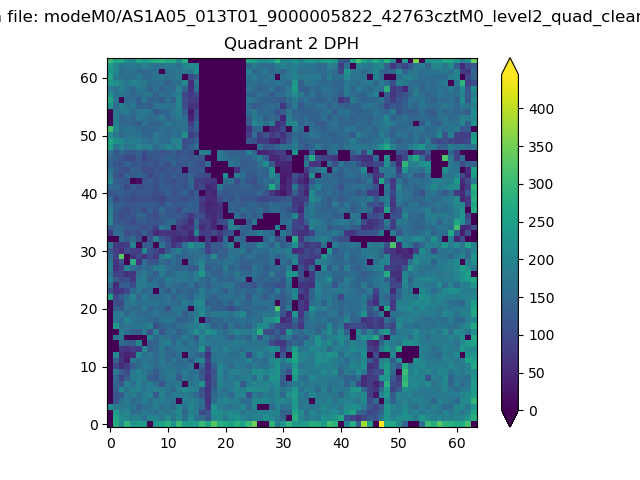
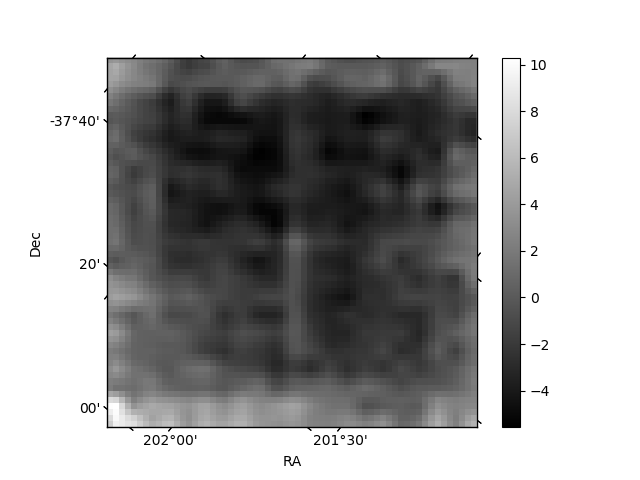
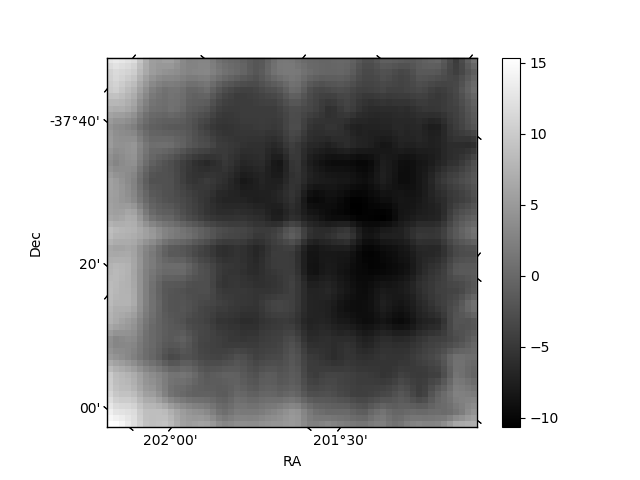
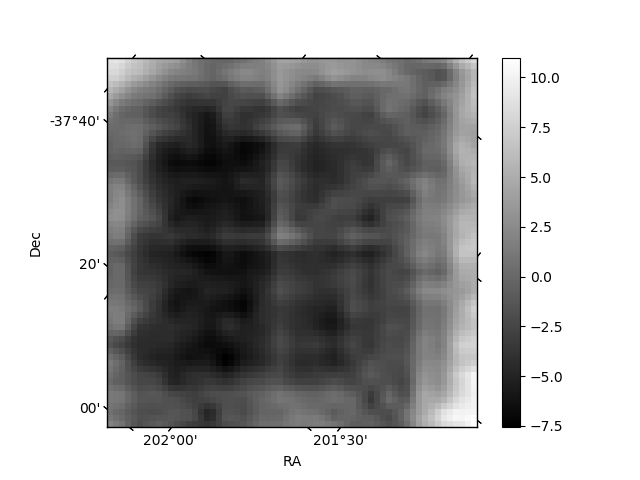
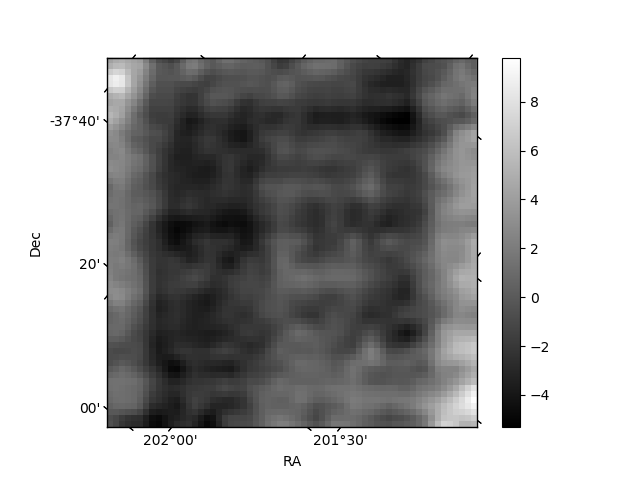
Histogram calculated using DETX and DETY for each event in the final _common_clean file
| Quadrant A | 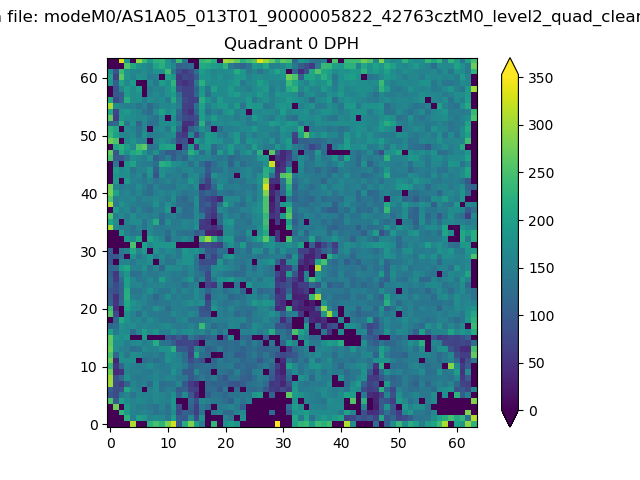 |
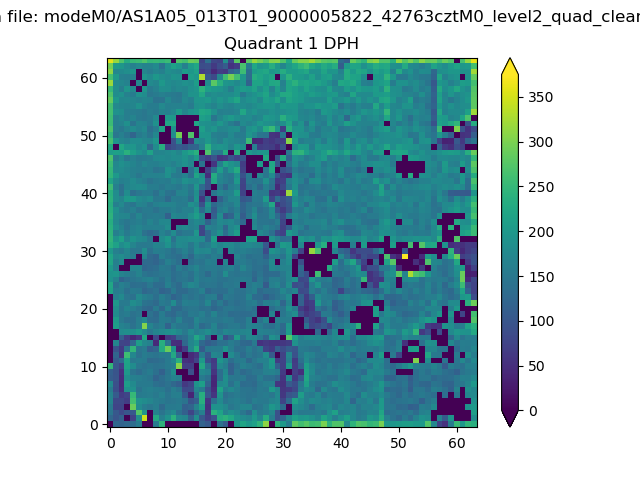 |
Quadrant B |
|---|---|---|---|
| Quadrant D | 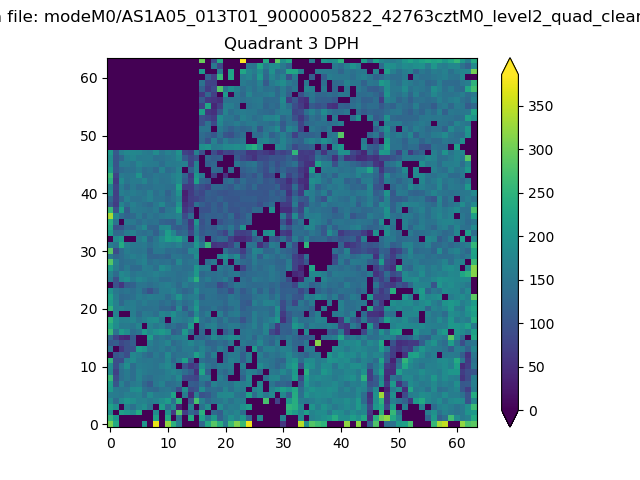 |
 |
Quadrant C |
| Plot type | Count rate plots | Images |
|---|---|---|
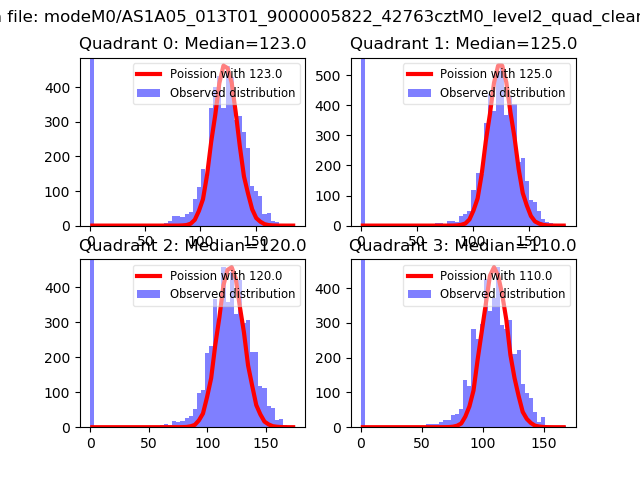
| Comparison with Poisson distribution Blue bars denote a histogram of data divided into 1 sec bins. Red curve is a Poisson curve with rate = median count rate of data. |
 |
 |
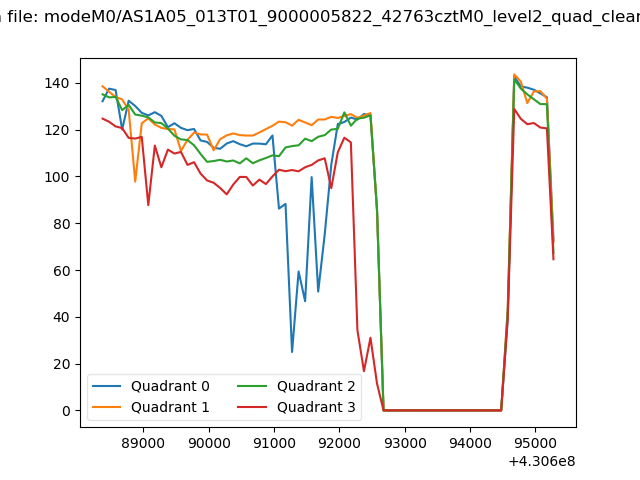
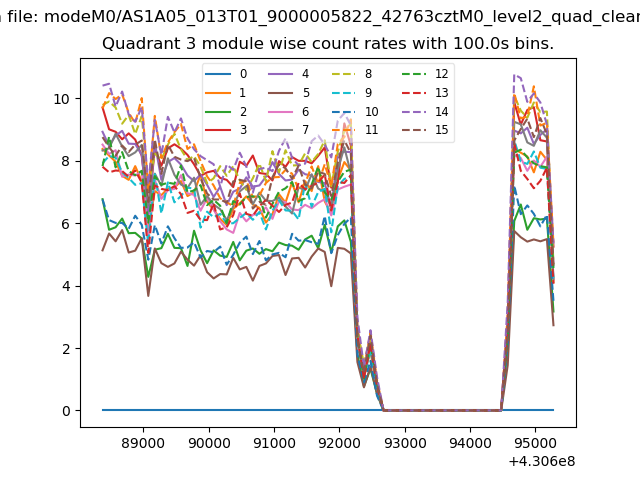
| Quadrant-wise count rates Data is divided into 100 sec bins |
 |
|
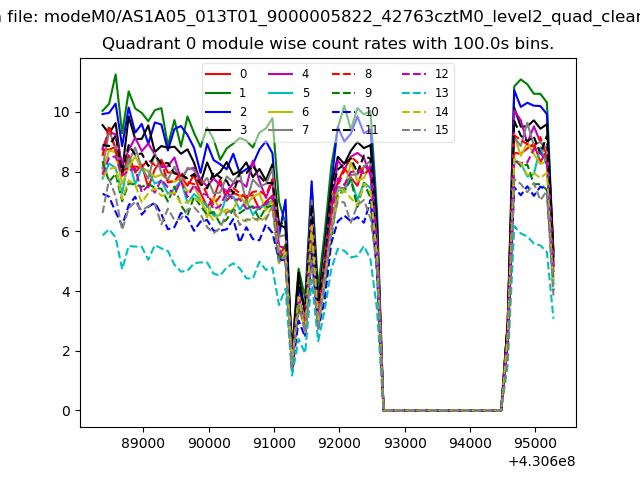
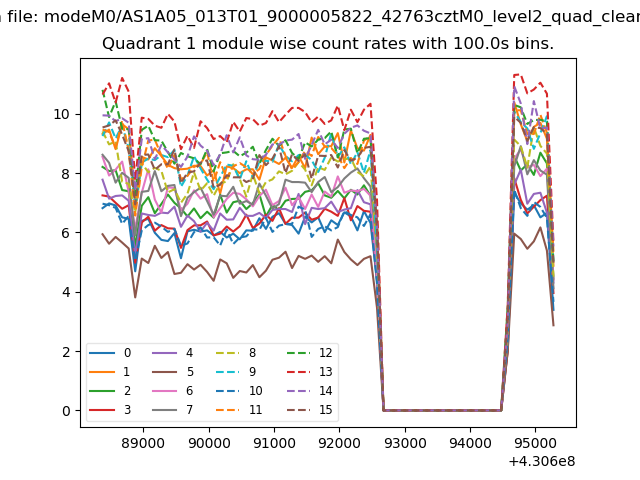
| Module-wise count rates for Quadrant A Data is divided into 100 sec bins |
 |
 |
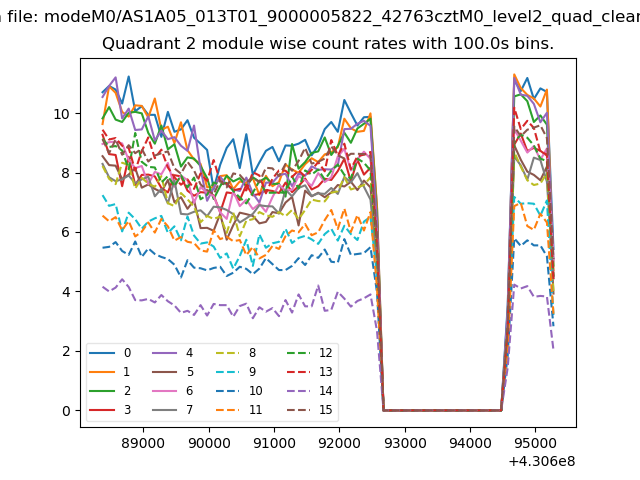
| Module-wise count rates for Quadrant B Data is divided into 100 sec bins |
 |
 |
| Module-wise count rates for Quadrant C Data is divided into 100 sec bins |
 |
 |
| Module-wise count rates for Quadrant D Data is divided into 100 sec bins |
 |
 |
| Parameter | Plot |
|---|---|
| CZT HV Monitor | 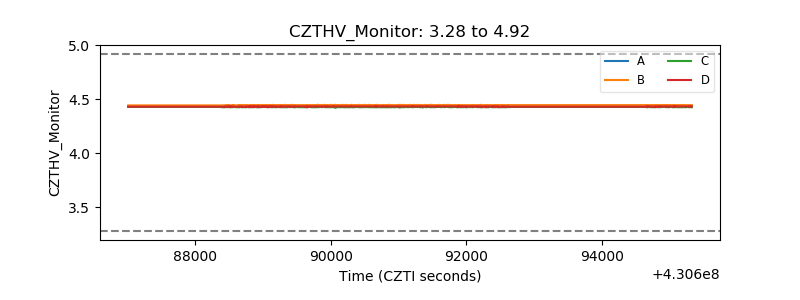 |
| D_VDD | 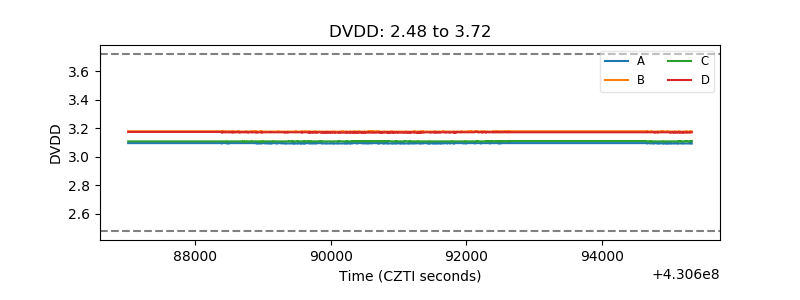 |
| Temperature 1 | 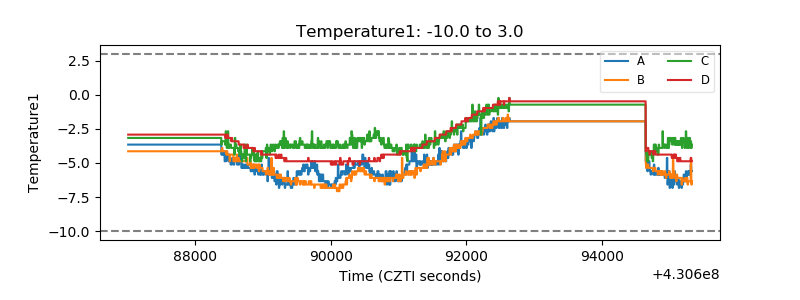 |
| Veto HV Monitor | 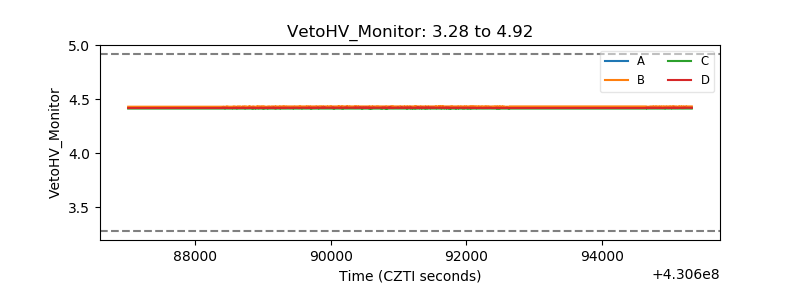 |
| Veto LLD | 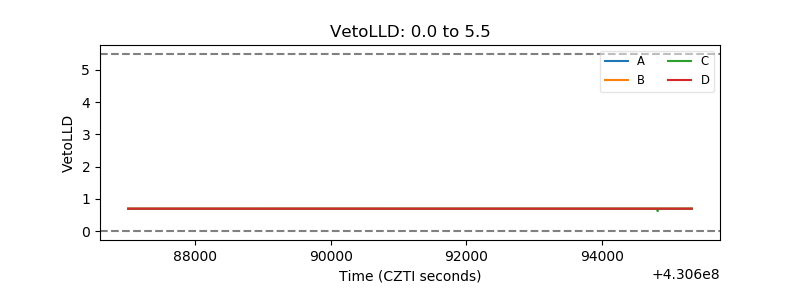 |
| Alpha Counter | 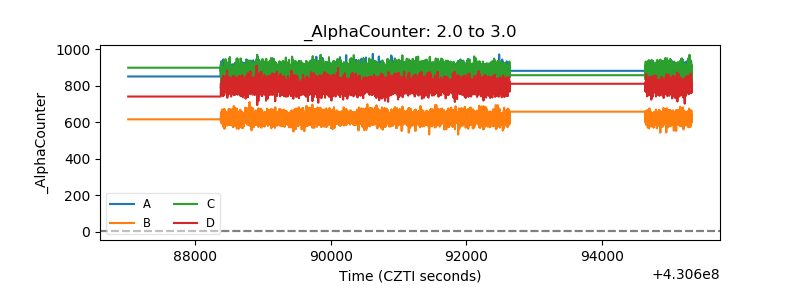 |
| _CPM_Rate | 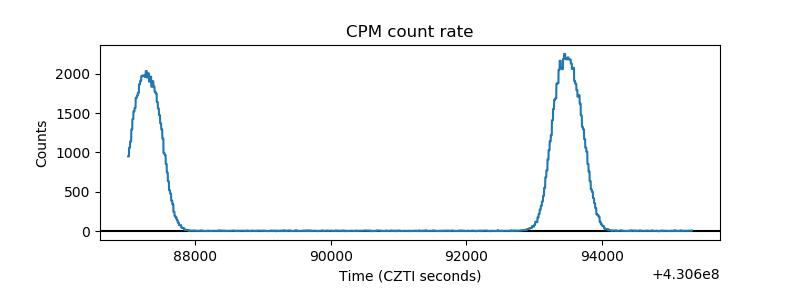 |
| CZT Counter | 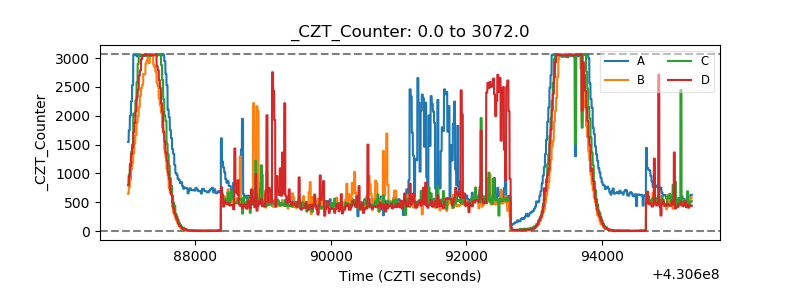 |
| +2.5 Volts monitor | 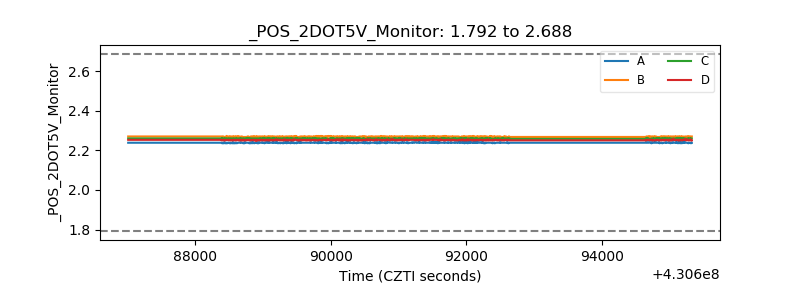 |
| +5 Volts monitor | 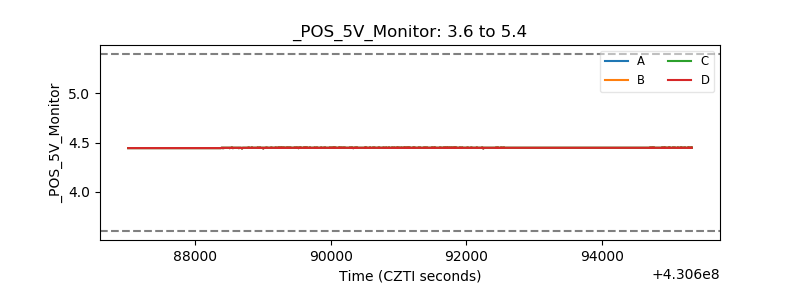 |
| _ROLL_ROT | 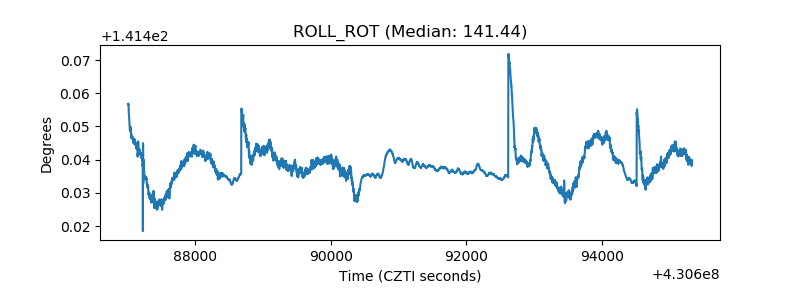 |
| _Roll_DEC | 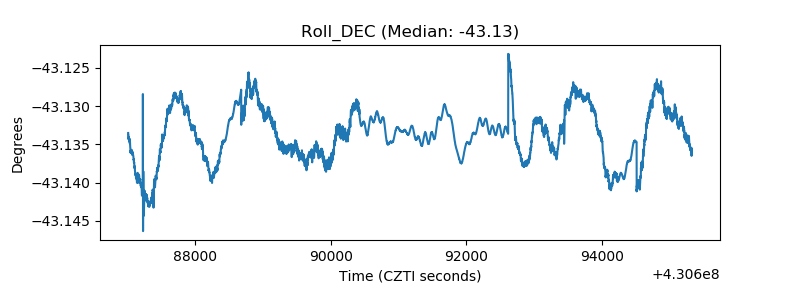 |
| _Roll_RA | 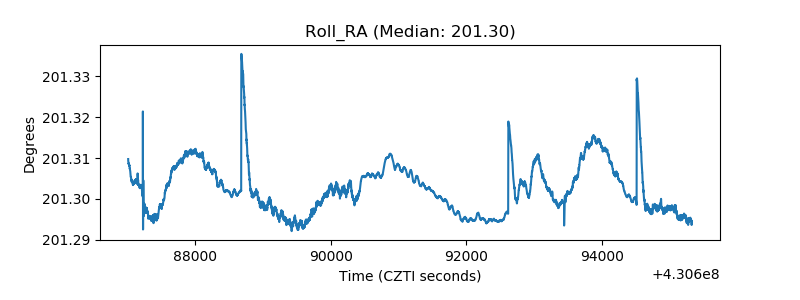 |
| Veto Counter | 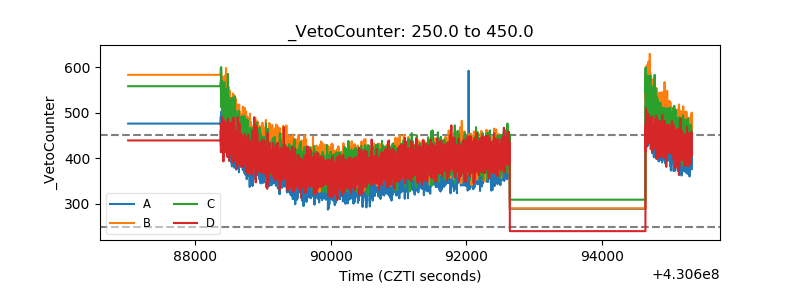 |