| Param | Original file | Final file |
|---|---|---|
| Filename | modeM0/AS1A05_013T01_9000005822_42764cztM0_level2.fits | modeM0/AS1A05_013T01_9000005822_42764cztM0_level2_quad_clean.evt |
| Size (bytes) | 294,243,840 | 89,449,920 |
| Size | 280.6 MB | 85.3 MB |
| Events in quadrant A | 3,087,451 | 605,159 |
| Events in quadrant B | 2,456,917 | 619,015 |
| Events in quadrant C | 2,509,334 | 595,314 |
| Events in quadrant D | 2,458,727 | 548,166 |
| Mode M0 | |||
|---|---|---|---|
| Quadrant | BADHDUFLAG | Total packets | Discarded packets |
| A | 0 | 12067 | 2 |
| B | 0 | 10311 | 2 |
| C | 0 | 10181 | 2 |
| D | 0 | 10575 | 2 |
| Mode M9 | |||
|---|---|---|---|
| Quadrant | BADHDUFLAG | Total packets | Discarded packets |
| A | 0 | 36 | 0 |
| B | 0 | 37 | 0 |
| C | 0 | 37 | 0 |
| D | 0 | 37 | 0 |
| Mode SS | |||
|---|---|---|---|
| Quadrant | BADHDUFLAG | Total packets | Discarded packets |
| A | 0 | 98 | 0 |
| B | 0 | 98 | 0 |
| C | 0 | 98 | 0 |
| D | 0 | 98 | 0 |
| Quadrant | Total seconds | Saturated seconds | Saturation percentage |
|---|---|---|---|
| A | 4866 | 97 | 1.993424% |
| B | 4866 | 49 | 1.006987% |
| C | 4866 | 10 | 0.205508% |
| D | 4866 | 32 | 0.657624% |
Noise dominated data is calculated using 1-second bins in cleaned event files. If a bin has >2000 counts, and if more than 50% of those come from <1% of pixels, then it is considered to be noise-dominated and hence unusable.
| Quadrant | # 1 sec bins | Bins with >0 counts | Bins with >2000 counts | High rate bins dominated by noise | Noise dominated (total time) | Noise dominated (detector-on time) | Marked lightcurve |
|---|---|---|---|---|---|---|---|
| A | 6959 | 4867 | 79 | 79 | 1.14% | 1.62% | 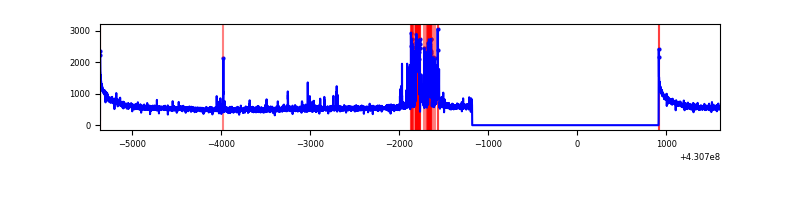 |
| B | 6959 | 4867 | 33 | 33 | 0.47% | 0.68% | 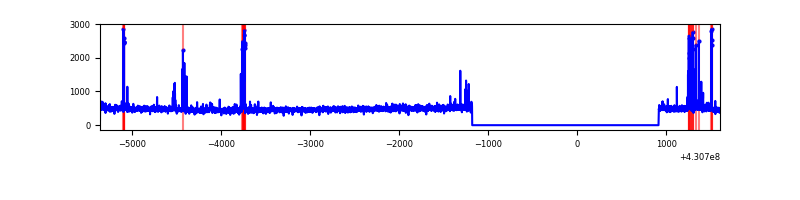 |
| C | 6959 | 4867 | 8 | 8 | 0.11% | 0.16% | 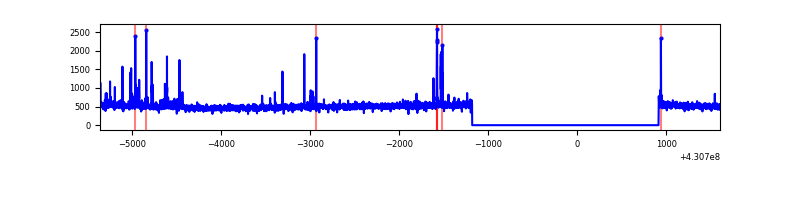 |
| D | 6959 | 4867 | 28 | 28 | 0.40% | 0.58% | 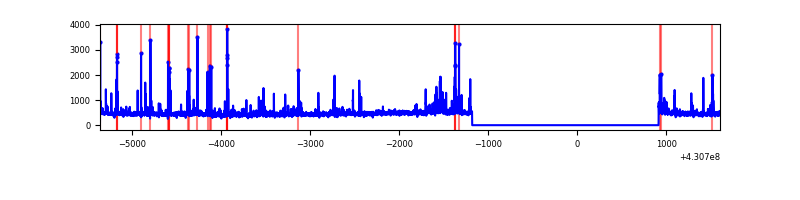 |
Top three noisy pixels from each quadrant. If the there are fewer than three noisy pixels in the level2.evt file, extra rows are filled as -1
| Pixel properties | Quadrant properties | ||||||
|---|---|---|---|---|---|---|---|
| Quadrant | DetID | PixID | Counts | Sigma | Mean | Median | Sigma |
| A | 10 | 83 | 516879 | 4406.17 | 573 | 563 | 117.2 |
| A | 13 | 248 | 332026 | 2828.66 | 573 | 563 | 117.2 |
| A | 12 | 189 | 16249 | 133.86 | 573 | 563 | 117.2 |
| B | 0 | 156 | 87989 | 796.52 | 572 | 556 | 109.8 |
| B | 5 | 172 | 57717 | 520.74 | 572 | 556 | 109.8 |
| B | 0 | 245 | 21752 | 193.1 | 572 | 556 | 109.8 |
| C | 15 | 214 | 203487 | 1547.47 | 562 | 566 | 131.1 |
| C | 14 | 254 | 88768 | 672.63 | 562 | 566 | 131.1 |
| C | 3 | 233 | 9150 | 65.46 | 562 | 566 | 131.1 |
| D | 12 | 6 | 75452 | 554.63 | 557 | 542 | 135.1 |
| D | 2 | 249 | 54251 | 397.66 | 557 | 542 | 135.1 |
| D | 12 | 217 | 51532 | 377.53 | 557 | 542 | 135.1 |
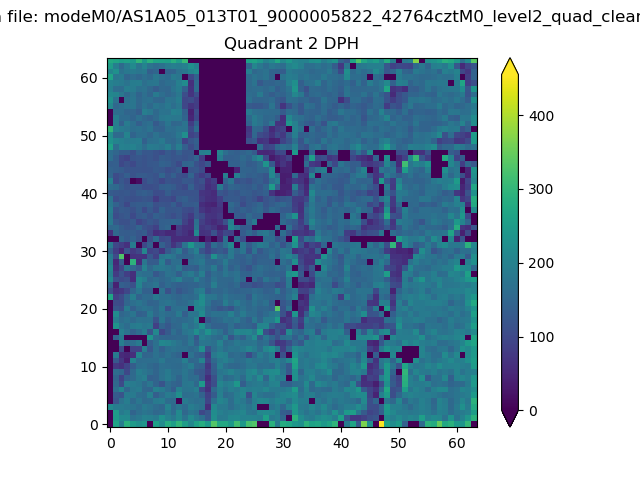
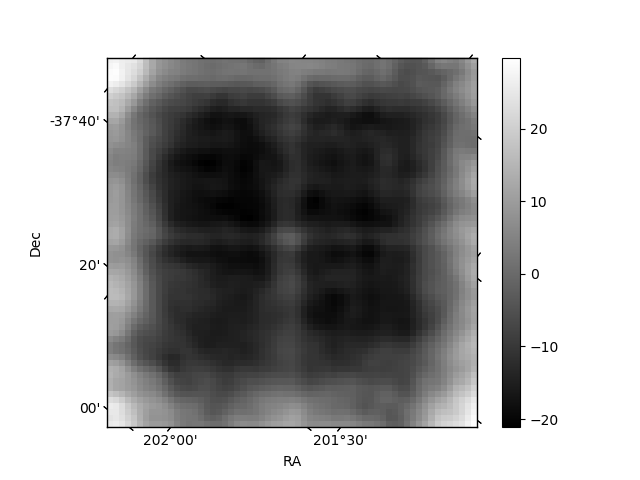
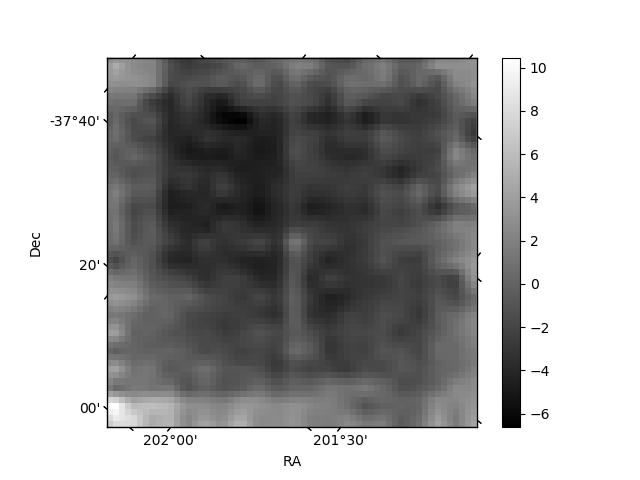
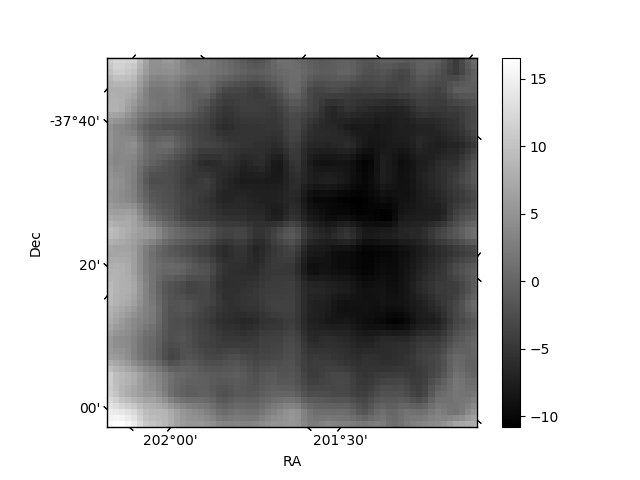
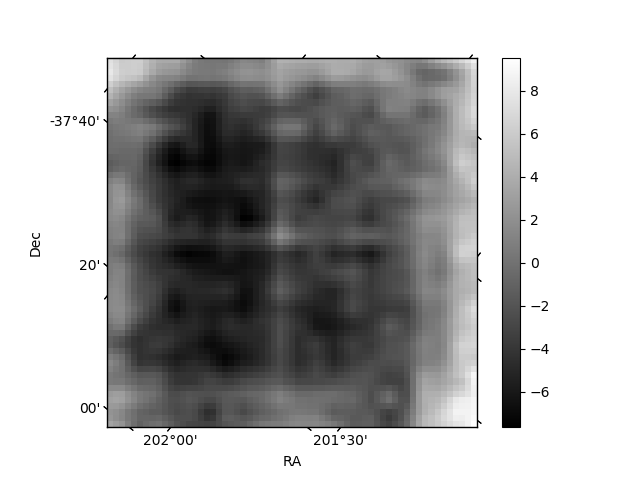
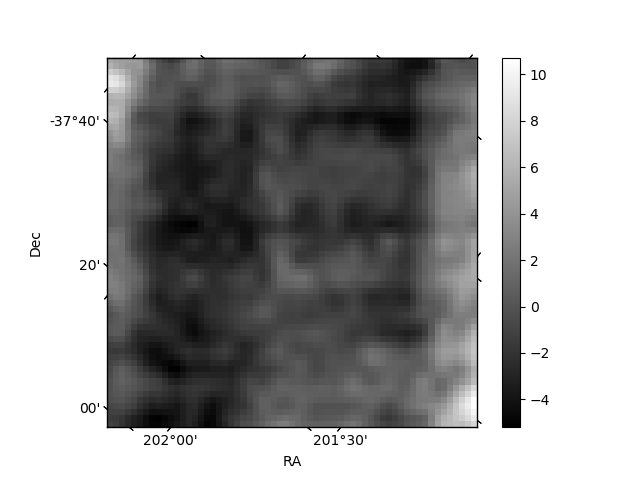
Histogram calculated using DETX and DETY for each event in the final _common_clean file
| Quadrant A | 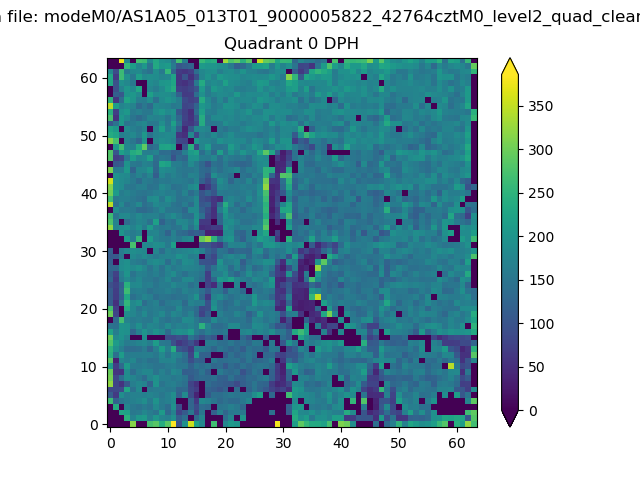 |
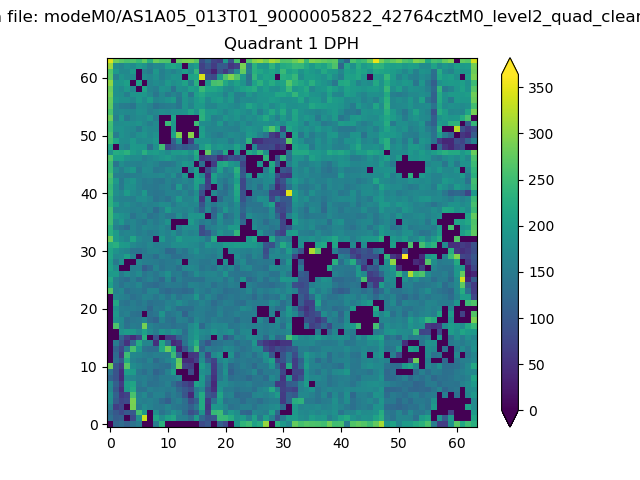 |
Quadrant B |
|---|---|---|---|
| Quadrant D | 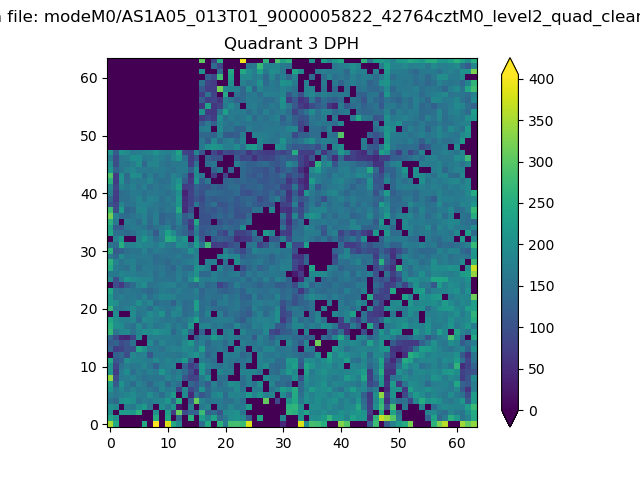 |
 |
Quadrant C |
| Plot type | Count rate plots | Images |
|---|---|---|
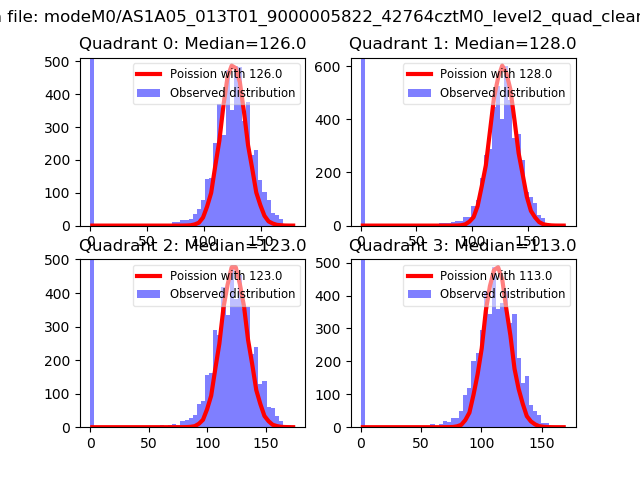
| Comparison with Poisson distribution Blue bars denote a histogram of data divided into 1 sec bins. Red curve is a Poisson curve with rate = median count rate of data. |
 |
 |
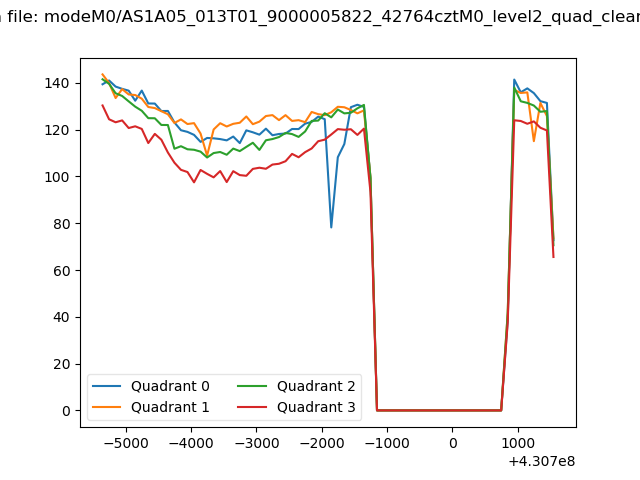
| Quadrant-wise count rates Data is divided into 100 sec bins |
 |
|
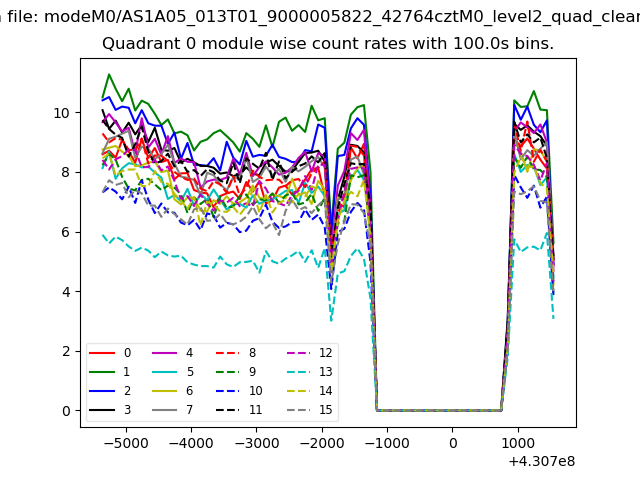
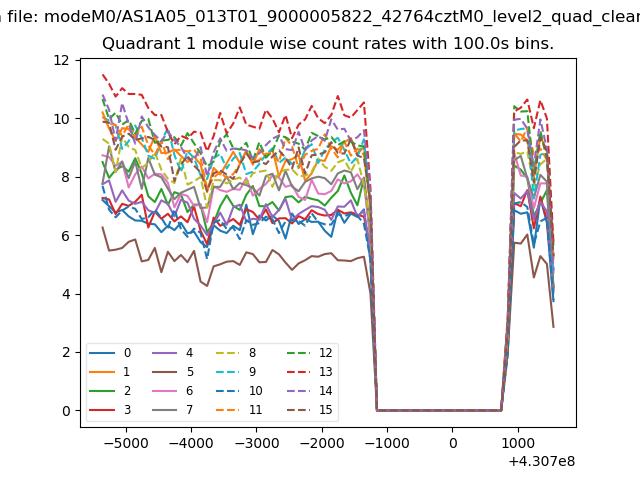
| Module-wise count rates for Quadrant A Data is divided into 100 sec bins |
 |
 |
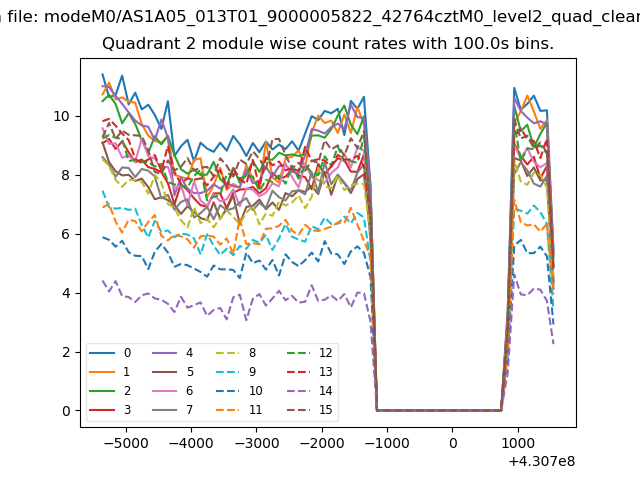
| Module-wise count rates for Quadrant B Data is divided into 100 sec bins |
 |
 |
| Module-wise count rates for Quadrant C Data is divided into 100 sec bins |
 |
 |
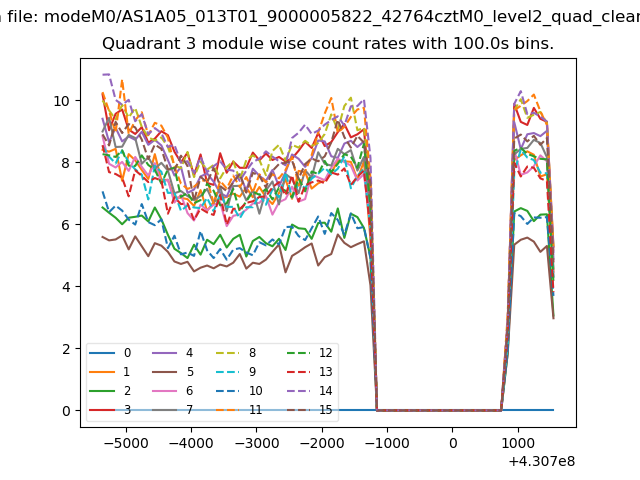
| Module-wise count rates for Quadrant D Data is divided into 100 sec bins |
 |
 |
| Parameter | Plot |
|---|---|
| CZT HV Monitor | 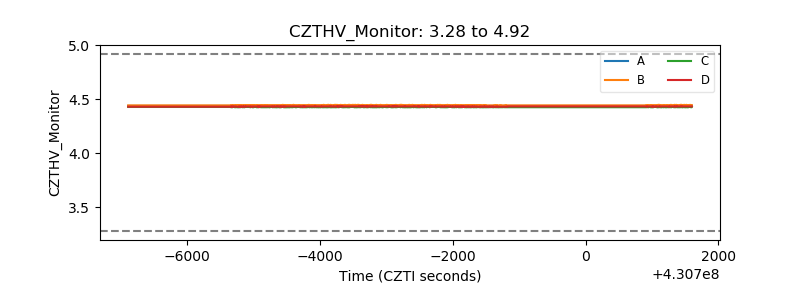 |
| D_VDD | 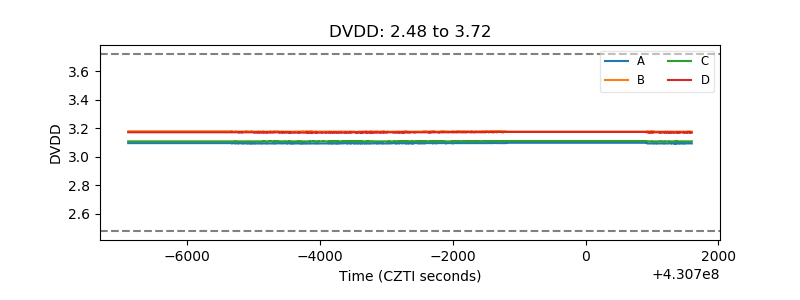 |
| Temperature 1 | 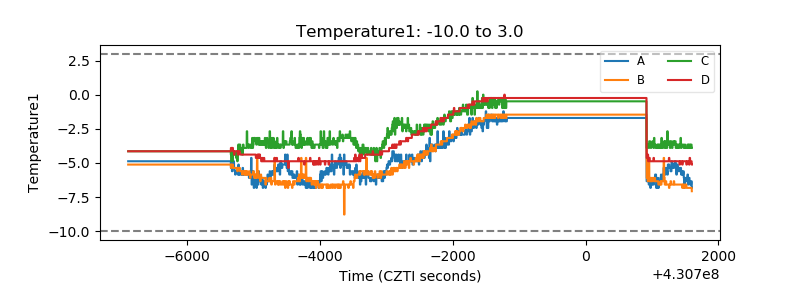 |
| Veto HV Monitor | 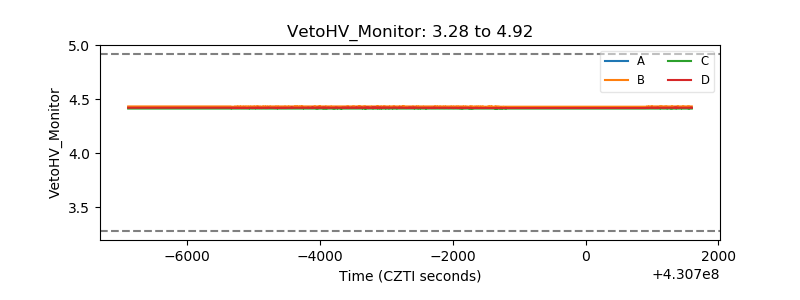 |
| Veto LLD | 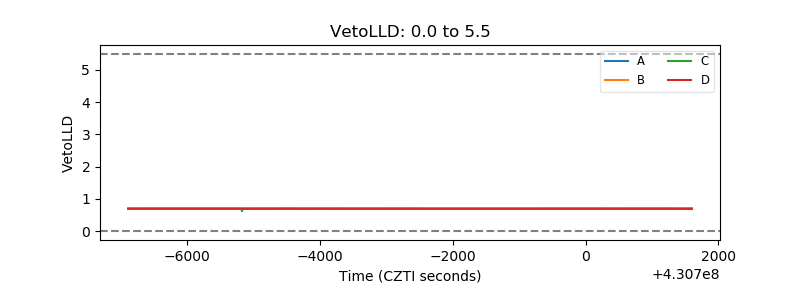 |
| Alpha Counter | 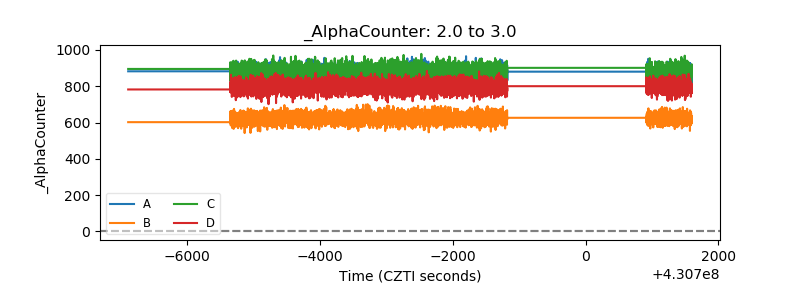 |
| _CPM_Rate | 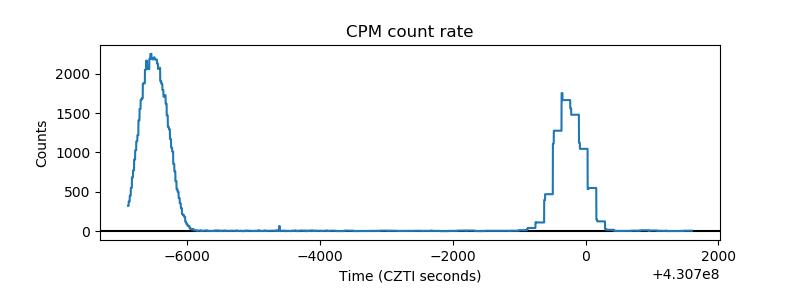 |
| CZT Counter | 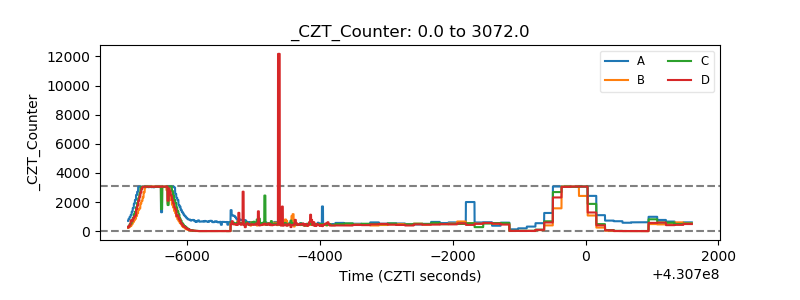 |
| +2.5 Volts monitor |  |
| +5 Volts monitor | 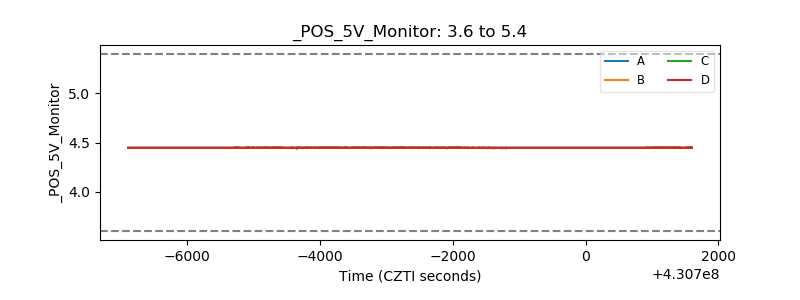 |
| _ROLL_ROT | 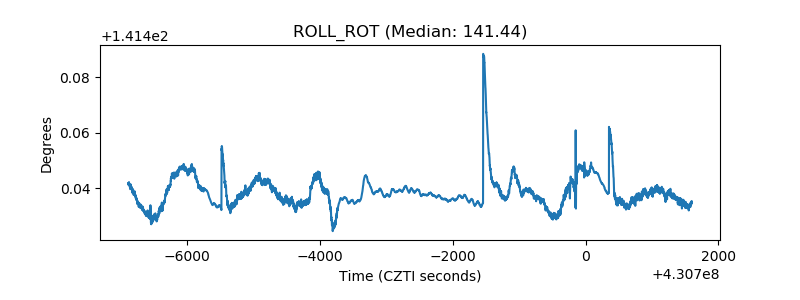 |
| _Roll_DEC | 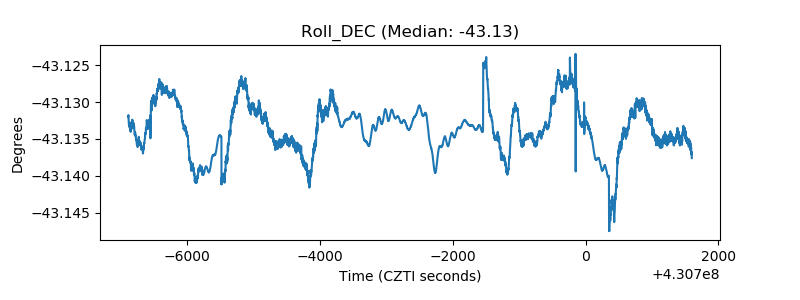 |
| _Roll_RA | 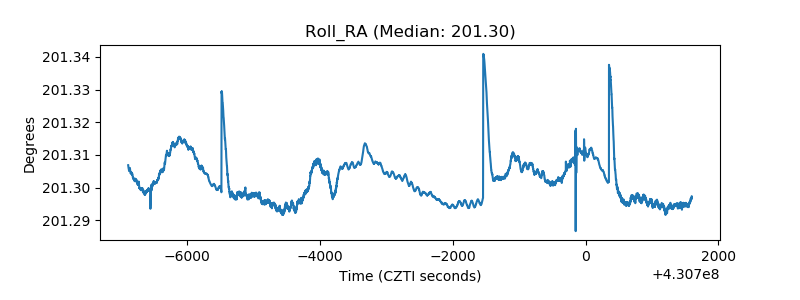 |
| Veto Counter |  |