| Param | Original file | Final file |
|---|---|---|
| Filename | modeM0/AS1A05_013T01_9000005822_42765cztM0_level2.fits | modeM0/AS1A05_013T01_9000005822_42765cztM0_level2_quad_clean.evt |
| Size (bytes) | 294,042,240 | 88,960,320 |
| Size | 280.4 MB | 84.8 MB |
| Events in quadrant A | 2,864,388 | 606,351 |
| Events in quadrant B | 2,782,486 | 610,276 |
| Events in quadrant C | 2,468,791 | 589,335 |
| Events in quadrant D | 2,385,223 | 543,052 |
| Mode M0 | |||
|---|---|---|---|
| Quadrant | BADHDUFLAG | Total packets | Discarded packets |
| A | 0 | 11438 | 2 |
| B | 0 | 11289 | 2 |
| C | 0 | 10067 | 2 |
| D | 0 | 10411 | 2 |
| Mode M9 | |||
|---|---|---|---|
| Quadrant | BADHDUFLAG | Total packets | Discarded packets |
| A | 0 | 36 | 0 |
| B | 0 | 37 | 0 |
| C | 0 | 37 | 0 |
| D | 0 | 37 | 0 |
| Mode SS | |||
|---|---|---|---|
| Quadrant | BADHDUFLAG | Total packets | Discarded packets |
| A | 0 | 100 | 0 |
| B | 0 | 100 | 0 |
| C | 0 | 100 | 0 |
| D | 0 | 100 | 0 |
| Quadrant | Total seconds | Saturated seconds | Saturation percentage |
|---|---|---|---|
| A | 4920 | 16 | 0.325203% |
| B | 4920 | 112 | 2.276423% |
| C | 4920 | 9 | 0.182927% |
| D | 4919 | 18 | 0.365928% |
Noise dominated data is calculated using 1-second bins in cleaned event files. If a bin has >2000 counts, and if more than 50% of those come from <1% of pixels, then it is considered to be noise-dominated and hence unusable.
| Quadrant | # 1 sec bins | Bins with >0 counts | Bins with >2000 counts | High rate bins dominated by noise | Noise dominated (total time) | Noise dominated (detector-on time) | Marked lightcurve |
|---|---|---|---|---|---|---|---|
| A | 7073 | 4921 | 7 | 7 | 0.10% | 0.14% | 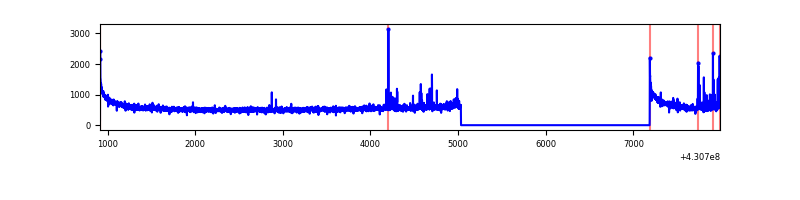 |
| B | 7073 | 4921 | 80 | 80 | 1.13% | 1.63% | 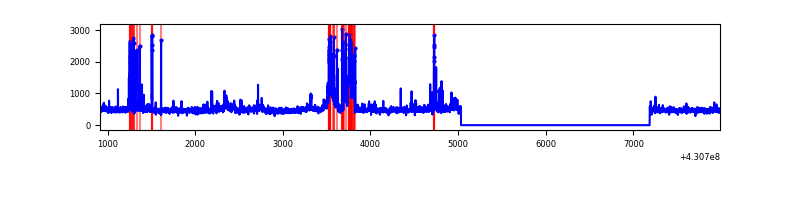 |
| C | 7073 | 4921 | 5 | 5 | 0.07% | 0.10% | 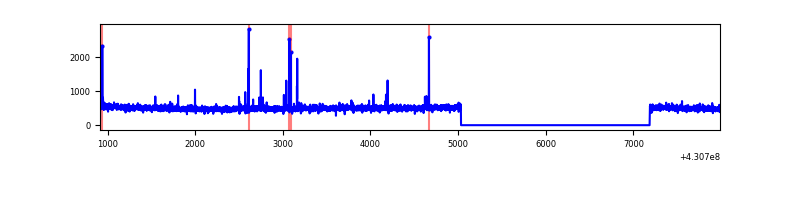 |
| D | 7072 | 4920 | 19 | 19 | 0.27% | 0.39% | 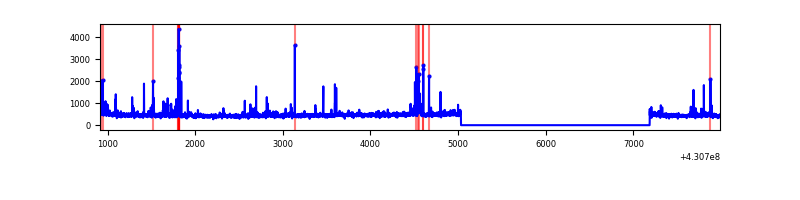 |
Top three noisy pixels from each quadrant. If the there are fewer than three noisy pixels in the level2.evt file, extra rows are filled as -1
| Pixel properties | Quadrant properties | ||||||
|---|---|---|---|---|---|---|---|
| Quadrant | DetID | PixID | Counts | Sigma | Mean | Median | Sigma |
| A | 10 | 83 | 517914 | 4409.15 | 578 | 567 | 117.3 |
| A | 13 | 248 | 92444 | 783.03 | 578 | 567 | 117.3 |
| A | 2 | 79 | 11308 | 91.54 | 578 | 567 | 117.3 |
| B | 0 | 229 | 373661 | 3404.54 | 570 | 556 | 109.6 |
| B | 0 | 156 | 75605 | 684.81 | 570 | 556 | 109.6 |
| B | 0 | 245 | 42643 | 384.04 | 570 | 556 | 109.6 |
| C | 15 | 214 | 205469 | 1560.0 | 565 | 570 | 131.3 |
| C | 14 | 254 | 30408 | 227.17 | 565 | 570 | 131.3 |
| C | 8 | 79 | 10132 | 72.8 | 565 | 570 | 131.3 |
| D | 2 | 249 | 125879 | 899.9 | 563 | 548 | 139.3 |
| D | 12 | 6 | 38670 | 273.72 | 563 | 548 | 139.3 |
| D | 2 | 234 | 24693 | 173.37 | 563 | 548 | 139.3 |
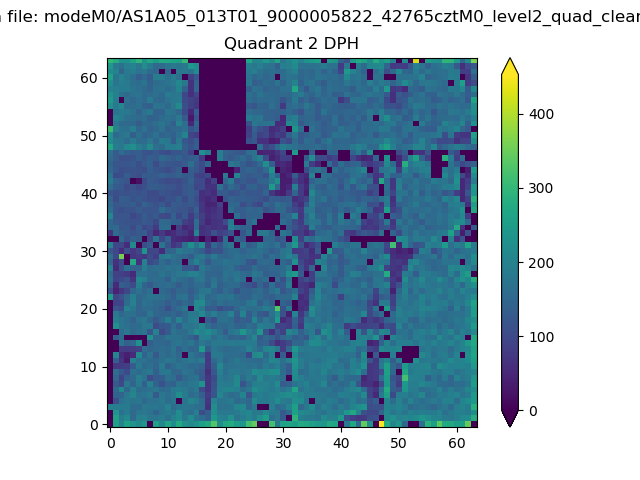
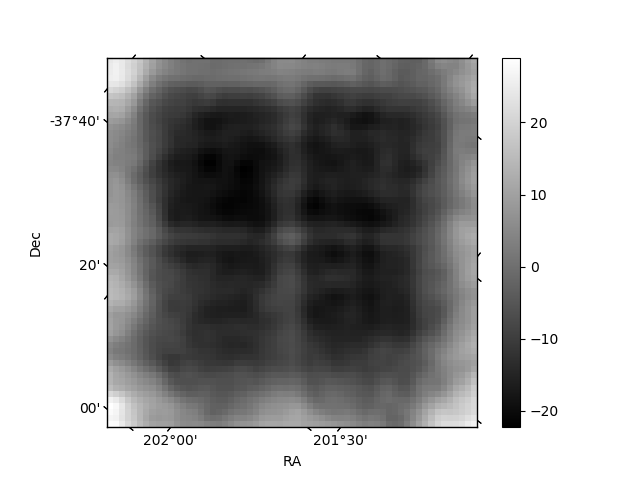
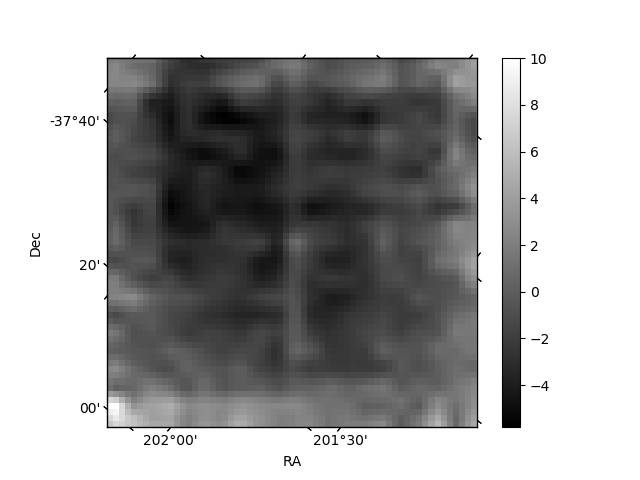
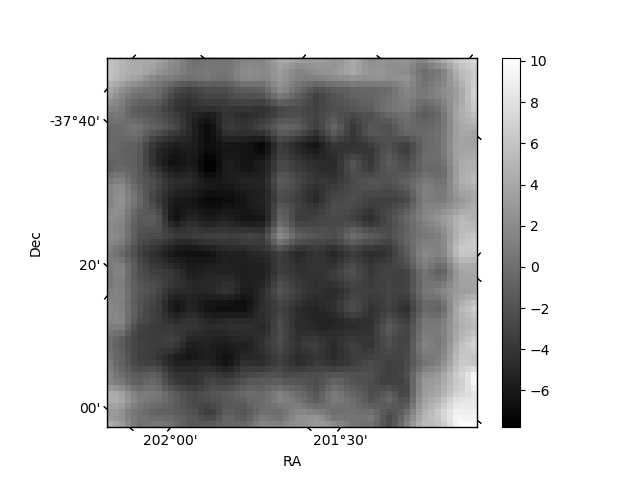
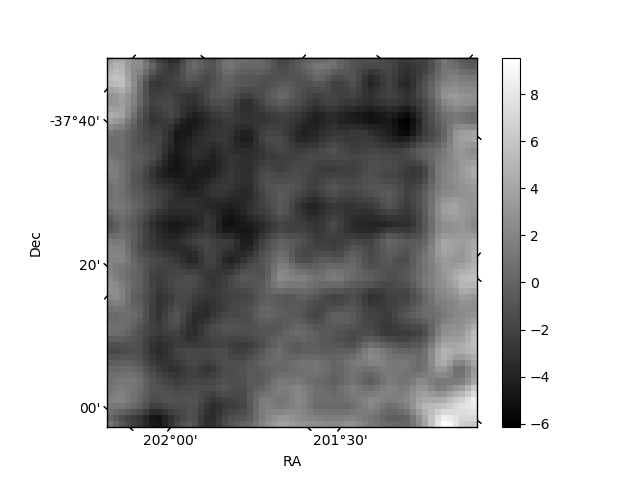
Histogram calculated using DETX and DETY for each event in the final _common_clean file
| Quadrant A | 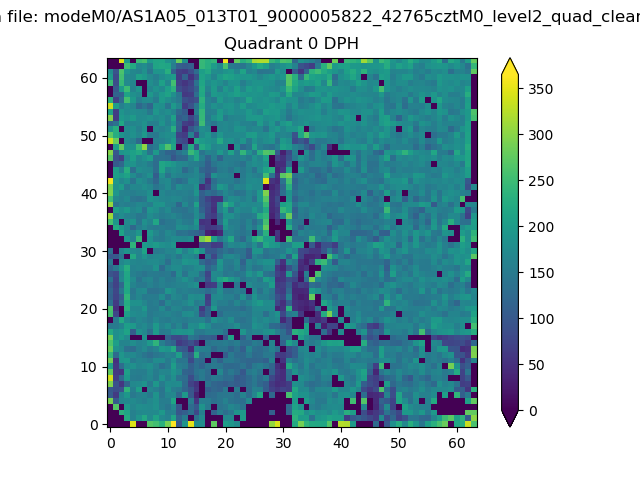 |
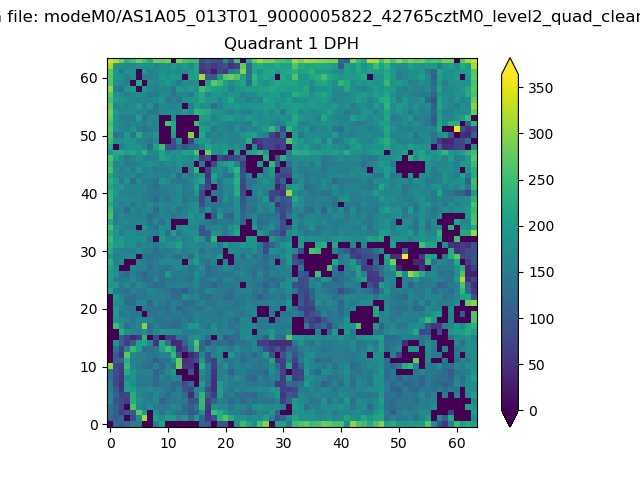 |
Quadrant B |
|---|---|---|---|
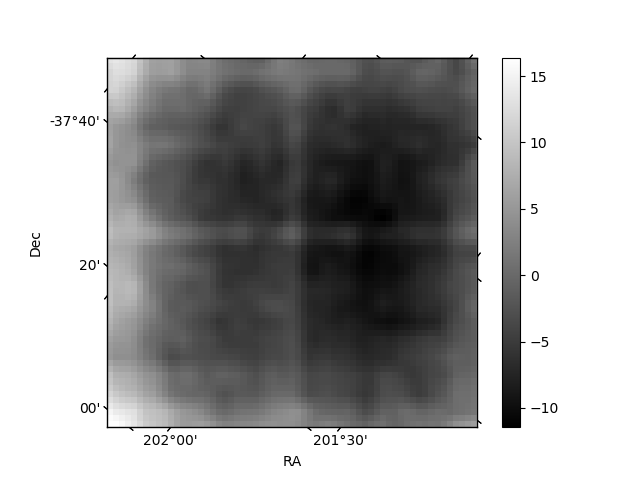
| Quadrant D | 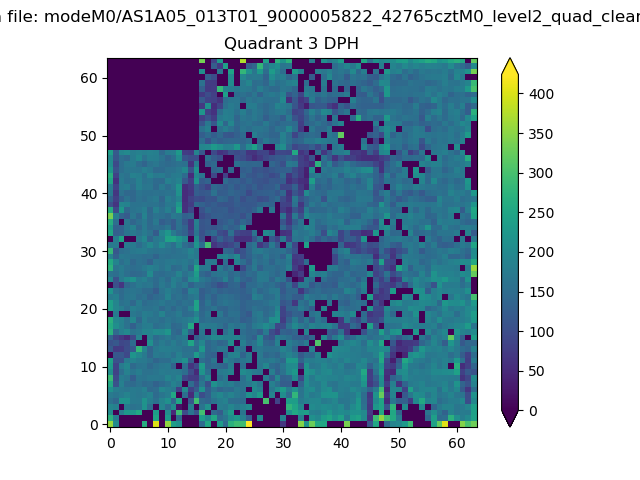 |
 |
Quadrant C |
| Plot type | Count rate plots | Images |
|---|---|---|
| Comparison with Poisson distribution Blue bars denote a histogram of data divided into 1 sec bins. Red curve is a Poisson curve with rate = median count rate of data. |
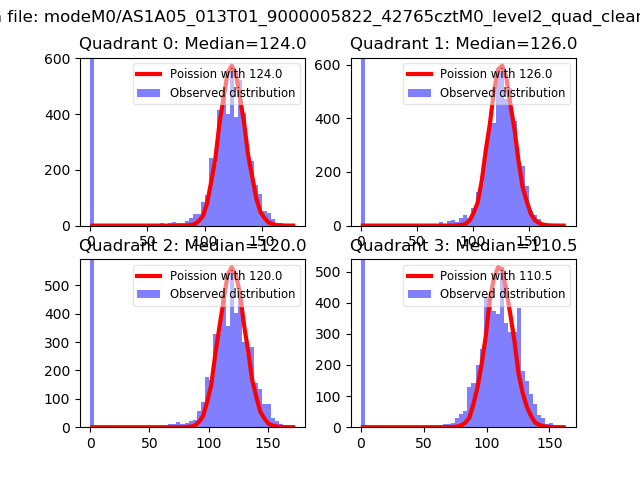 |
 |
| Quadrant-wise count rates Data is divided into 100 sec bins |
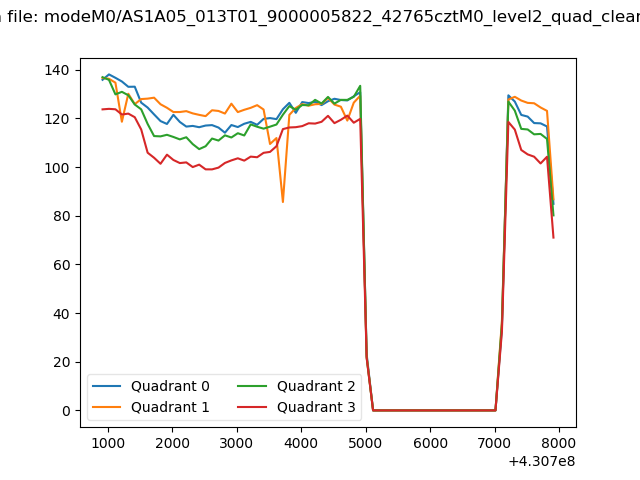 |
|
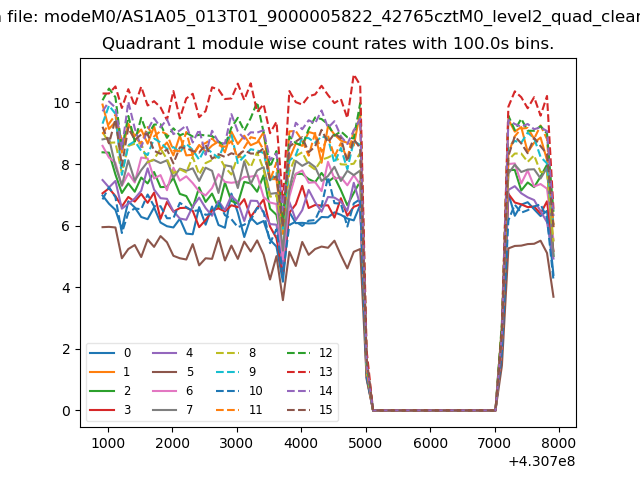
| Module-wise count rates for Quadrant A Data is divided into 100 sec bins |
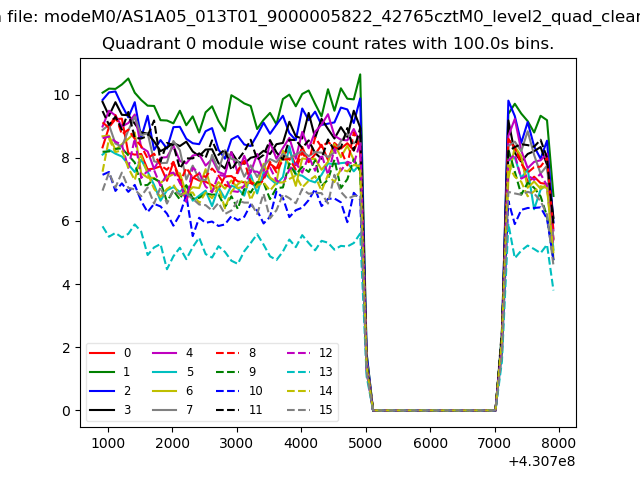 |
 |
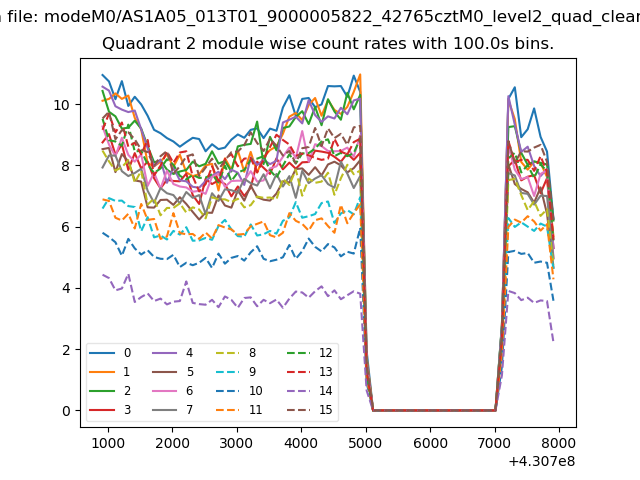
| Module-wise count rates for Quadrant B Data is divided into 100 sec bins |
 |
 |
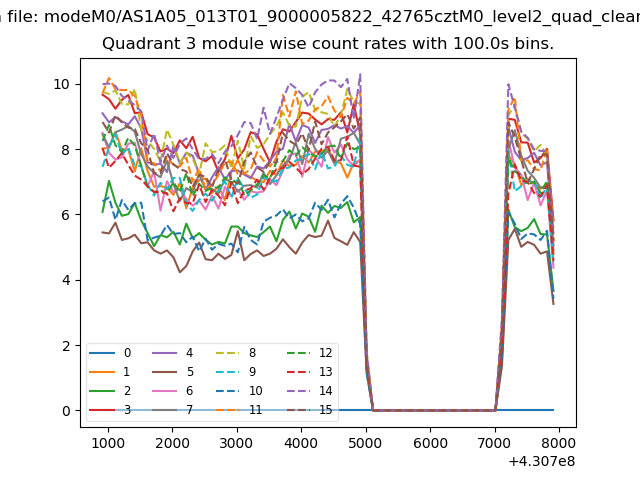
| Module-wise count rates for Quadrant C Data is divided into 100 sec bins |
 |
 |
| Module-wise count rates for Quadrant D Data is divided into 100 sec bins |
 |
 |
| Parameter | Plot |
|---|---|
| CZT HV Monitor | 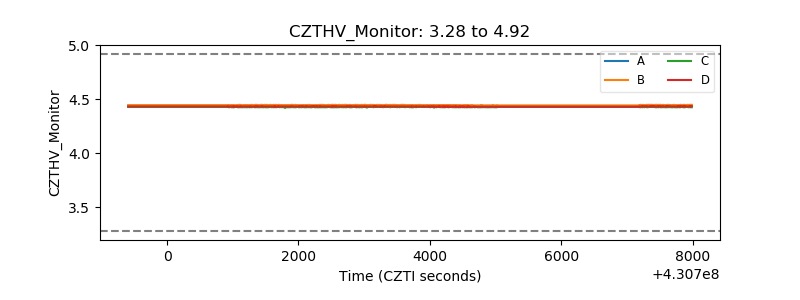 |
| D_VDD | 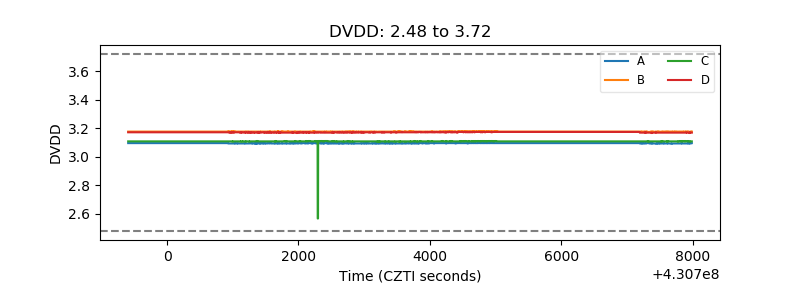 |
| Temperature 1 | 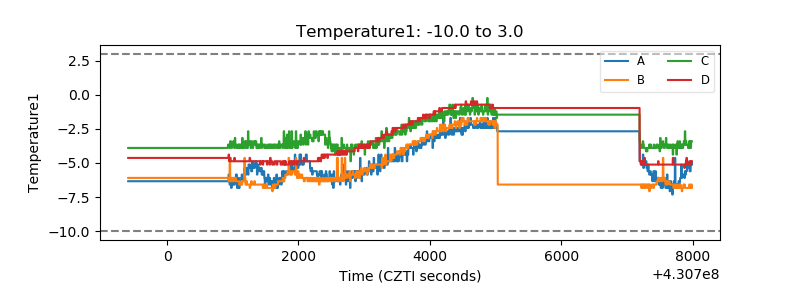 |
| Veto HV Monitor | 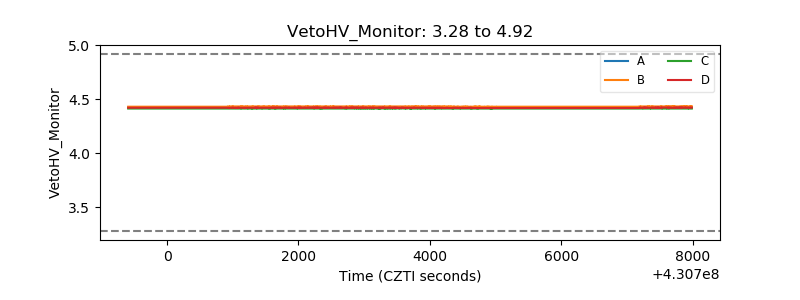 |
| Veto LLD | 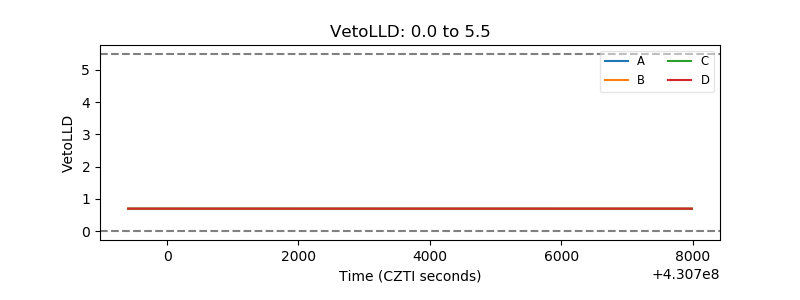 |
| Alpha Counter | 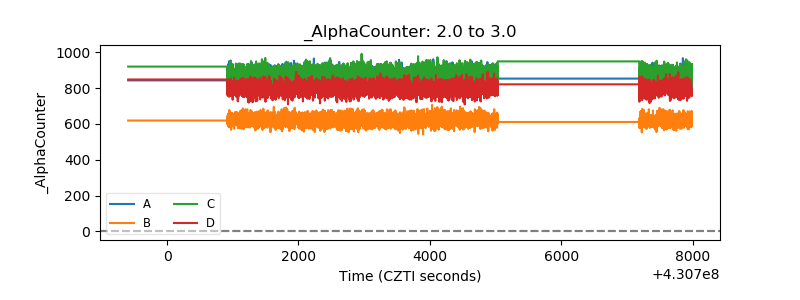 |
| _CPM_Rate | 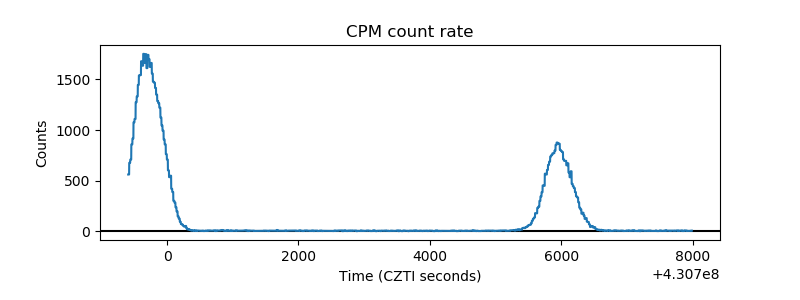 |
| CZT Counter | 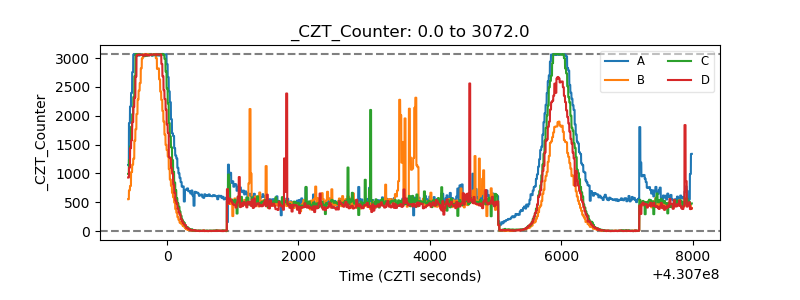 |
| +2.5 Volts monitor | 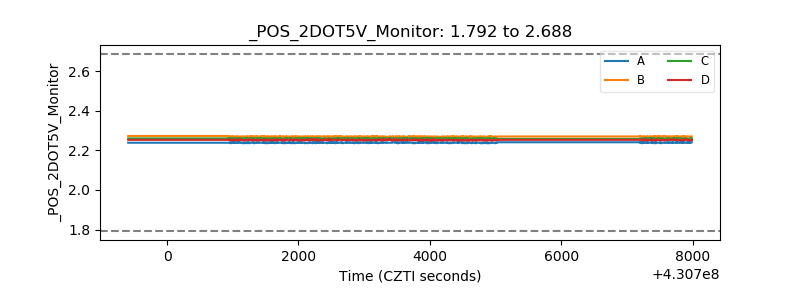 |
| +5 Volts monitor | 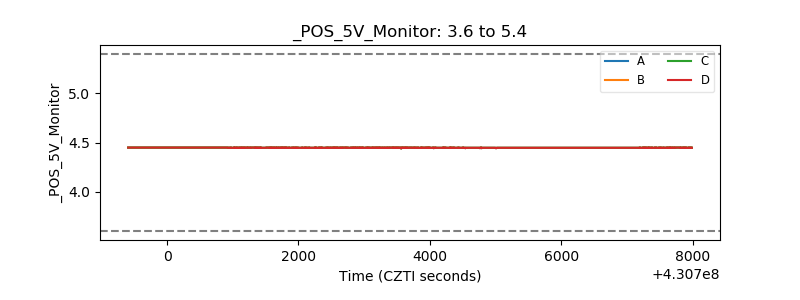 |
| _ROLL_ROT | 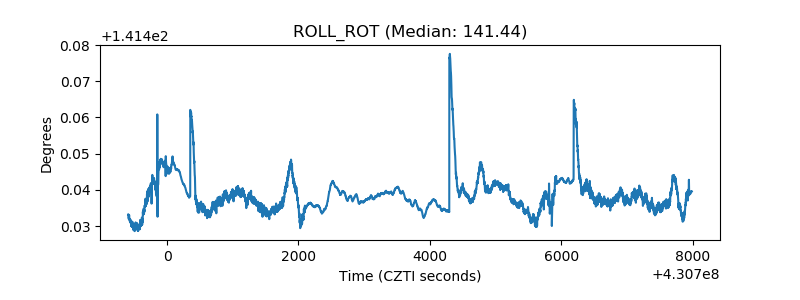 |
| _Roll_DEC | 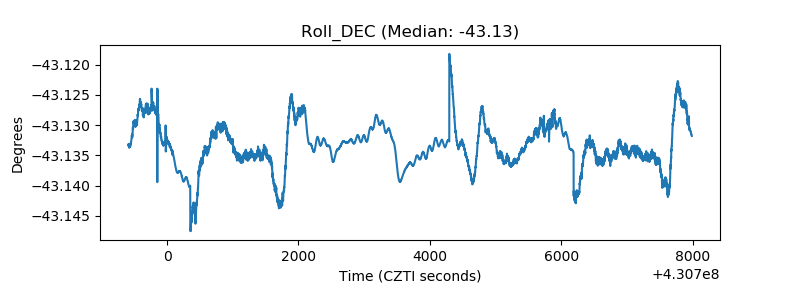 |
| _Roll_RA | 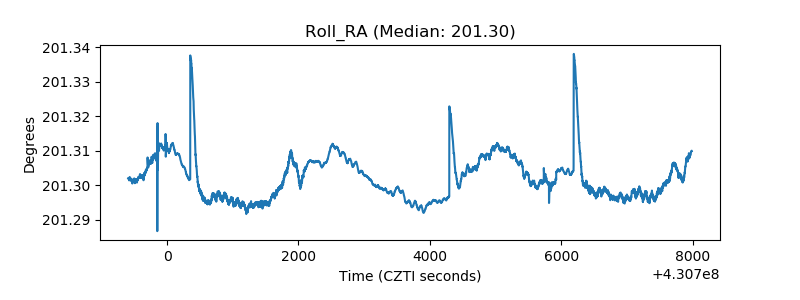 |
| Veto Counter | 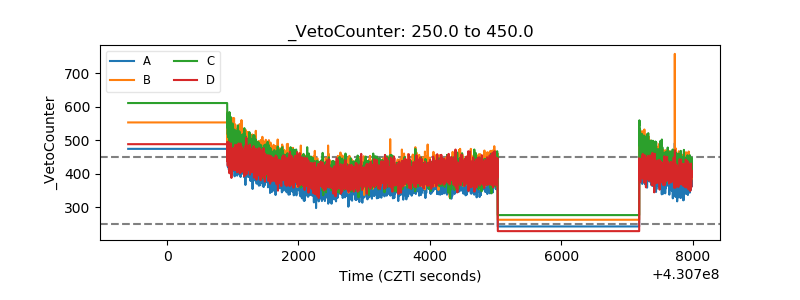 |