| Param | Original file | Final file |
|---|---|---|
| Filename | modeM0/AS1A05_013T01_9000005822_42766cztM0_level2.fits | modeM0/AS1A05_013T01_9000005822_42766cztM0_level2_quad_clean.evt |
| Size (bytes) | 297,527,040 | 85,337,280 |
| Size | 283.7 MB | 81.4 MB |
| Events in quadrant A | 3,470,190 | 565,634 |
| Events in quadrant B | 2,309,432 | 588,945 |
| Events in quadrant C | 2,447,584 | 567,149 |
| Events in quadrant D | 2,404,900 | 519,334 |
| Mode M0 | |||
|---|---|---|---|
| Quadrant | BADHDUFLAG | Total packets | Discarded packets |
| A | 0 | 13382 | 2 |
| B | 0 | 10059 | 2 |
| C | 0 | 10089 | 2 |
| D | 0 | 10535 | 2 |
| Mode M9 | |||
|---|---|---|---|
| Quadrant | BADHDUFLAG | Total packets | Discarded packets |
| A | 0 | 37 | 0 |
| B | 0 | 38 | 0 |
| C | 0 | 38 | 0 |
| D | 0 | 38 | 0 |
| Mode SS | |||
|---|---|---|---|
| Quadrant | BADHDUFLAG | Total packets | Discarded packets |
| A | 0 | 100 | 0 |
| B | 0 | 100 | 0 |
| C | 0 | 100 | 0 |
| D | 0 | 100 | 0 |
| Quadrant | Total seconds | Saturated seconds | Saturation percentage |
|---|---|---|---|
| A | 4890 | 170 | 3.476483% |
| B | 4890 | 19 | 0.388548% |
| C | 4890 | 7 | 0.143149% |
| D | 4890 | 34 | 0.695297% |
Noise dominated data is calculated using 1-second bins in cleaned event files. If a bin has >2000 counts, and if more than 50% of those come from <1% of pixels, then it is considered to be noise-dominated and hence unusable.
| Quadrant | # 1 sec bins | Bins with >0 counts | Bins with >2000 counts | High rate bins dominated by noise | Noise dominated (total time) | Noise dominated (detector-on time) | Marked lightcurve |
|---|---|---|---|---|---|---|---|
| A | 6983 | 4891 | 138 | 138 | 1.98% | 2.82% | 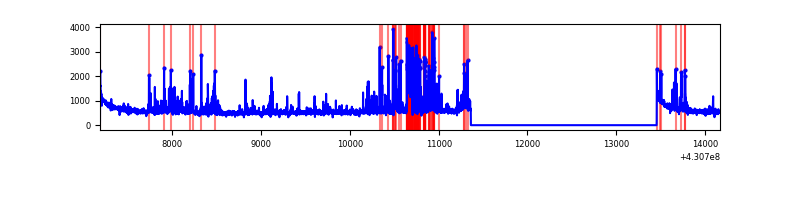 |
| B | 6983 | 4891 | 12 | 12 | 0.17% | 0.25% | 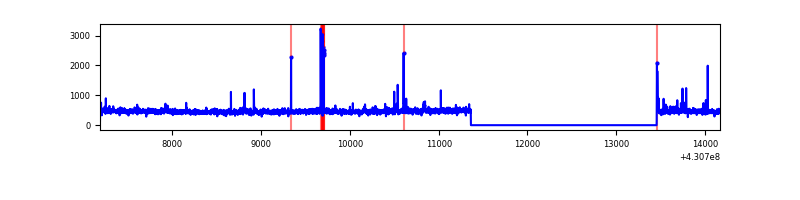 |
| C | 6983 | 4891 | 4 | 4 | 0.06% | 0.08% | 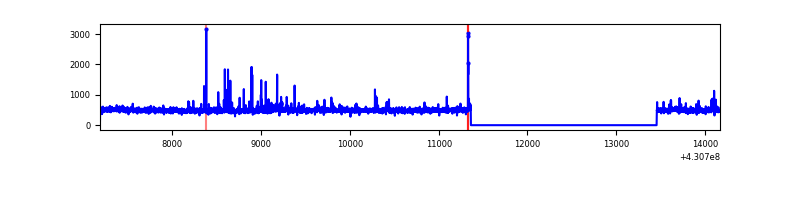 |
| D | 6983 | 4891 | 30 | 30 | 0.43% | 0.61% | 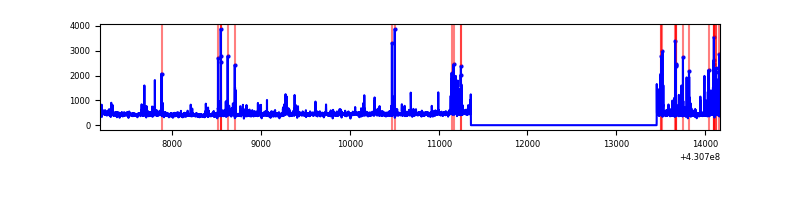 |
Top three noisy pixels from each quadrant. If the there are fewer than three noisy pixels in the level2.evt file, extra rows are filled as -1
| Pixel properties | Quadrant properties | ||||||
|---|---|---|---|---|---|---|---|
| Quadrant | DetID | PixID | Counts | Sigma | Mean | Median | Sigma |
| A | 13 | 248 | 587271 | 5167.97 | 554 | 543 | 113.5 |
| A | 10 | 83 | 520360 | 4578.61 | 554 | 543 | 113.5 |
| A | 15 | 223 | 176735 | 1551.92 | 554 | 543 | 113.5 |
| B | 0 | 229 | 62289 | 572.3 | 556 | 541 | 107.9 |
| B | 0 | 230 | 18817 | 169.39 | 556 | 541 | 107.9 |
| B | 5 | 255 | 15068 | 134.64 | 556 | 541 | 107.9 |
| C | 15 | 214 | 204650 | 1608.57 | 550 | 553 | 126.9 |
| C | 14 | 254 | 82599 | 646.64 | 550 | 553 | 126.9 |
| C | 3 | 233 | 7896 | 57.87 | 550 | 553 | 126.9 |
| D | 2 | 249 | 185818 | 1393.33 | 547 | 531 | 133.0 |
| D | 12 | 217 | 48100 | 357.71 | 547 | 531 | 133.0 |
| D | 12 | 6 | 25936 | 191.04 | 547 | 531 | 133.0 |
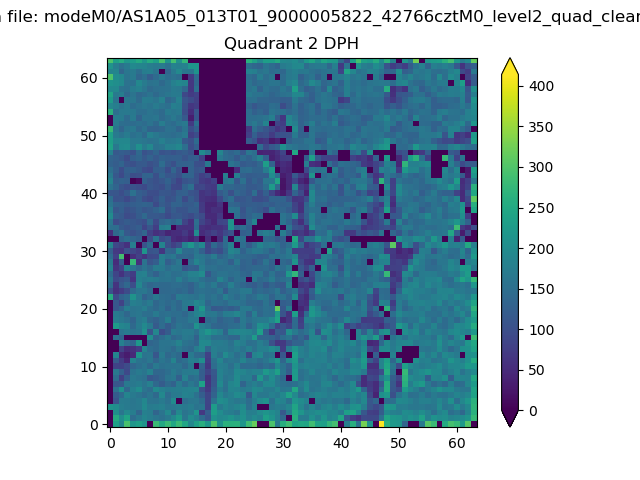
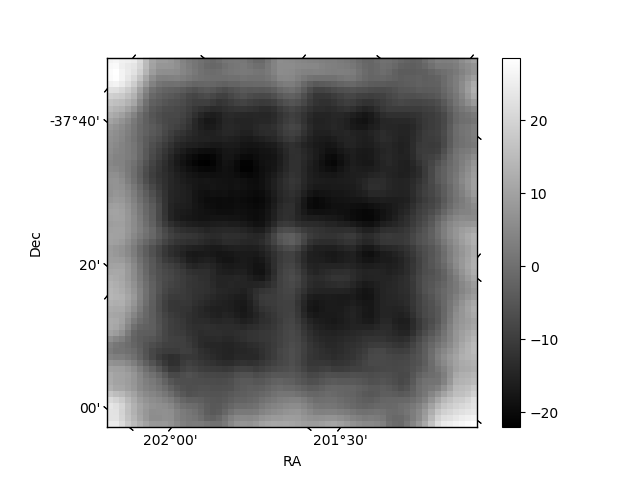
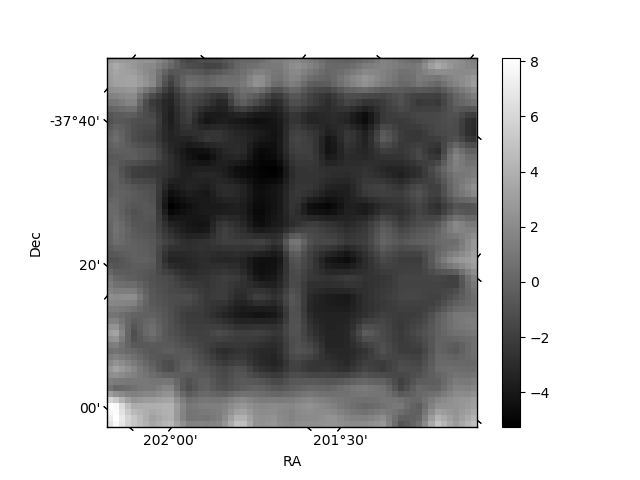
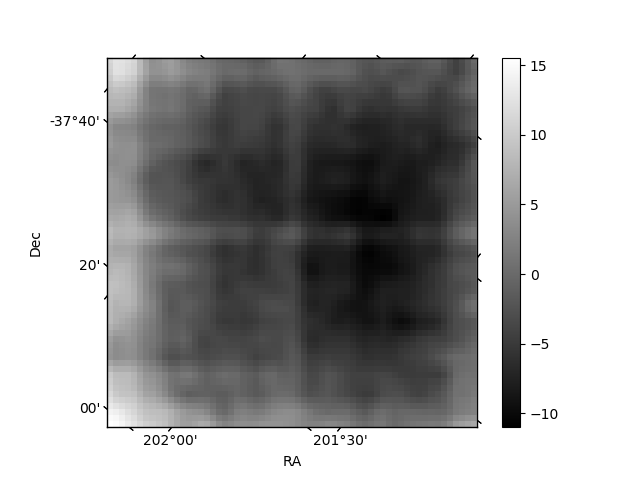
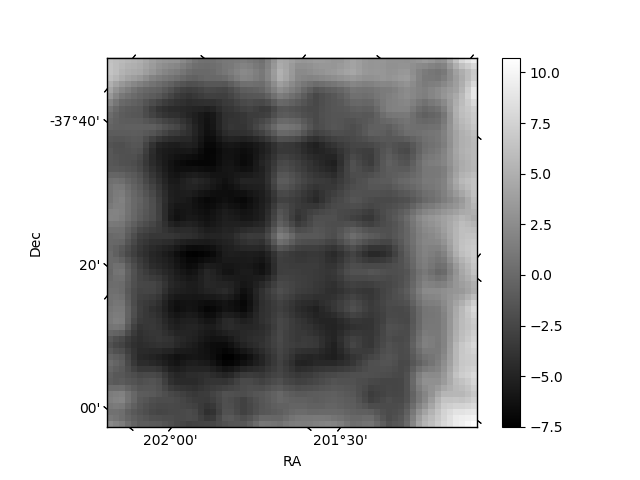
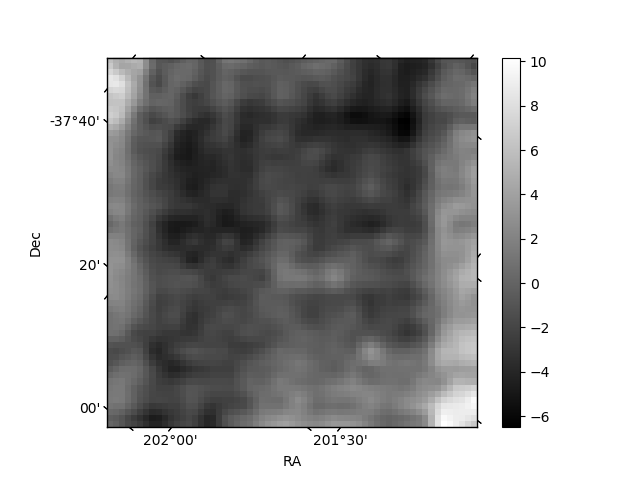
Histogram calculated using DETX and DETY for each event in the final _common_clean file
| Quadrant A | 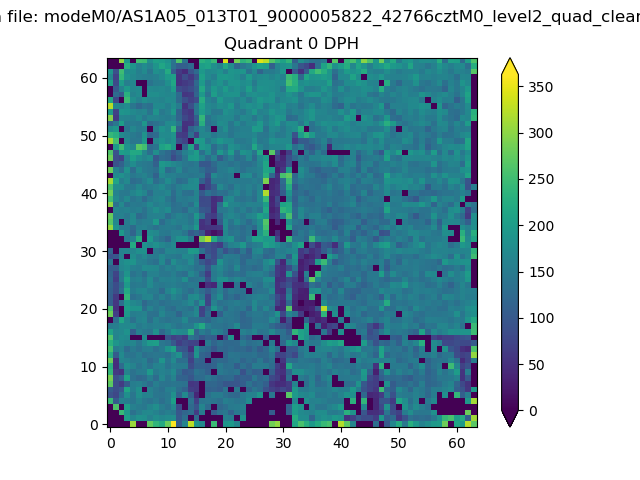 |
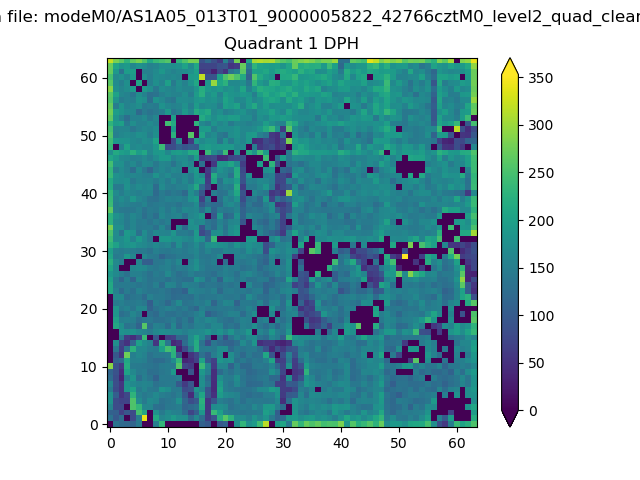 |
Quadrant B |
|---|---|---|---|
| Quadrant D | 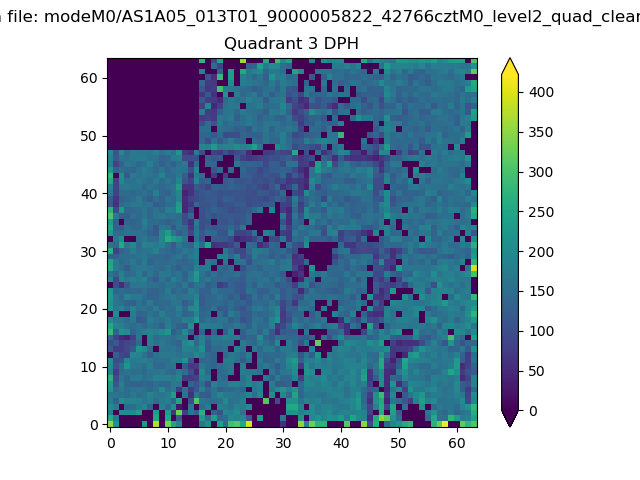 |
 |
Quadrant C |
| Plot type | Count rate plots | Images |
|---|---|---|
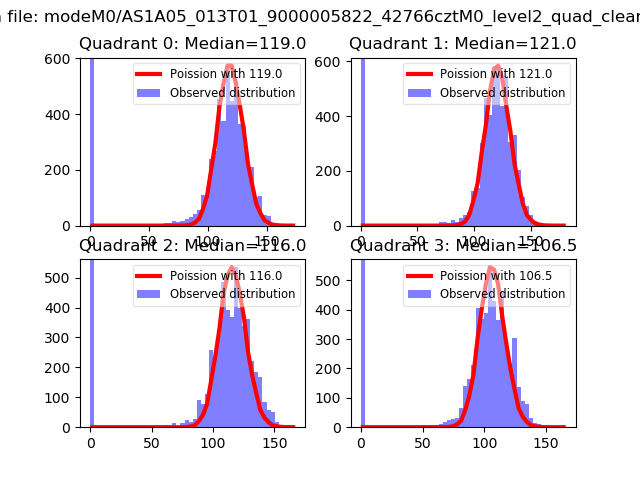
| Comparison with Poisson distribution Blue bars denote a histogram of data divided into 1 sec bins. Red curve is a Poisson curve with rate = median count rate of data. |
 |
 |
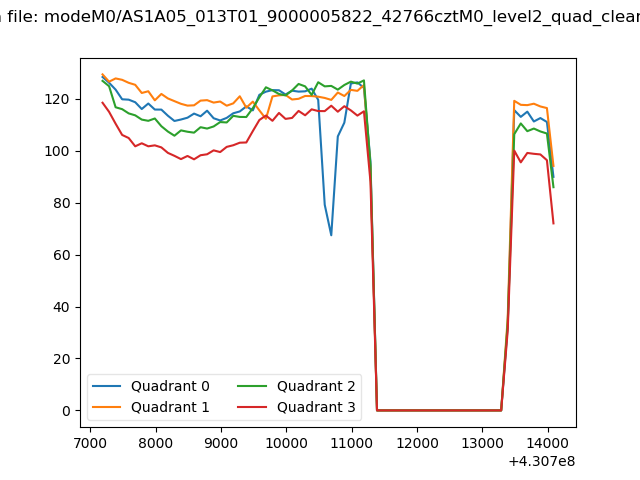
| Quadrant-wise count rates Data is divided into 100 sec bins |
 |
|
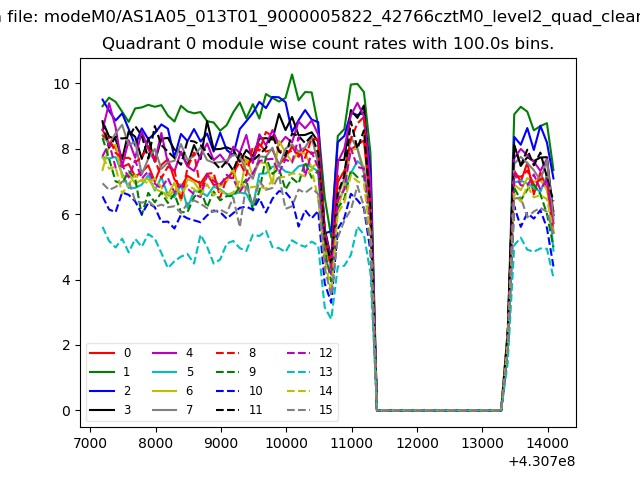
| Module-wise count rates for Quadrant A Data is divided into 100 sec bins |
 |
 |
| Module-wise count rates for Quadrant B Data is divided into 100 sec bins |
 |
 |
| Module-wise count rates for Quadrant C Data is divided into 100 sec bins |
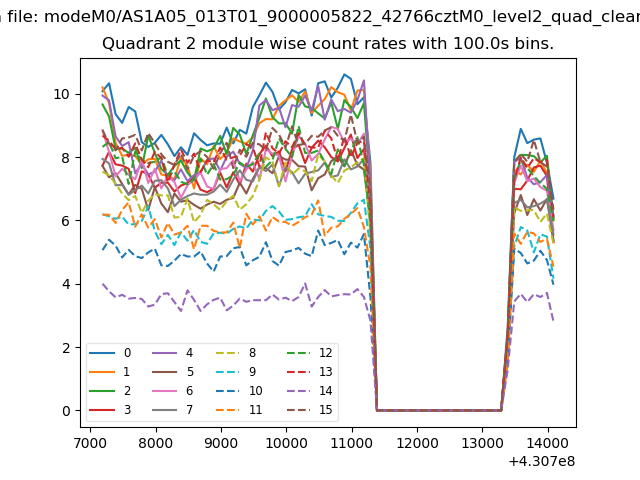 |
 |
| Module-wise count rates for Quadrant D Data is divided into 100 sec bins |
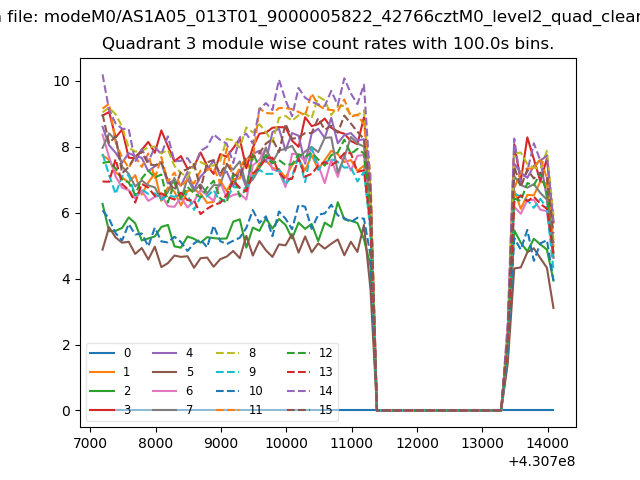 |
 |
| Parameter | Plot |
|---|---|
| CZT HV Monitor | 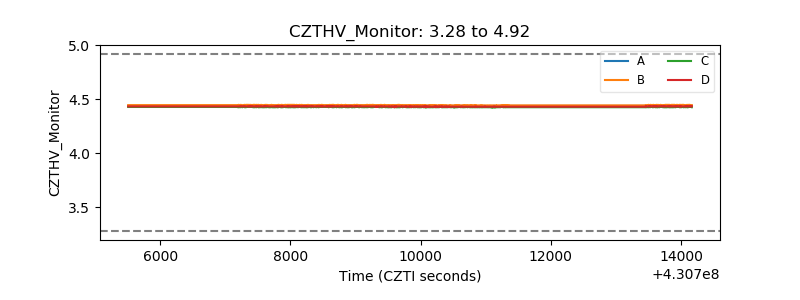 |
| D_VDD | 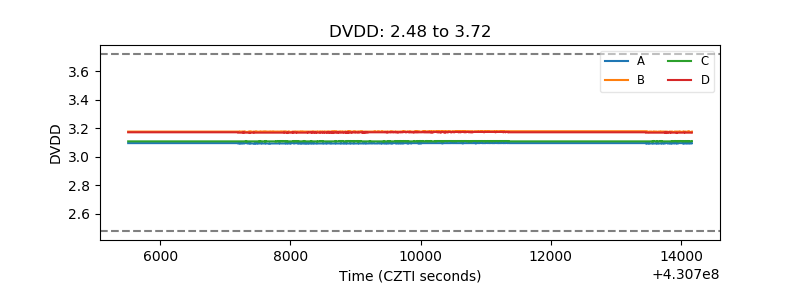 |
| Temperature 1 | 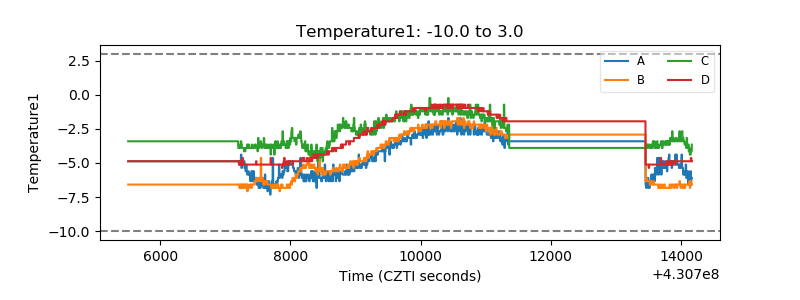 |
| Veto HV Monitor | 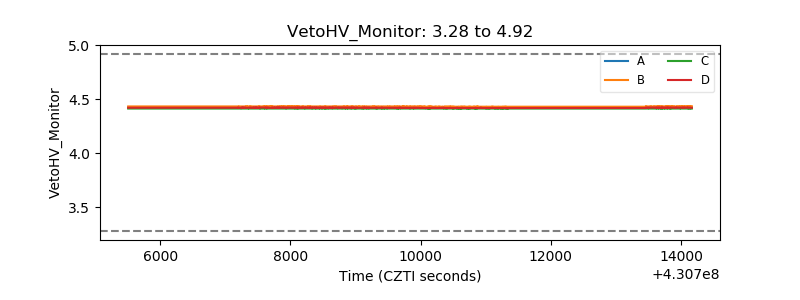 |
| Veto LLD | 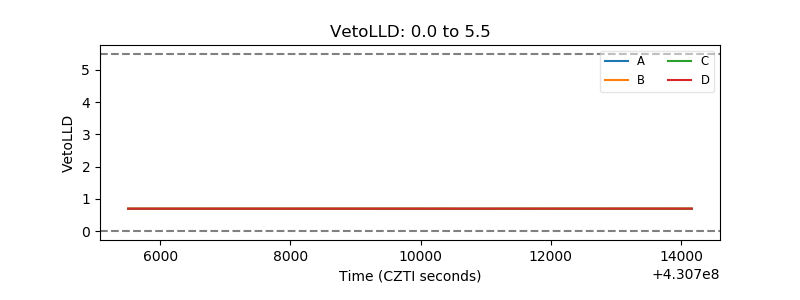 |
| Alpha Counter | 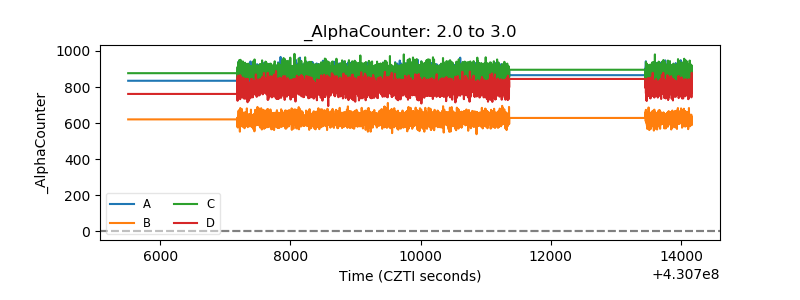 |
| _CPM_Rate | 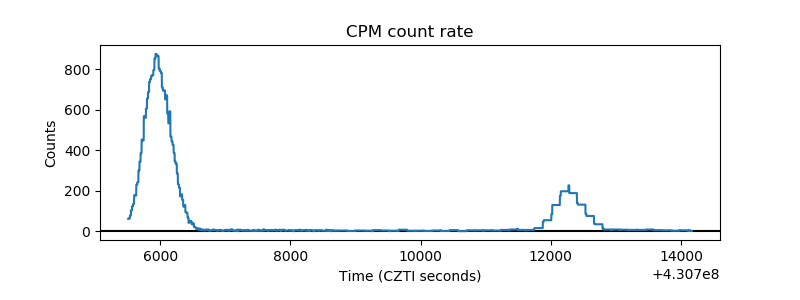 |
| CZT Counter | 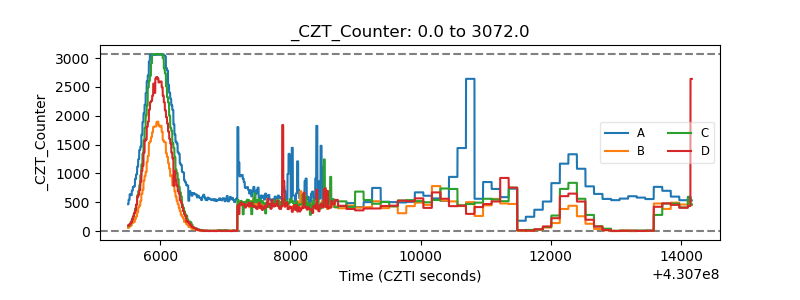 |
| +2.5 Volts monitor | 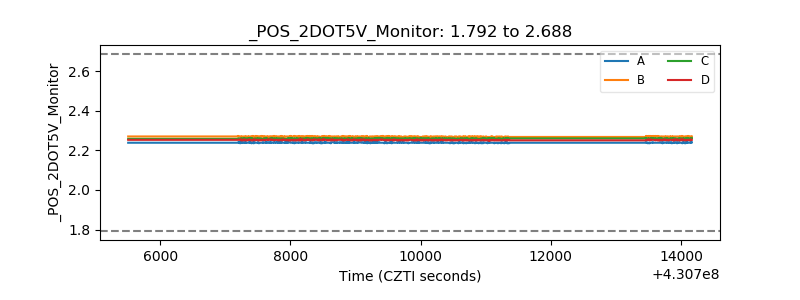 |
| +5 Volts monitor | 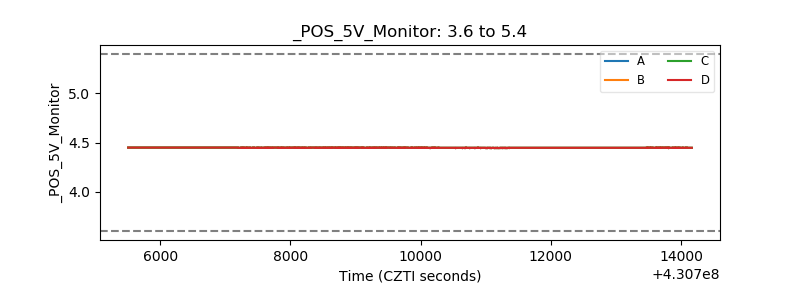 |
| _ROLL_ROT | 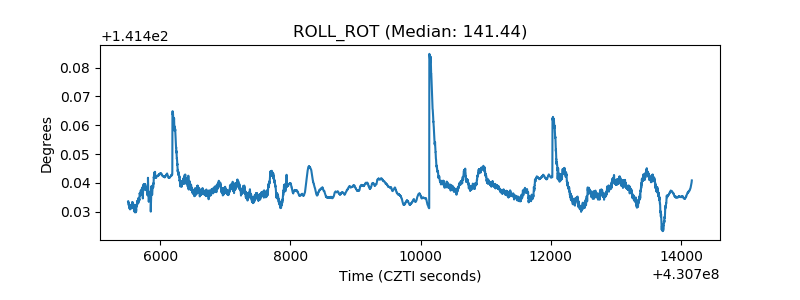 |
| _Roll_DEC | 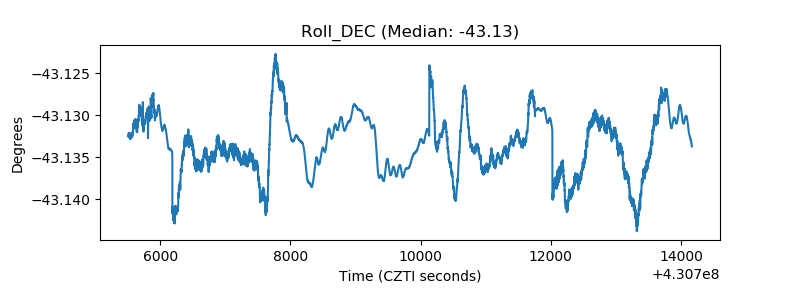 |
| _Roll_RA | 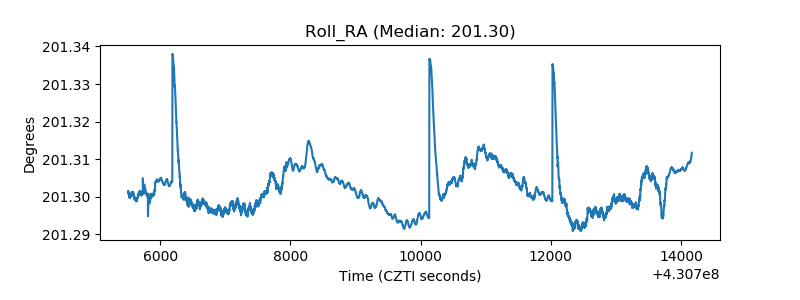 |
| Veto Counter | 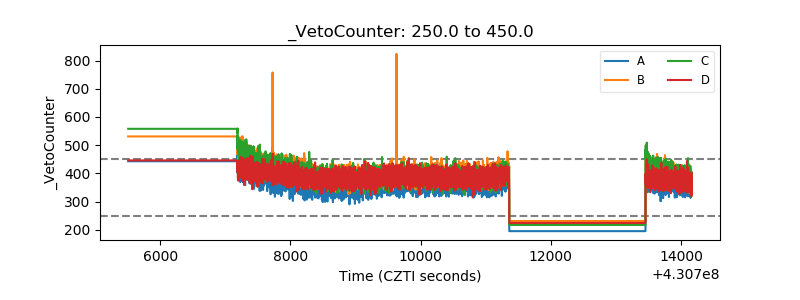 |