| Param | Original file | Final file |
|---|---|---|
| Filename | modeM0/AS1A05_013T01_9000005822_42767cztM0_level2.fits | modeM0/AS1A05_013T01_9000005822_42767cztM0_level2_quad_clean.evt |
| Size (bytes) | 342,247,680 | 91,414,080 |
| Size | 326.4 MB | 87.2 MB |
| Events in quadrant A | 4,104,069 | 591,369 |
| Events in quadrant B | 2,523,181 | 629,575 |
| Events in quadrant C | 2,712,175 | 607,890 |
| Events in quadrant D | 2,905,388 | 557,848 |
| Mode M0 | |||
|---|---|---|---|
| Quadrant | BADHDUFLAG | Total packets | Discarded packets |
| A | 0 | 15489 | 2 |
| B | 0 | 11235 | 2 |
| C | 0 | 11329 | 2 |
| D | 0 | 12393 | 2 |
| Mode M9 | |||
|---|---|---|---|
| Quadrant | BADHDUFLAG | Total packets | Discarded packets |
| A | 0 | 37 | 0 |
| B | 0 | 38 | 0 |
| C | 0 | 38 | 0 |
| D | 0 | 38 | 0 |
| Mode SS | |||
|---|---|---|---|
| Quadrant | BADHDUFLAG | Total packets | Discarded packets |
| A | 0 | 112 | 0 |
| B | 0 | 112 | 0 |
| C | 0 | 112 | 0 |
| D | 0 | 112 | 0 |
| Quadrant | Total seconds | Saturated seconds | Saturation percentage |
|---|---|---|---|
| A | 5443 | 345 | 6.338416% |
| B | 5443 | 24 | 0.440933% |
| C | 5443 | 19 | 0.349072% |
| D | 5443 | 80 | 1.469778% |
Noise dominated data is calculated using 1-second bins in cleaned event files. If a bin has >2000 counts, and if more than 50% of those come from <1% of pixels, then it is considered to be noise-dominated and hence unusable.
| Quadrant | # 1 sec bins | Bins with >0 counts | Bins with >2000 counts | High rate bins dominated by noise | Noise dominated (total time) | Noise dominated (detector-on time) | Marked lightcurve |
|---|---|---|---|---|---|---|---|
| A | 7296 | 5444 | 299 | 299 | 4.10% | 5.49% | 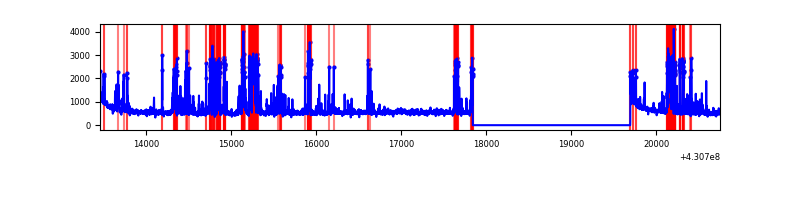 |
| B | 7296 | 5444 | 14 | 14 | 0.19% | 0.26% | 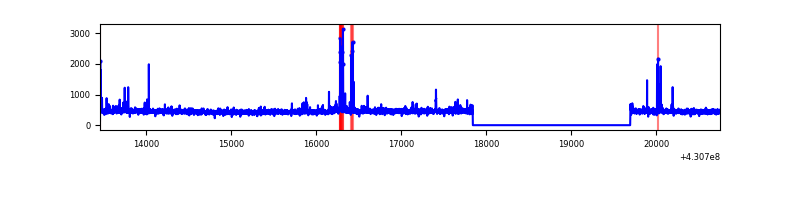 |
| C | 7296 | 5444 | 13 | 13 | 0.18% | 0.24% | 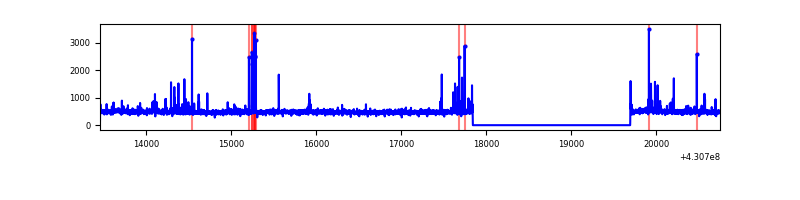 |
| D | 7296 | 5444 | 68 | 68 | 0.93% | 1.25% | 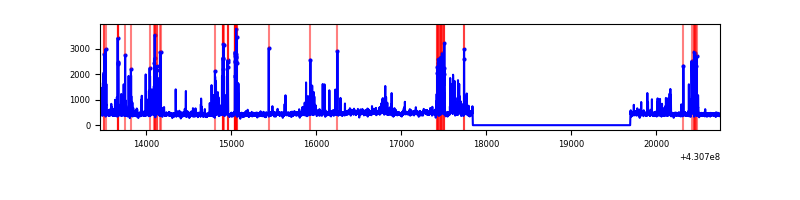 |
Top three noisy pixels from each quadrant. If the there are fewer than three noisy pixels in the level2.evt file, extra rows are filled as -1
| Pixel properties | Quadrant properties | ||||||
|---|---|---|---|---|---|---|---|
| Quadrant | DetID | PixID | Counts | Sigma | Mean | Median | Sigma |
| A | 15 | 223 | 865250 | 7067.26 | 597 | 585 | 122.3 |
| A | 10 | 83 | 570937 | 4661.72 | 597 | 585 | 122.3 |
| A | 13 | 248 | 317543 | 2590.63 | 597 | 585 | 122.3 |
| B | 15 | 85 | 51584 | 435.36 | 601 | 585 | 117.1 |
| B | 5 | 172 | 42961 | 361.75 | 601 | 585 | 117.1 |
| B | 0 | 230 | 25334 | 211.27 | 601 | 585 | 117.1 |
| C | 15 | 214 | 227780 | 1638.52 | 597 | 602 | 138.6 |
| C | 14 | 254 | 94433 | 676.76 | 597 | 602 | 138.6 |
| C | 0 | 207 | 52115 | 371.54 | 597 | 602 | 138.6 |
| D | 2 | 249 | 308316 | 2116.76 | 596 | 578 | 145.4 |
| D | 12 | 233 | 134575 | 921.69 | 596 | 578 | 145.4 |
| D | 12 | 6 | 64814 | 441.84 | 596 | 578 | 145.4 |
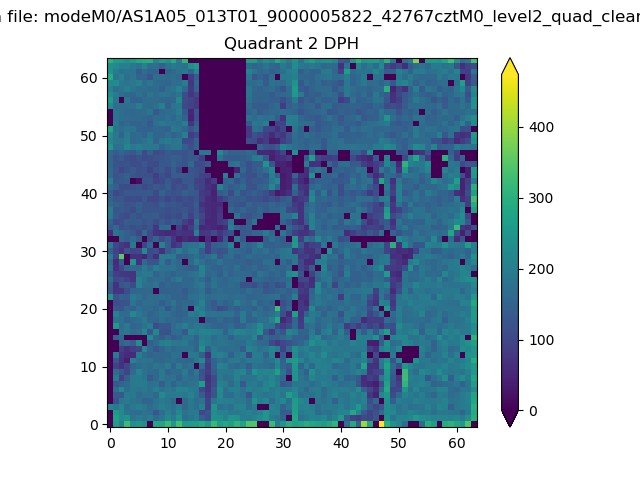
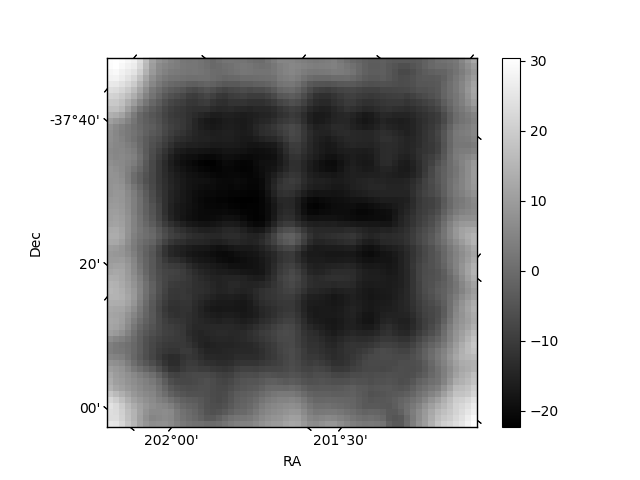
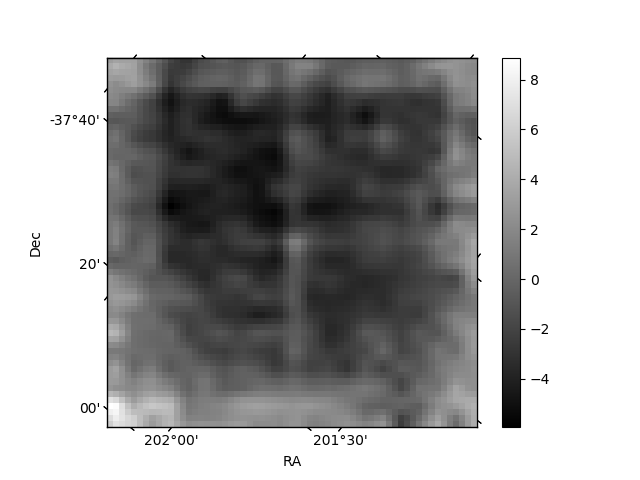
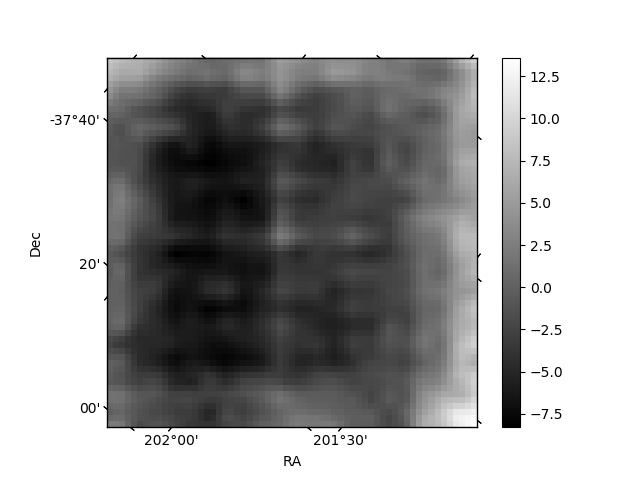
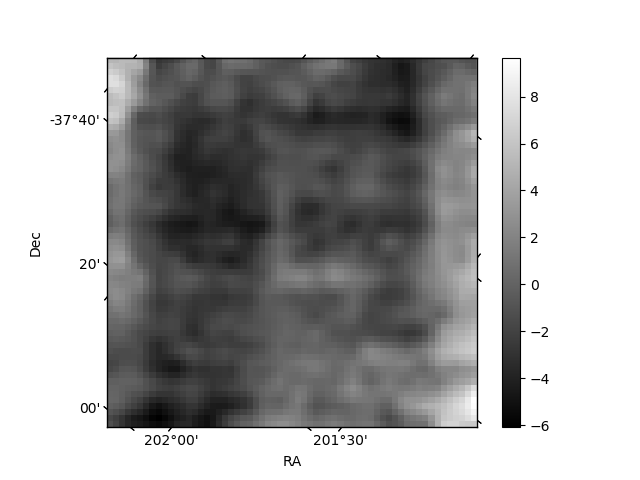
Histogram calculated using DETX and DETY for each event in the final _common_clean file
| Quadrant A | 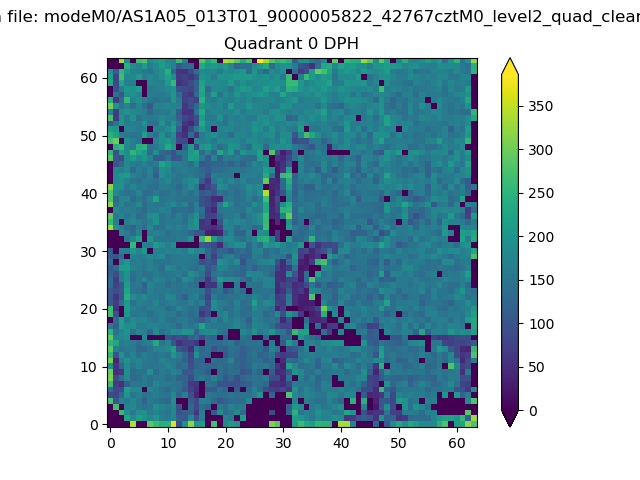 |
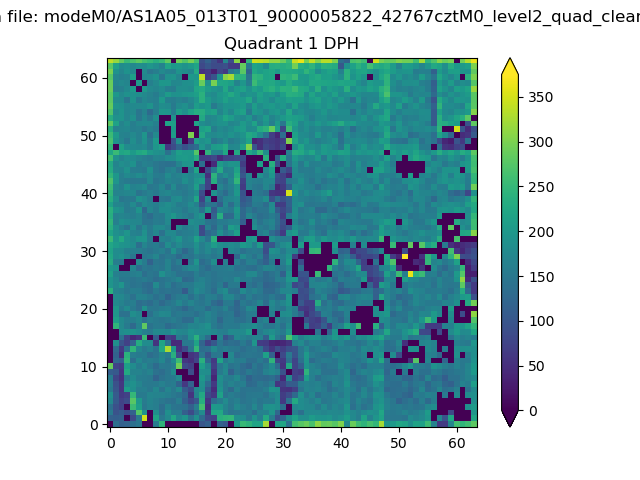 |
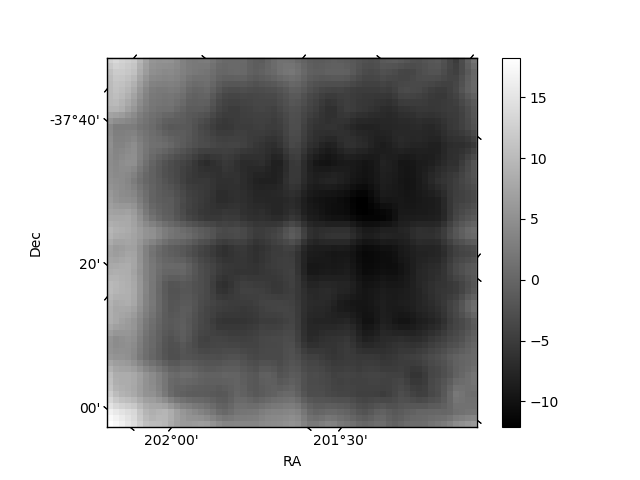
Quadrant B |
|---|---|---|---|
| Quadrant D | 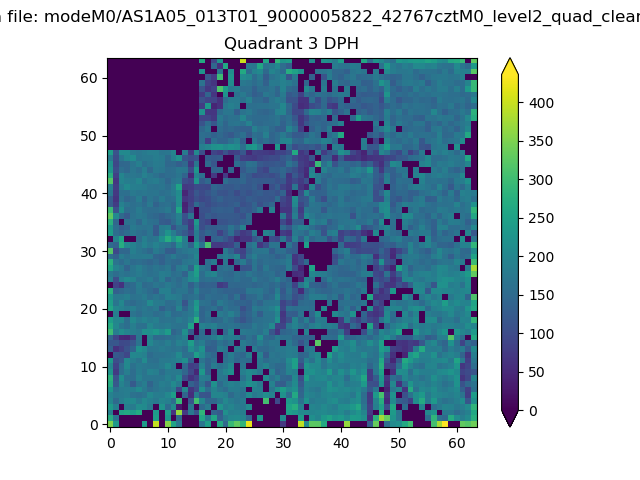 |
 |
Quadrant C |
| Plot type | Count rate plots | Images |
|---|---|---|
| Comparison with Poisson distribution Blue bars denote a histogram of data divided into 1 sec bins. Red curve is a Poisson curve with rate = median count rate of data. |
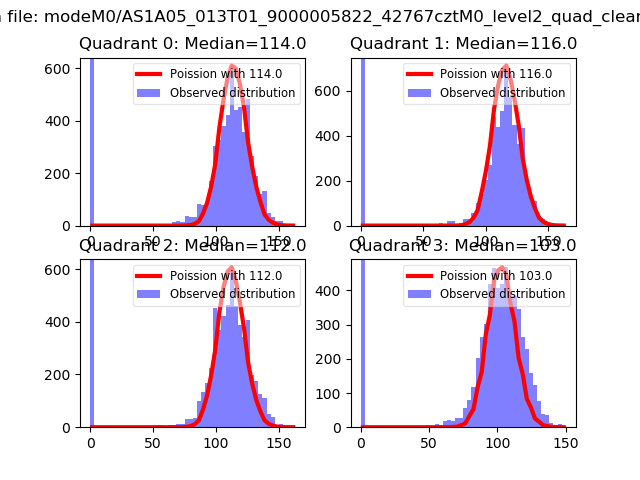 |
 |
| Quadrant-wise count rates Data is divided into 100 sec bins |
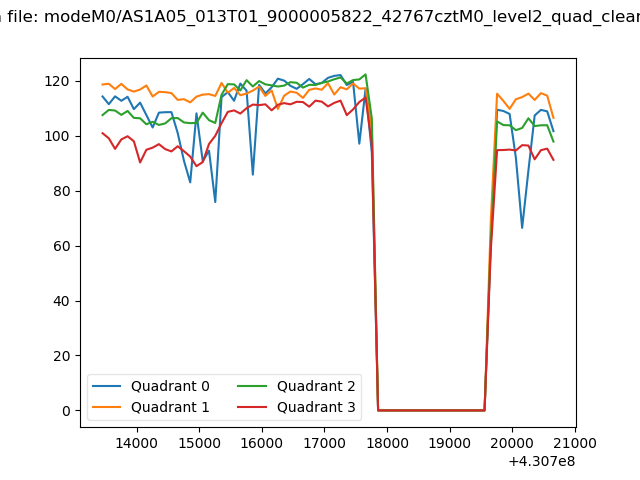 |
|
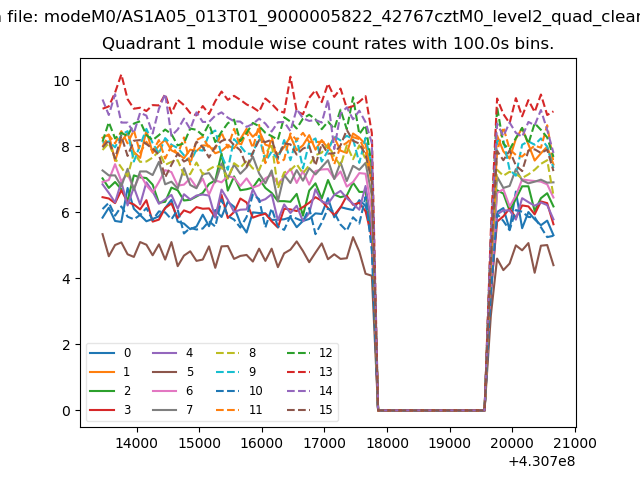
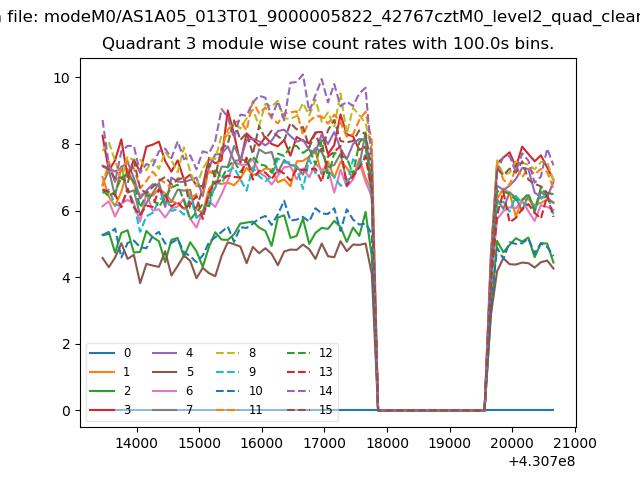
| Module-wise count rates for Quadrant A Data is divided into 100 sec bins |
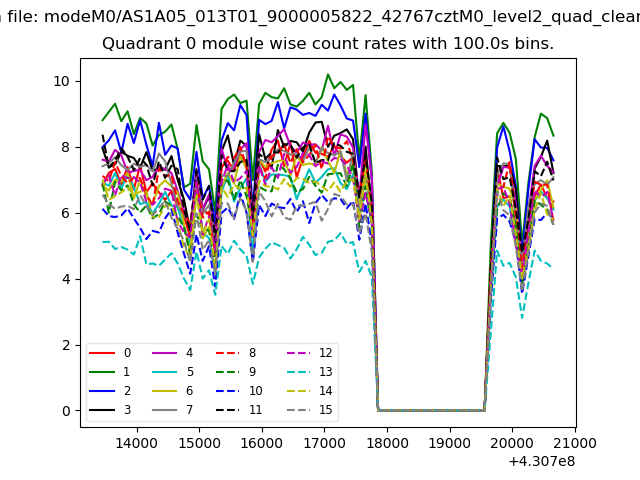 |
 |
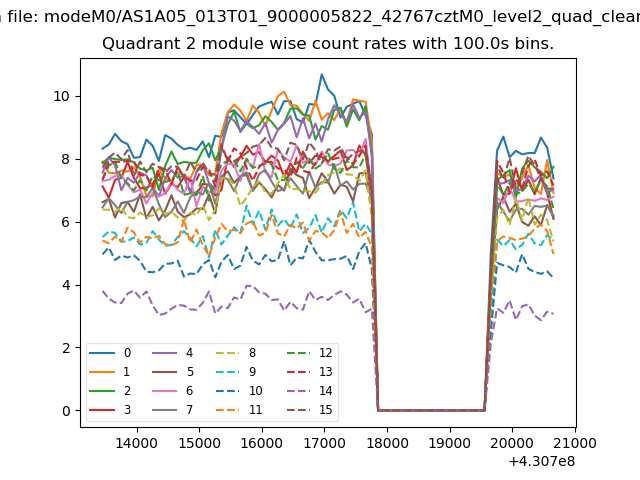
| Module-wise count rates for Quadrant B Data is divided into 100 sec bins |
 |
 |
| Module-wise count rates for Quadrant C Data is divided into 100 sec bins |
 |
 |
| Module-wise count rates for Quadrant D Data is divided into 100 sec bins |
 |
 |
| Parameter | Plot |
|---|---|
| CZT HV Monitor | 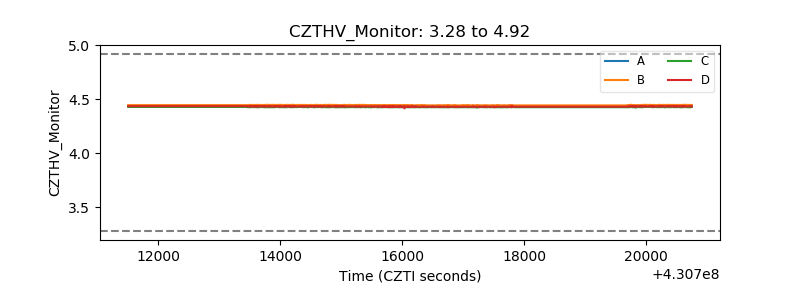 |
| D_VDD | 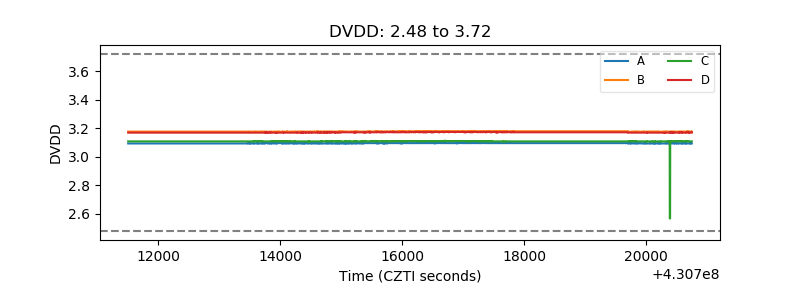 |
| Temperature 1 | 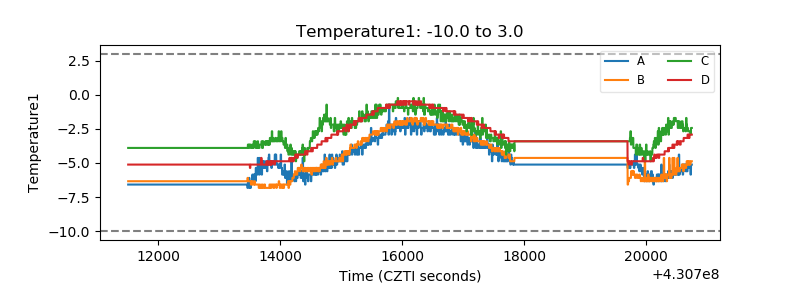 |
| Veto HV Monitor | 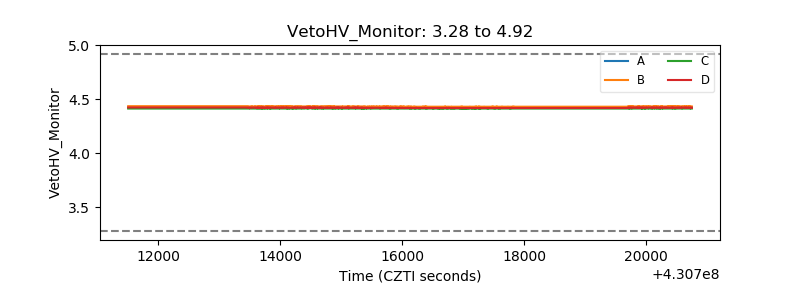 |
| Veto LLD | 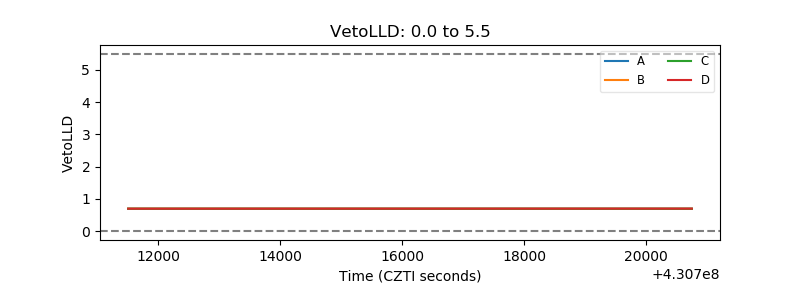 |
| Alpha Counter | 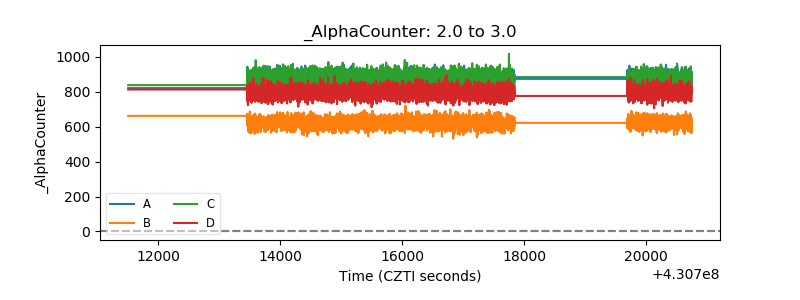 |
| _CPM_Rate | 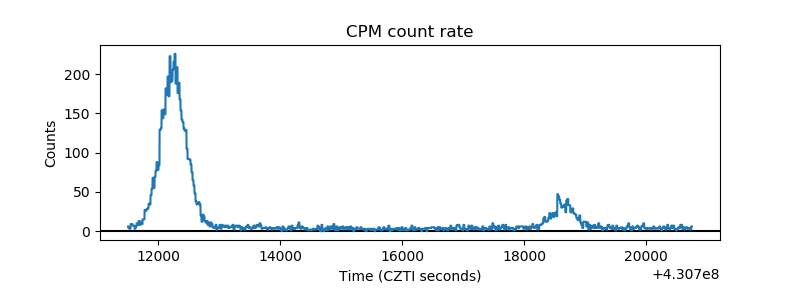 |
| CZT Counter | 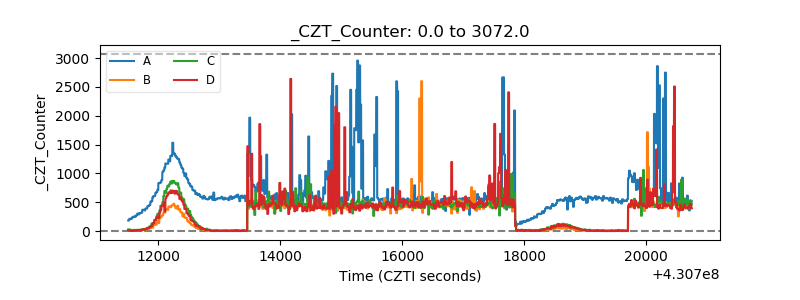 |
| +2.5 Volts monitor |  |
| +5 Volts monitor | 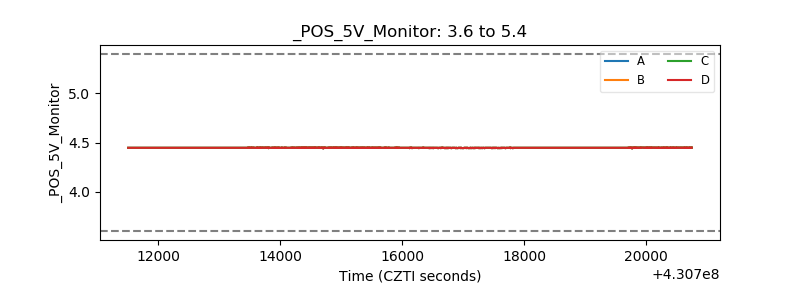 |
| _ROLL_ROT | 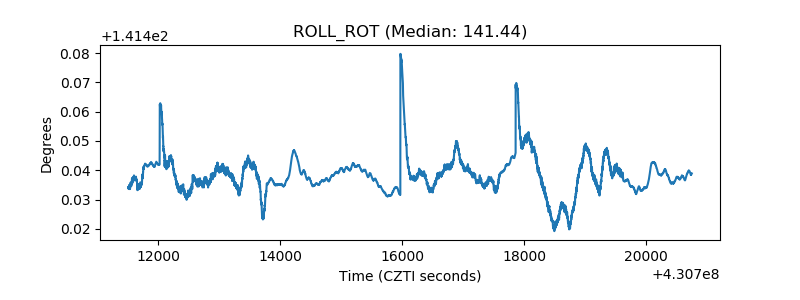 |
| _Roll_DEC | 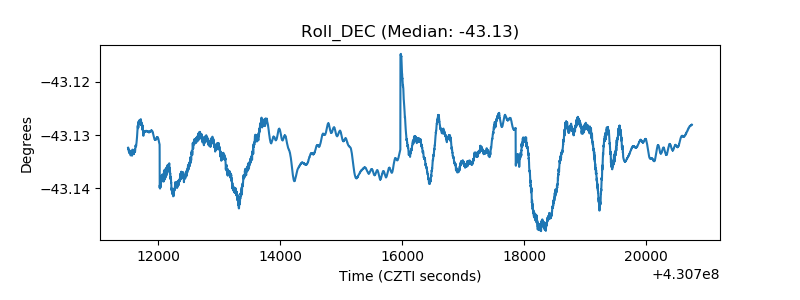 |
| _Roll_RA | 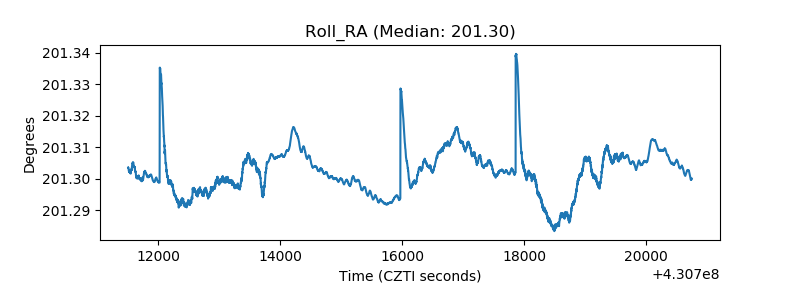 |
| Veto Counter | 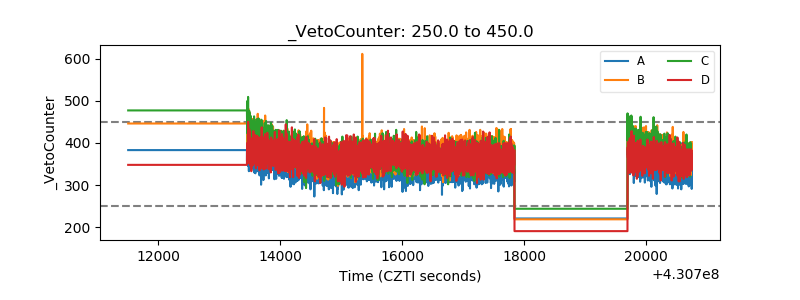 |