| Param | Original file | Final file |
|---|---|---|
| Filename | modeM0/AS1A05_013T01_9000005822_42769cztM0_level2.fits | modeM0/AS1A05_013T01_9000005822_42769cztM0_level2_quad_clean.evt |
| Size (bytes) | 338,976,000 | 98,066,880 |
| Size | 323.3 MB | 93.5 MB |
| Events in quadrant A | 3,535,995 | 649,281 |
| Events in quadrant B | 2,623,697 | 658,320 |
| Events in quadrant C | 2,980,352 | 652,612 |
| Events in quadrant D | 2,952,677 | 601,485 |
| Mode M0 | |||
|---|---|---|---|
| Quadrant | BADHDUFLAG | Total packets | Discarded packets |
| A | 0 | 13860 | 1 |
| B | 0 | 11921 | 1 |
| C | 0 | 12470 | 1 |
| D | 0 | 12824 | 1 |
| Mode M9 | |||
|---|---|---|---|
| Quadrant | BADHDUFLAG | Total packets | Discarded packets |
| A | 0 | 14 | 0 |
| B | 0 | 14 | 0 |
| C | 0 | 14 | 0 |
| D | 0 | 14 | 0 |
| Mode SS | |||
|---|---|---|---|
| Quadrant | BADHDUFLAG | Total packets | Discarded packets |
| A | 0 | 116 | 0 |
| B | 0 | 116 | 0 |
| C | 0 | 116 | 0 |
| D | 0 | 116 | 0 |
| Quadrant | Total seconds | Saturated seconds | Saturation percentage |
|---|---|---|---|
| A | 5842 | 113 | 1.934269% |
| B | 5843 | 11 | 0.188259% |
| C | 5843 | 32 | 0.547664% |
| D | 5843 | 60 | 1.026870% |
Noise dominated data is calculated using 1-second bins in cleaned event files. If a bin has >2000 counts, and if more than 50% of those come from <1% of pixels, then it is considered to be noise-dominated and hence unusable.
| Quadrant | # 1 sec bins | Bins with >0 counts | Bins with >2000 counts | High rate bins dominated by noise | Noise dominated (total time) | Noise dominated (detector-on time) | Marked lightcurve |
|---|---|---|---|---|---|---|---|
| A | 7185 | 5843 | 90 | 90 | 1.25% | 1.54% | 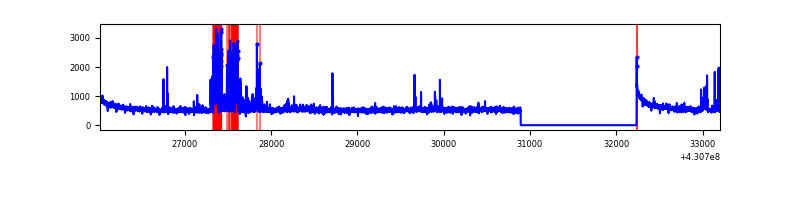 |
| B | 7186 | 5844 | 7 | 7 | 0.10% | 0.12% | 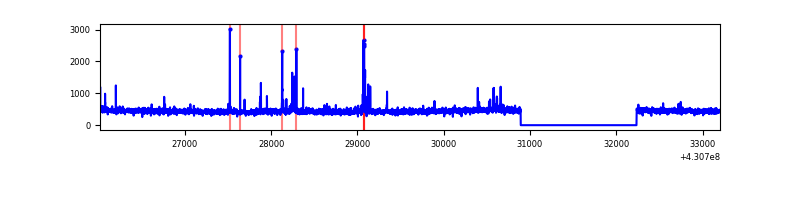 |
| C | 7186 | 5844 | 25 | 25 | 0.35% | 0.43% | 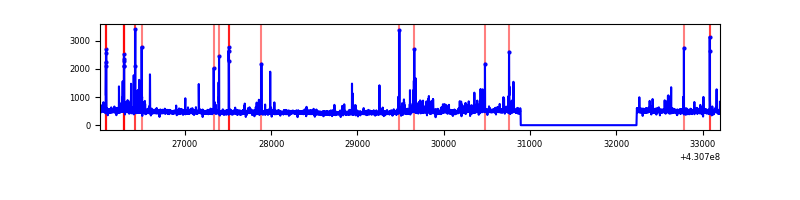 |
| D | 7186 | 5844 | 63 | 63 | 0.88% | 1.08% | 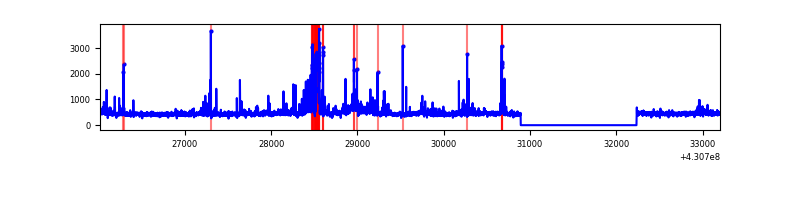 |
Top three noisy pixels from each quadrant. If the there are fewer than three noisy pixels in the level2.evt file, extra rows are filled as -1
| Pixel properties | Quadrant properties | ||||||
|---|---|---|---|---|---|---|---|
| Quadrant | DetID | PixID | Counts | Sigma | Mean | Median | Sigma |
| A | 10 | 83 | 589087 | 4435.79 | 648 | 633 | 132.7 |
| A | 13 | 248 | 382691 | 2879.97 | 648 | 633 | 132.7 |
| A | 12 | 189 | 35796 | 265.06 | 648 | 633 | 132.7 |
| B | 15 | 85 | 43835 | 343.74 | 641 | 623 | 125.7 |
| B | 5 | 172 | 22041 | 170.38 | 641 | 623 | 125.7 |
| B | 0 | 230 | 16676 | 127.7 | 641 | 623 | 125.7 |
| C | 15 | 214 | 245395 | 1646.57 | 635 | 639 | 148.6 |
| C | 14 | 254 | 182596 | 1224.1 | 635 | 639 | 148.6 |
| C | 0 | 207 | 66602 | 443.76 | 635 | 639 | 148.6 |
| D | 5 | 171 | 238295 | 1517.08 | 636 | 618 | 156.7 |
| D | 1 | 52 | 129041 | 819.72 | 636 | 618 | 156.7 |
| D | 5 | 70 | 34168 | 214.15 | 636 | 618 | 156.7 |
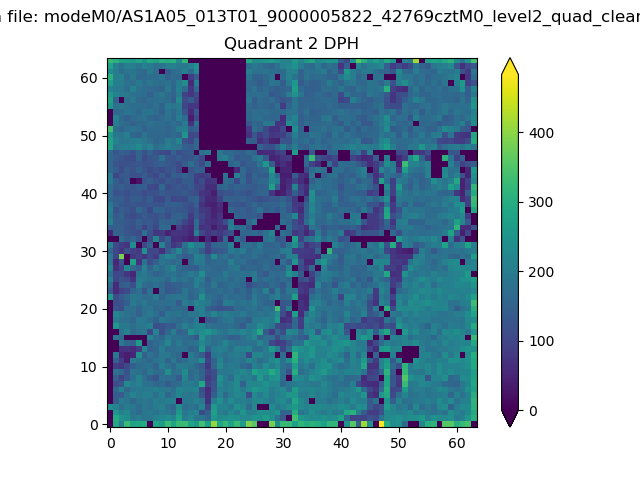
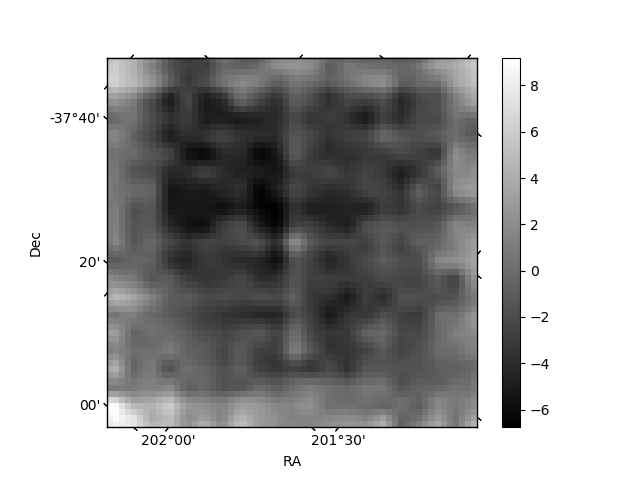
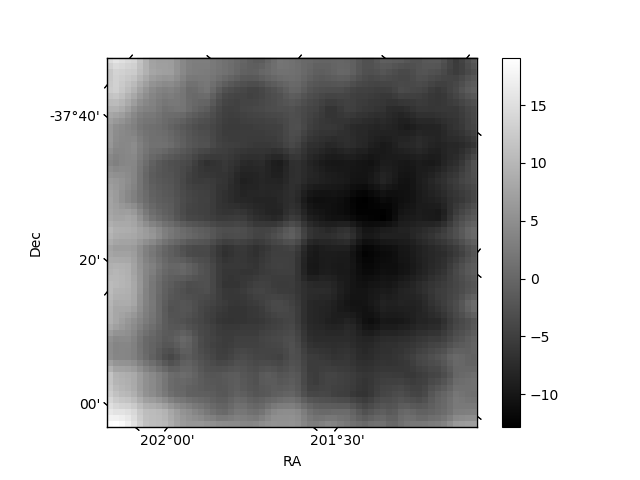
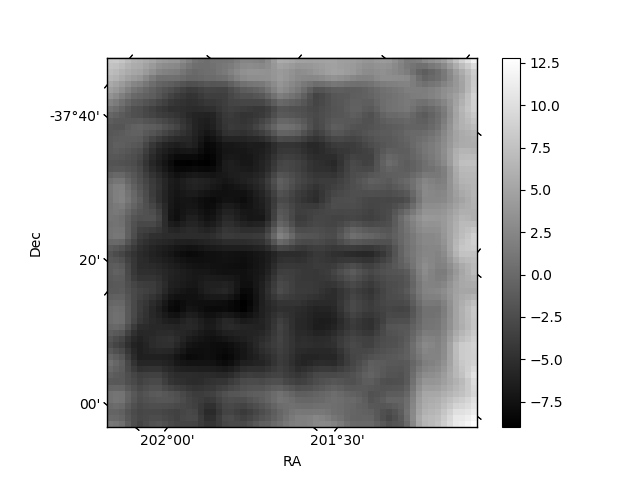
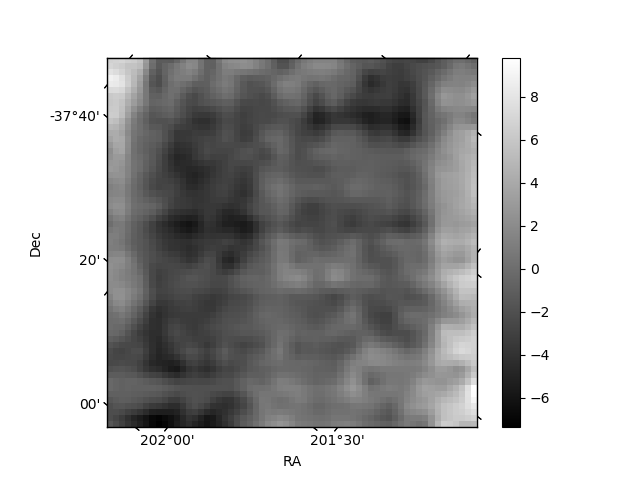
Histogram calculated using DETX and DETY for each event in the final _common_clean file
| Quadrant A | 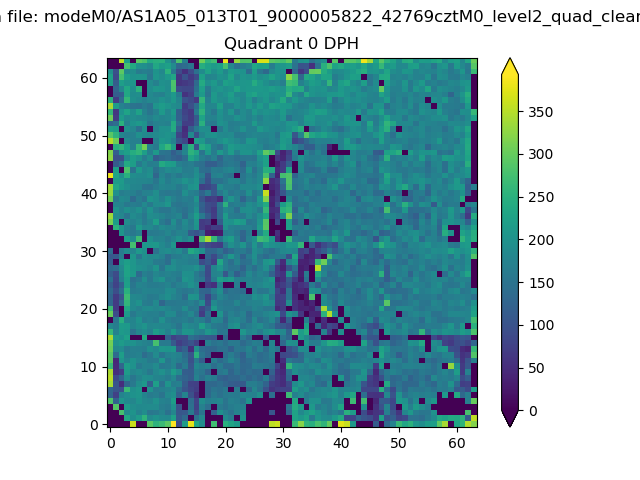 |
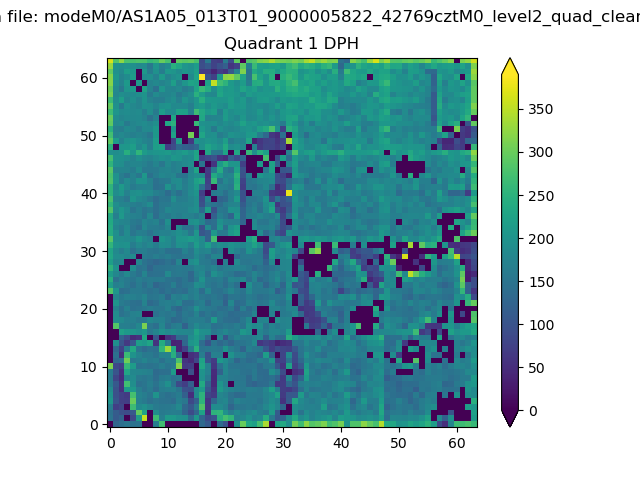 |
Quadrant B |
|---|---|---|---|
| Quadrant D | 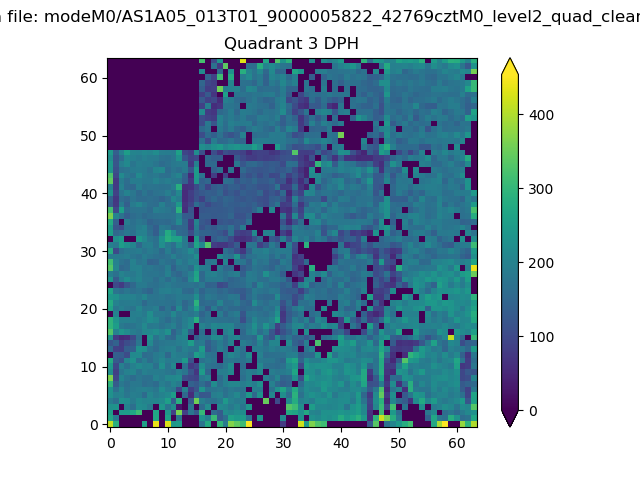 |
 |
Quadrant C |
| Plot type | Count rate plots | Images |
|---|---|---|
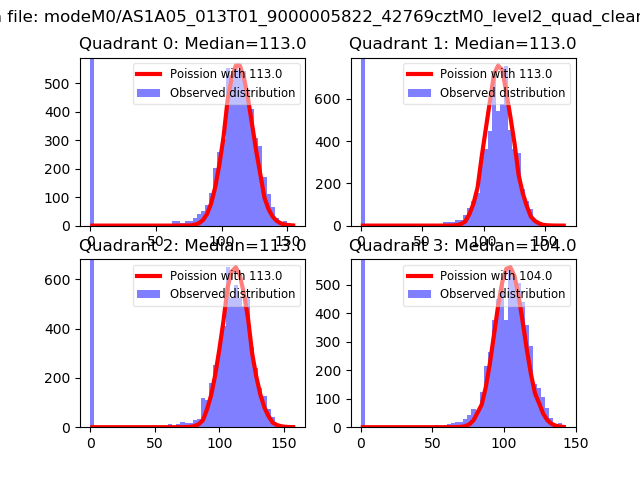
| Comparison with Poisson distribution Blue bars denote a histogram of data divided into 1 sec bins. Red curve is a Poisson curve with rate = median count rate of data. |
 |
 |
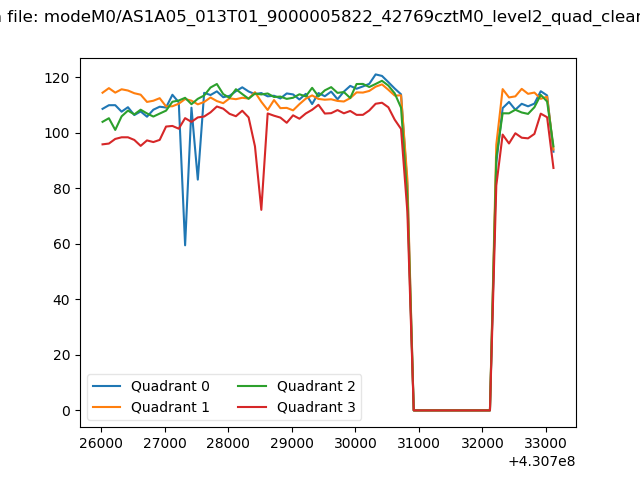
| Quadrant-wise count rates Data is divided into 100 sec bins |
 |
|
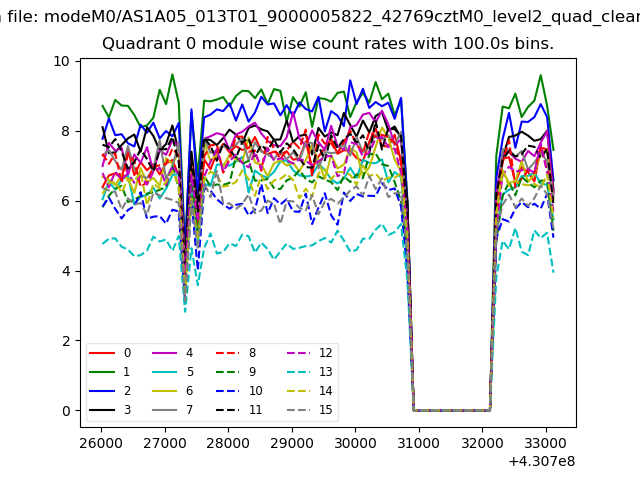
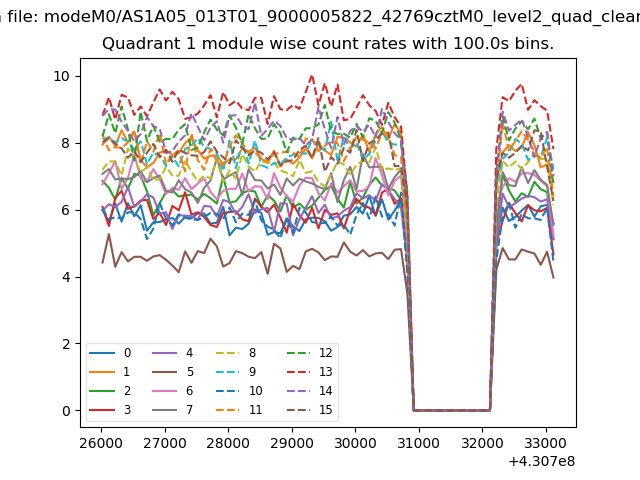
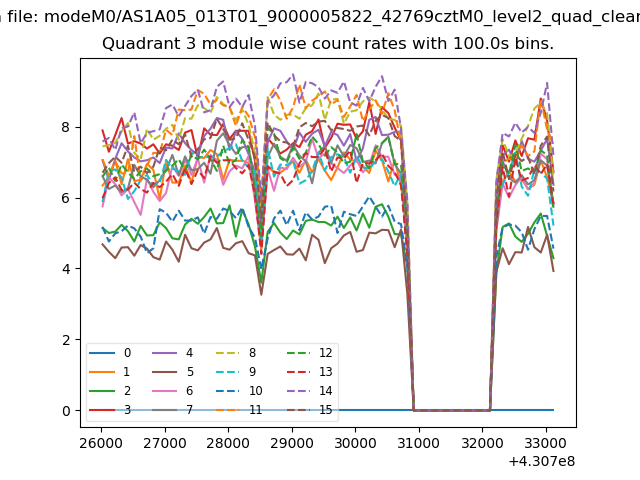
| Module-wise count rates for Quadrant A Data is divided into 100 sec bins |
 |
 |
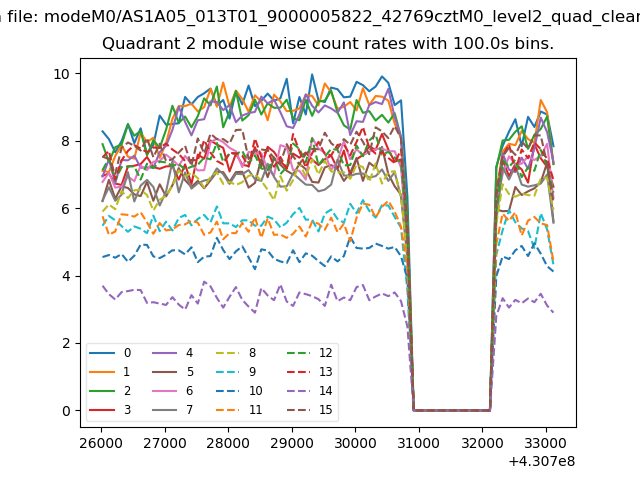
| Module-wise count rates for Quadrant B Data is divided into 100 sec bins |
 |
 |
| Module-wise count rates for Quadrant C Data is divided into 100 sec bins |
 |
 |
| Module-wise count rates for Quadrant D Data is divided into 100 sec bins |
 |
 |
| Parameter | Plot |
|---|---|
| CZT HV Monitor | 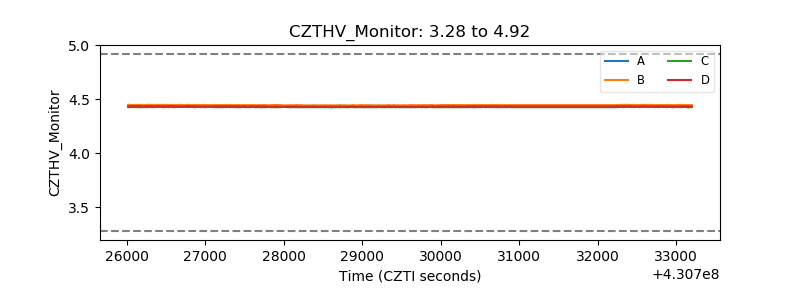 |
| D_VDD | 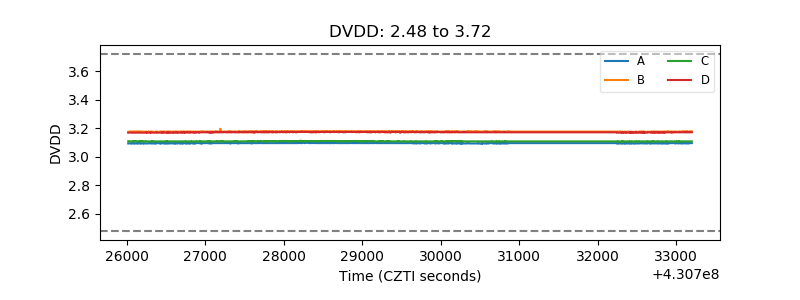 |
| Temperature 1 | 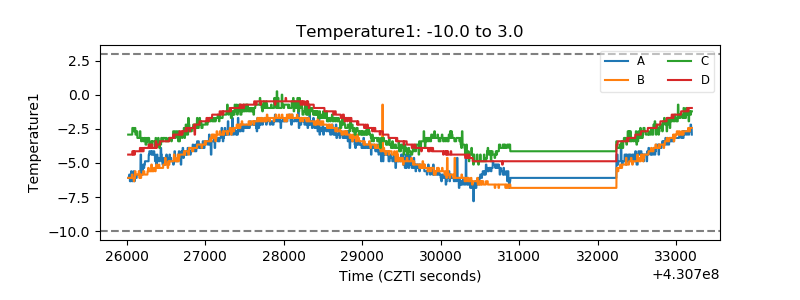 |
| Veto HV Monitor | 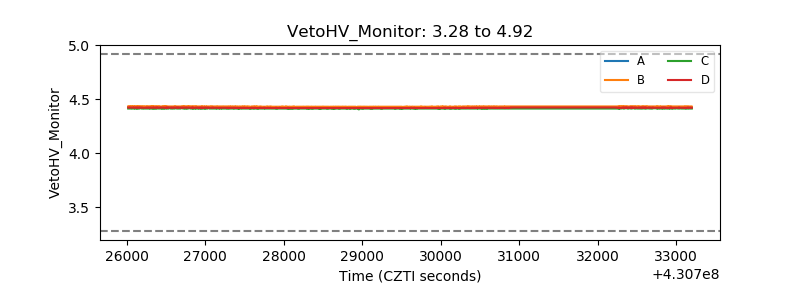 |
| Veto LLD | 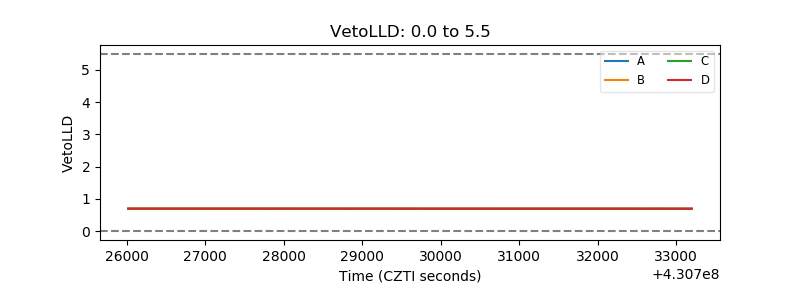 |
| Alpha Counter | 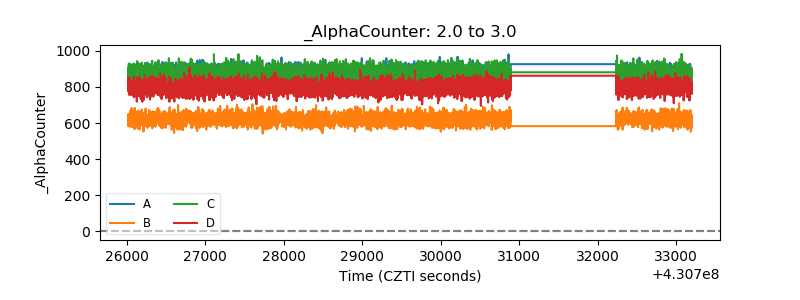 |
| _CPM_Rate | 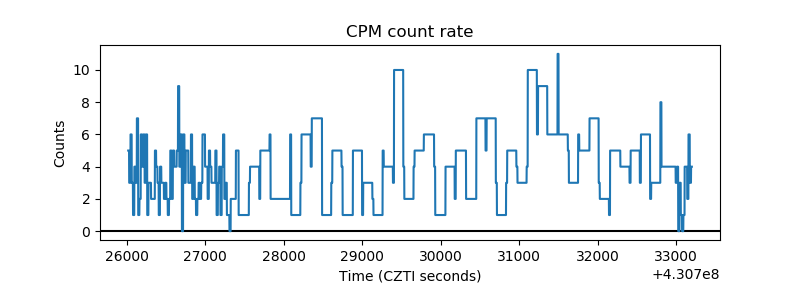 |
| CZT Counter | 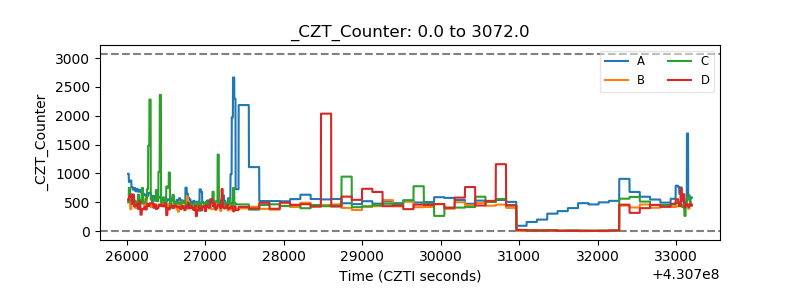 |
| +2.5 Volts monitor |  |
| +5 Volts monitor | 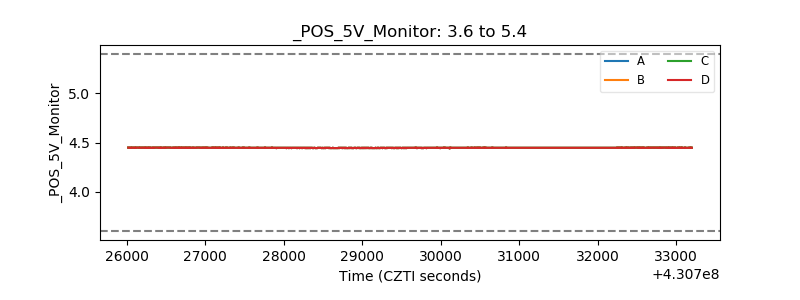 |
| _ROLL_ROT | 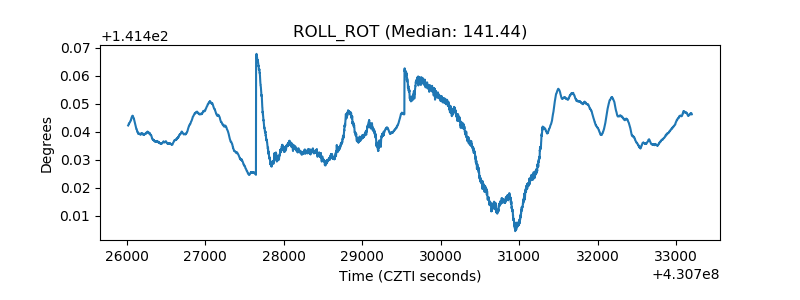 |
| _Roll_DEC | 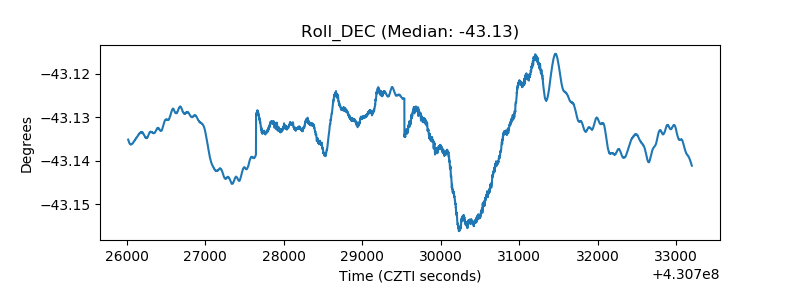 |
| _Roll_RA | 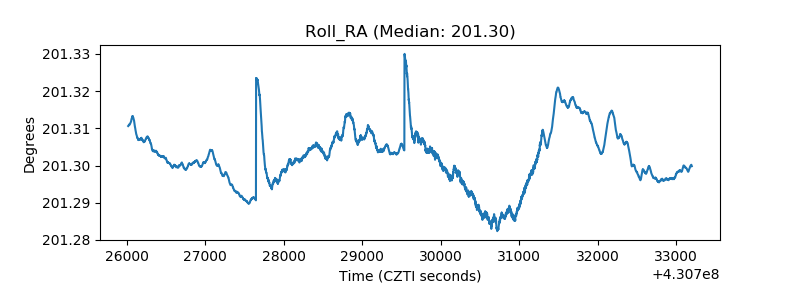 |
| Veto Counter | 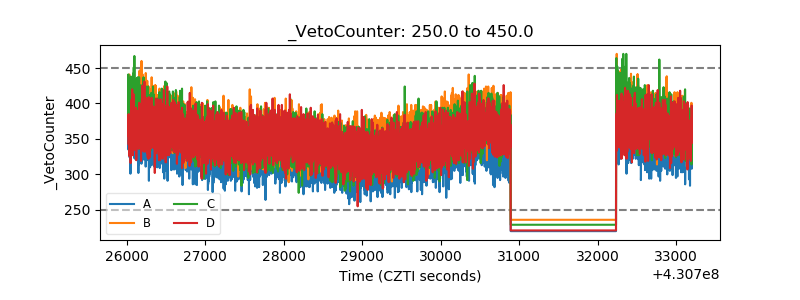 |