| Param | Original file | Final file |
|---|---|---|
| Filename | modeM0/AS1A05_013T01_9000005822_42770cztM0_level2.fits | modeM0/AS1A05_013T01_9000005822_42770cztM0_level2_quad_clean.evt |
| Size (bytes) | 360,357,120 | 101,338,560 |
| Size | 343.7 MB | 96.6 MB |
| Events in quadrant A | 3,586,669 | 677,145 |
| Events in quadrant B | 2,719,241 | 676,026 |
| Events in quadrant C | 3,051,116 | 676,601 |
| Events in quadrant D | 3,511,570 | 616,692 |
| Mode M0 | |||
|---|---|---|---|
| Quadrant | BADHDUFLAG | Total packets | Discarded packets |
| A | 0 | 14159 | 2 |
| B | 0 | 12311 | 2 |
| C | 0 | 12755 | 3 |
| D | 0 | 14638 | 2 |
| Mode M9 | |||
|---|---|---|---|
| Quadrant | BADHDUFLAG | Total packets | Discarded packets |
| A | 0 | 13 | 0 |
| B | 0 | 14 | 0 |
| C | 0 | 14 | 0 |
| D | 0 | 14 | 0 |
| Mode SS | |||
|---|---|---|---|
| Quadrant | BADHDUFLAG | Total packets | Discarded packets |
| A | 0 | 122 | 0 |
| B | 0 | 122 | 0 |
| C | 0 | 122 | 0 |
| D | 0 | 122 | 0 |
| Quadrant | Total seconds | Saturated seconds | Saturation percentage |
|---|---|---|---|
| A | 6046 | 64 | 1.058551% |
| B | 6046 | 24 | 0.396957% |
| C | 6045 | 29 | 0.479735% |
| D | 6045 | 179 | 2.961125% |
Noise dominated data is calculated using 1-second bins in cleaned event files. If a bin has >2000 counts, and if more than 50% of those come from <1% of pixels, then it is considered to be noise-dominated and hence unusable.
| Quadrant | # 1 sec bins | Bins with >0 counts | Bins with >2000 counts | High rate bins dominated by noise | Noise dominated (total time) | Noise dominated (detector-on time) | Marked lightcurve |
|---|---|---|---|---|---|---|---|
| A | 7329 | 6047 | 47 | 47 | 0.64% | 0.78% | 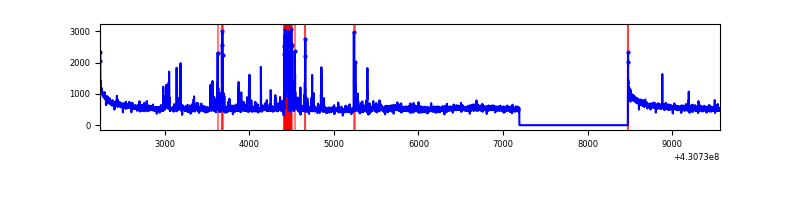 |
| B | 7329 | 6047 | 12 | 12 | 0.16% | 0.20% | 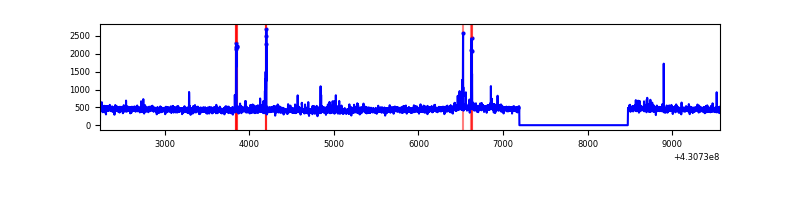 |
| C | 7328 | 6046 | 22 | 22 | 0.30% | 0.36% | 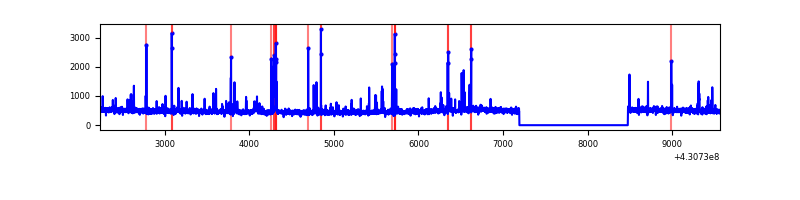 |
| D | 7328 | 6046 | 194 | 194 | 2.65% | 3.21% | 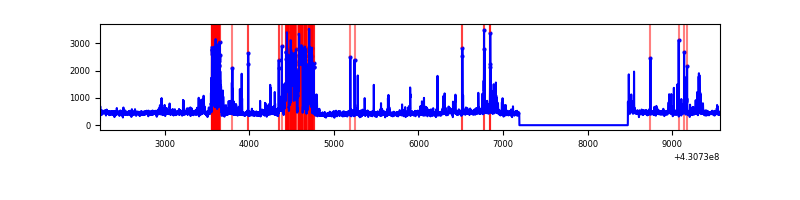 |
Top three noisy pixels from each quadrant. If the there are fewer than three noisy pixels in the level2.evt file, extra rows are filled as -1
| Pixel properties | Quadrant properties | ||||||
|---|---|---|---|---|---|---|---|
| Quadrant | DetID | PixID | Counts | Sigma | Mean | Median | Sigma |
| A | 10 | 83 | 634936 | 4564.82 | 675 | 661 | 138.9 |
| A | 13 | 248 | 223618 | 1604.6 | 675 | 661 | 138.9 |
| A | 2 | 79 | 69311 | 494.07 | 675 | 661 | 138.9 |
| B | 15 | 85 | 23450 | 178.11 | 661 | 643 | 128.0 |
| B | 5 | 172 | 21145 | 160.11 | 661 | 643 | 128.0 |
| B | 0 | 245 | 18606 | 140.28 | 661 | 643 | 128.0 |
| C | 15 | 214 | 251176 | 1632.19 | 657 | 662 | 153.5 |
| C | 14 | 254 | 152660 | 990.32 | 657 | 662 | 153.5 |
| C | 5 | 250 | 47487 | 305.08 | 657 | 662 | 153.5 |
| D | 5 | 171 | 507256 | 3168.14 | 657 | 640 | 159.9 |
| D | 12 | 217 | 179428 | 1118.06 | 657 | 640 | 159.9 |
| D | 2 | 249 | 137496 | 855.83 | 657 | 640 | 159.9 |
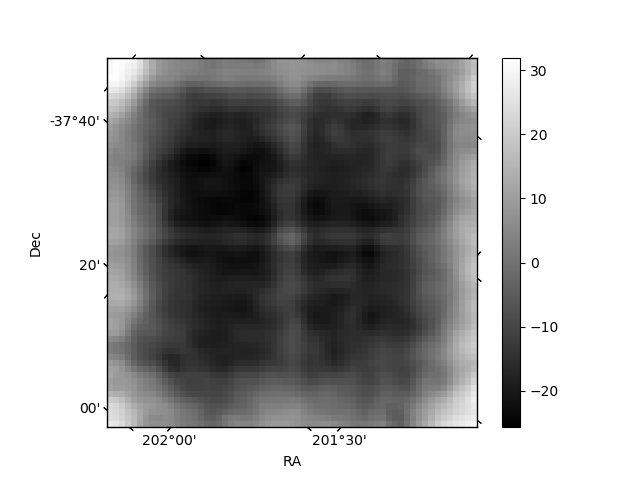
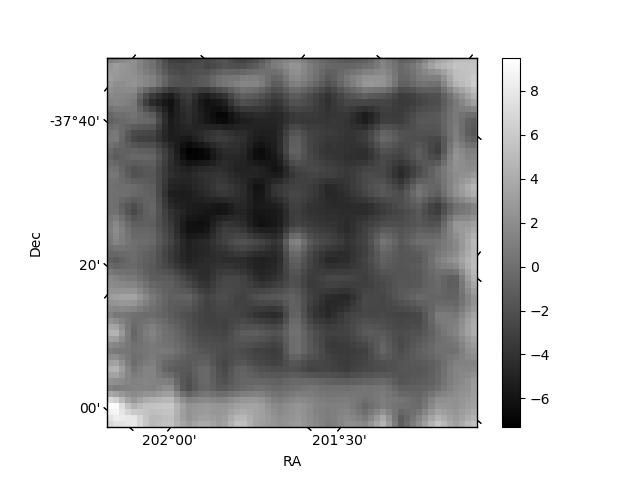
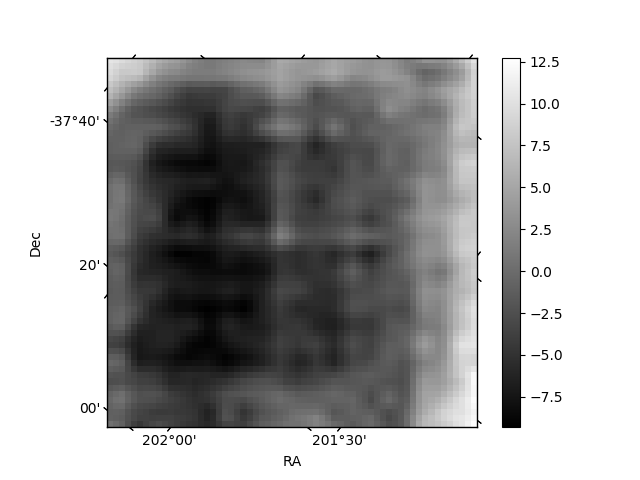
Histogram calculated using DETX and DETY for each event in the final _common_clean file
| Quadrant A | 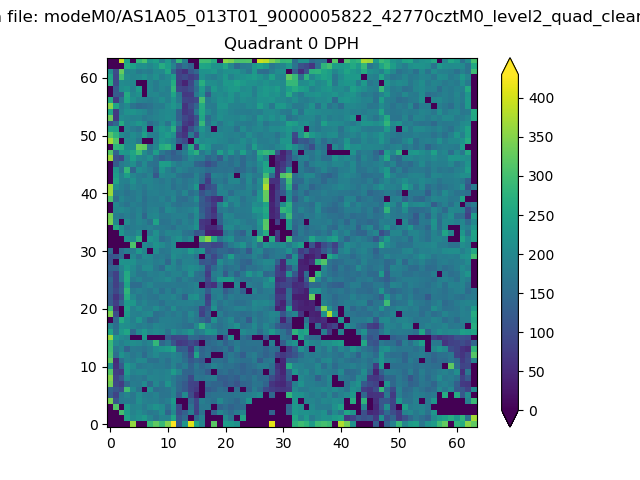 |
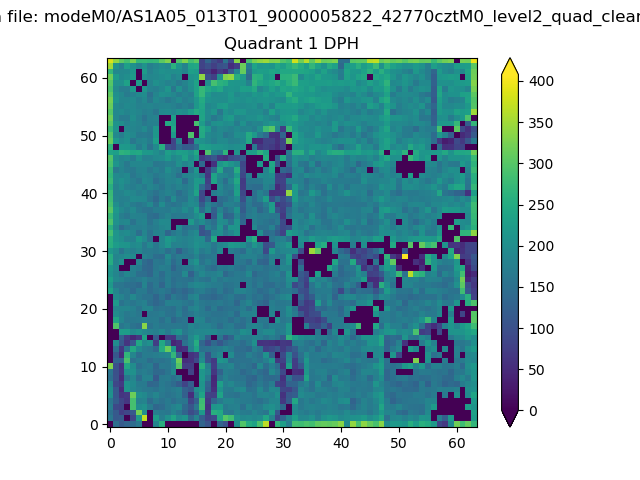 |
Quadrant B |
|---|---|---|---|
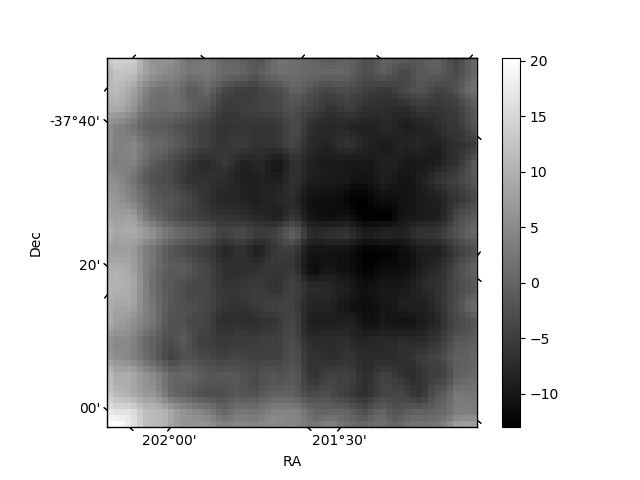
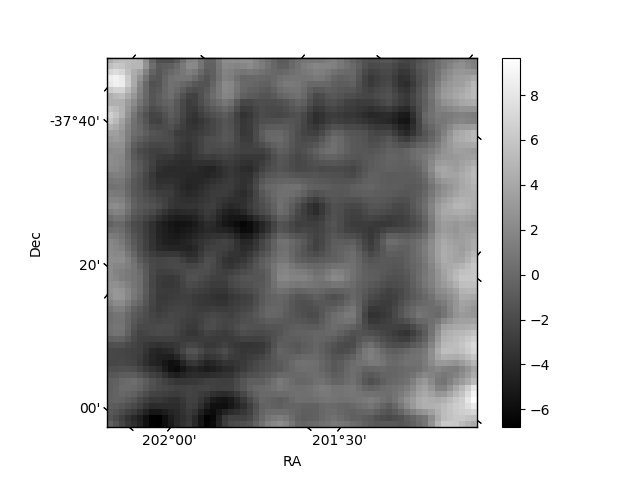
| Quadrant D | 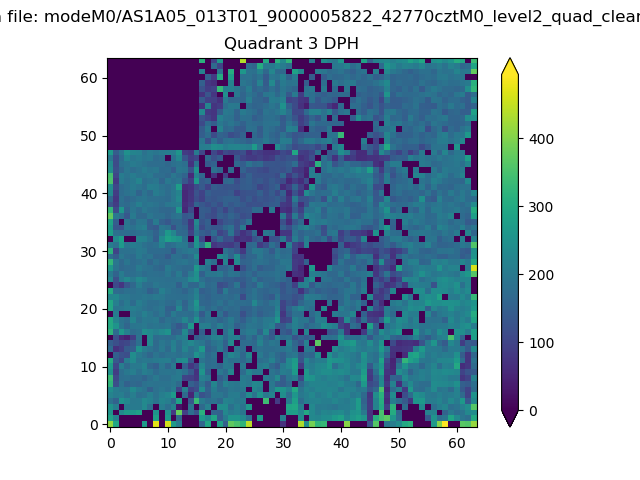 |
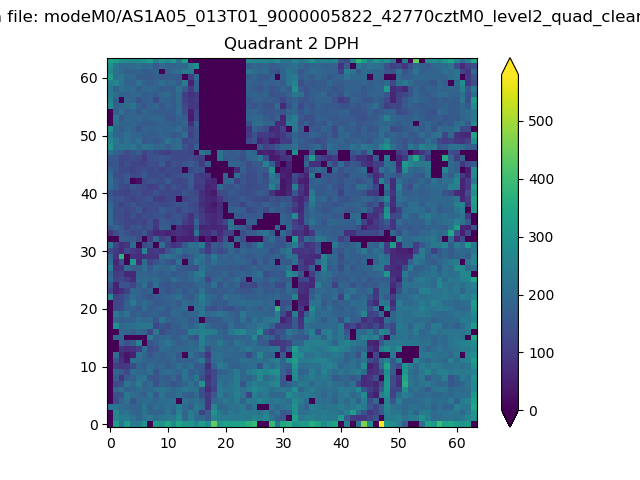 |
Quadrant C |
| Plot type | Count rate plots | Images |
|---|---|---|
| Comparison with Poisson distribution Blue bars denote a histogram of data divided into 1 sec bins. Red curve is a Poisson curve with rate = median count rate of data. |
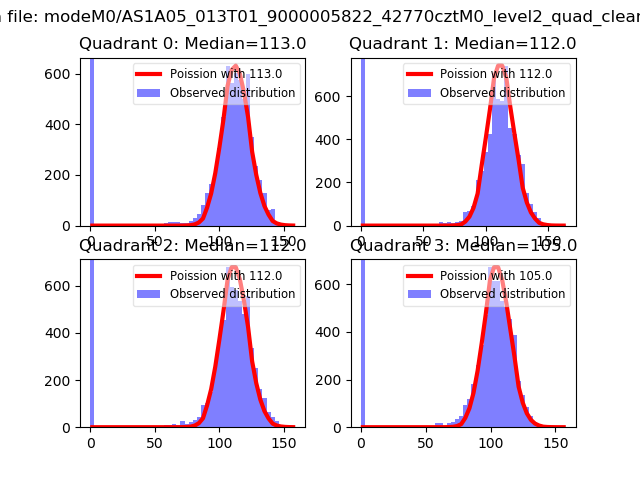 |
 |
| Quadrant-wise count rates Data is divided into 100 sec bins |
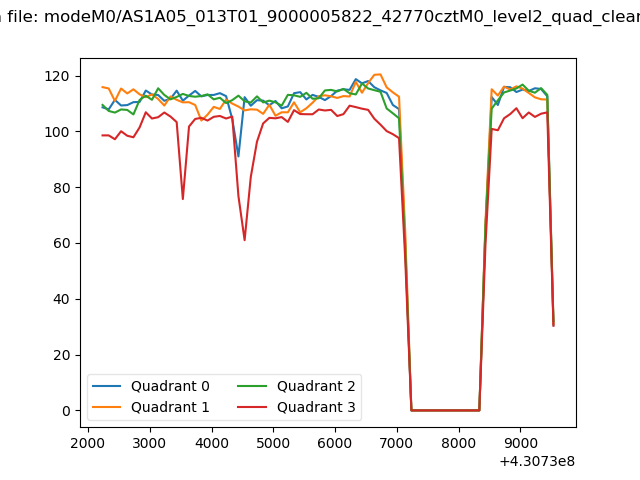 |
|
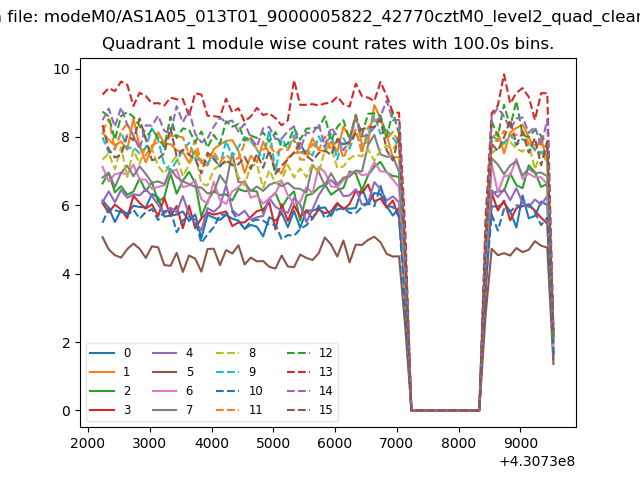
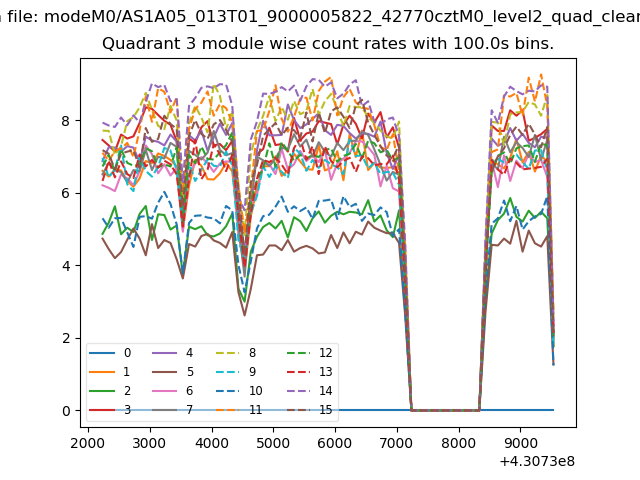
| Module-wise count rates for Quadrant A Data is divided into 100 sec bins |
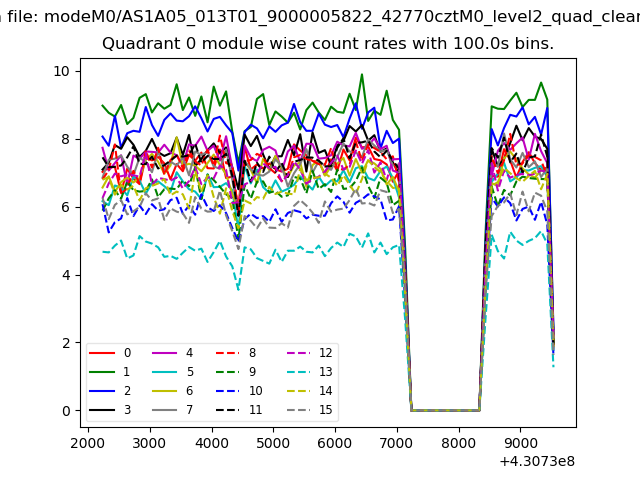 |
 |
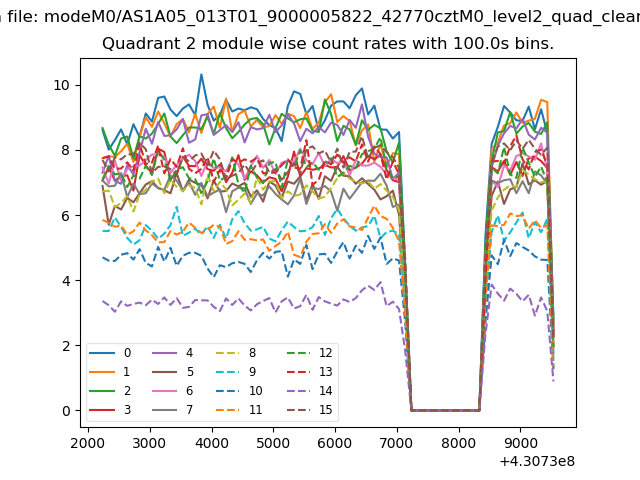
| Module-wise count rates for Quadrant B Data is divided into 100 sec bins |
 |
 |
| Module-wise count rates for Quadrant C Data is divided into 100 sec bins |
 |
 |
| Module-wise count rates for Quadrant D Data is divided into 100 sec bins |
 |
 |
| Parameter | Plot |
|---|---|
| CZT HV Monitor | 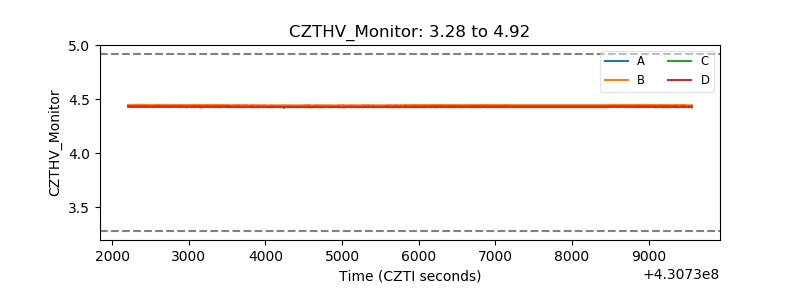 |
| D_VDD | 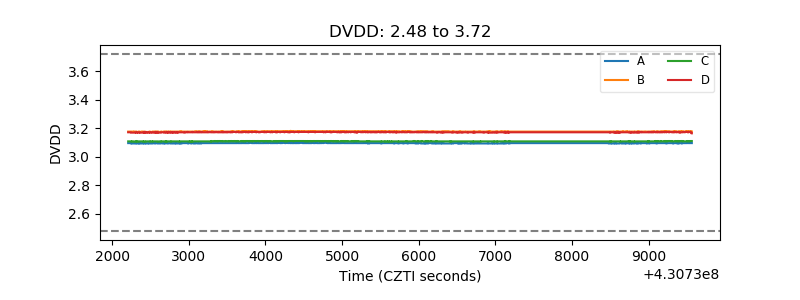 |
| Temperature 1 | 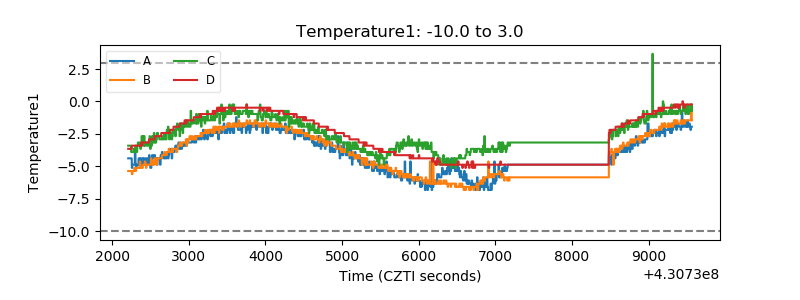 |
| Veto HV Monitor | 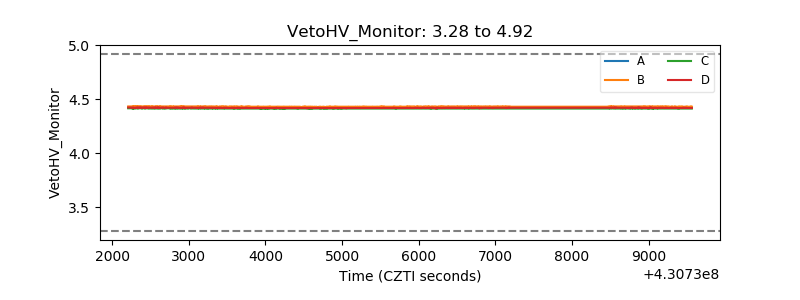 |
| Veto LLD | 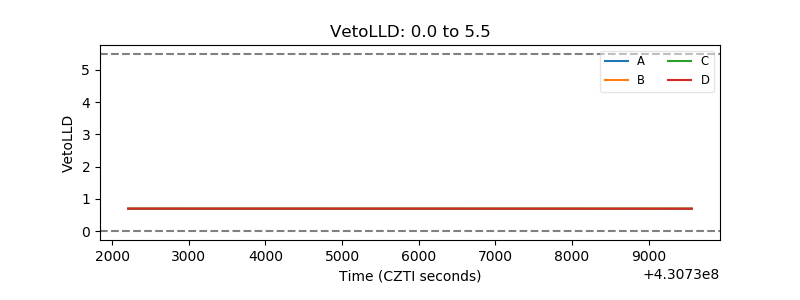 |
| Alpha Counter | 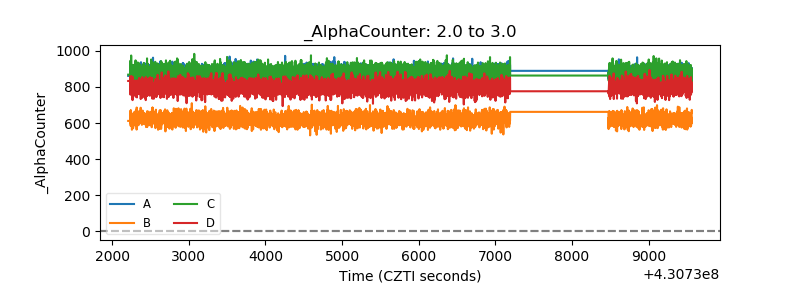 |
| _CPM_Rate | 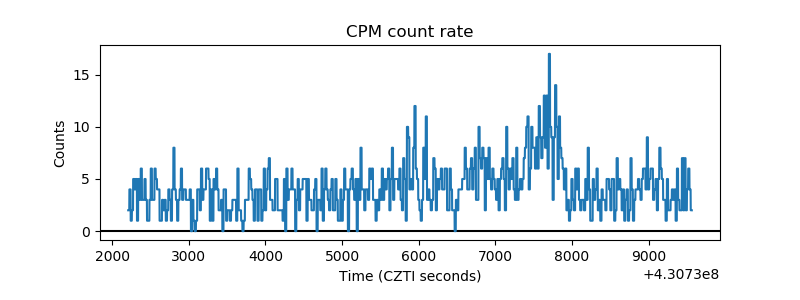 |
| CZT Counter | 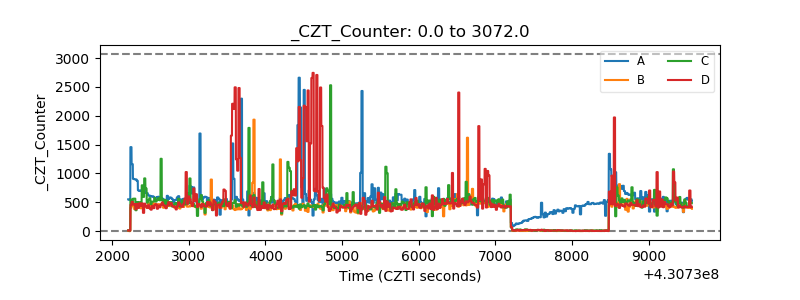 |
| +2.5 Volts monitor | 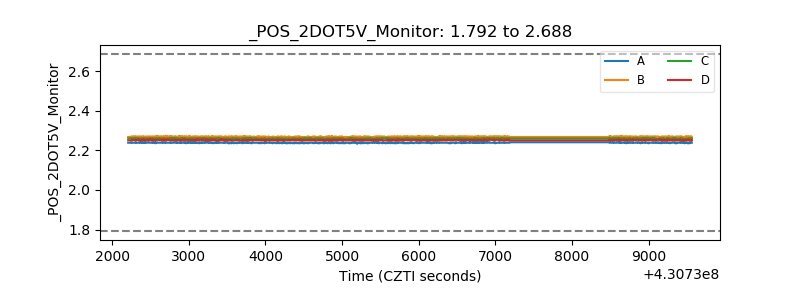 |
| +5 Volts monitor |  |
| _ROLL_ROT | 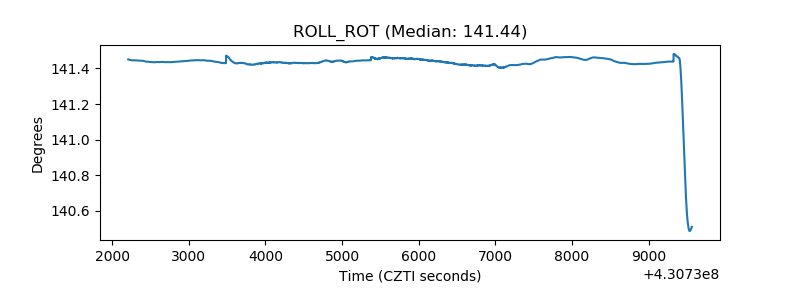 |
| _Roll_DEC | 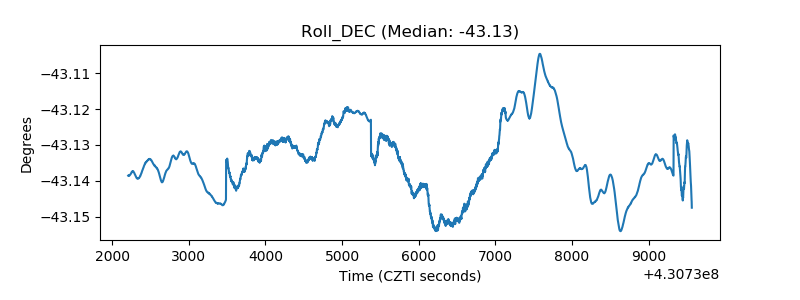 |
| _Roll_RA | 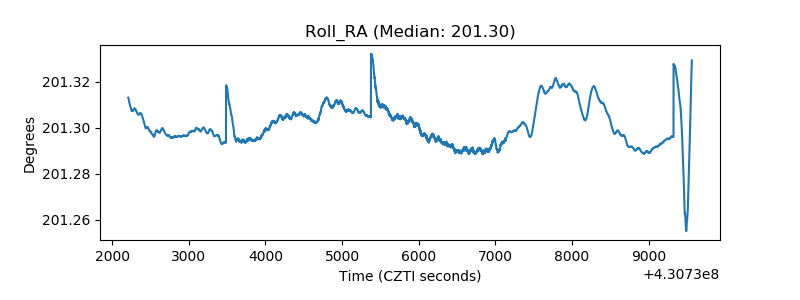 |
| Veto Counter | 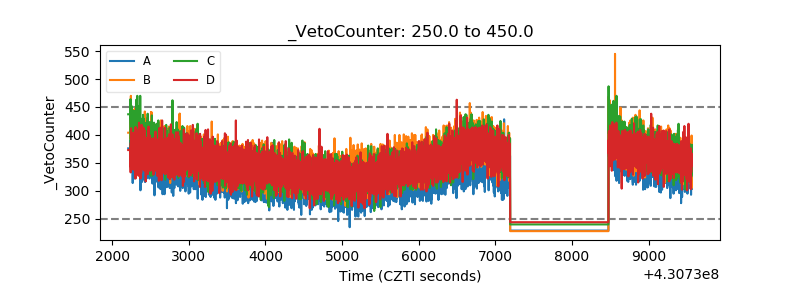 |