| Param | Original file | Final file |
|---|---|---|
| Filename | modeM0/AS1A05_013T01_9000005822_42772cztM0_level2.fits | modeM0/AS1A05_013T01_9000005822_42772cztM0_level2_quad_clean.evt |
| Size (bytes) | 621,201,600 | 178,571,520 |
| Size | 592.4 MB | 170.3 MB |
| Events in quadrant A | 6,363,510 | 1,179,684 |
| Events in quadrant B | 4,940,557 | 1,185,941 |
| Events in quadrant C | 5,376,865 | 1,193,317 |
| Events in quadrant D | 5,476,683 | 1,101,288 |
| Mode M0 | |||
|---|---|---|---|
| Quadrant | BADHDUFLAG | Total packets | Discarded packets |
| A | 0 | 25204 | 3 |
| B | 0 | 22213 | 3 |
| C | 0 | 22761 | 3 |
| D | 0 | 24030 | 3 |
| Mode M9 | |||
|---|---|---|---|
| Quadrant | BADHDUFLAG | Total packets | Discarded packets |
| A | 0 | 31 | 0 |
| B | 0 | 31 | 0 |
| C | 0 | 32 | 0 |
| D | 0 | 32 | 0 |
| Mode SS | |||
|---|---|---|---|
| Quadrant | BADHDUFLAG | Total packets | Discarded packets |
| A | 0 | 218 | 0 |
| B | 0 | 218 | 0 |
| C | 0 | 218 | 0 |
| D | 0 | 218 | 0 |
| Quadrant | Total seconds | Saturated seconds | Saturation percentage |
|---|---|---|---|
| A | 10787 | 222 | 2.058033% |
| B | 10788 | 44 | 0.407861% |
| C | 10788 | 36 | 0.333704% |
| D | 10788 | 149 | 1.381164% |
Noise dominated data is calculated using 1-second bins in cleaned event files. If a bin has >2000 counts, and if more than 50% of those come from <1% of pixels, then it is considered to be noise-dominated and hence unusable.
| Quadrant | # 1 sec bins | Bins with >0 counts | Bins with >2000 counts | High rate bins dominated by noise | Noise dominated (total time) | Noise dominated (detector-on time) | Marked lightcurve |
|---|---|---|---|---|---|---|---|
| A | 13565 | 10789 | 170 | 170 | 1.25% | 1.58% | 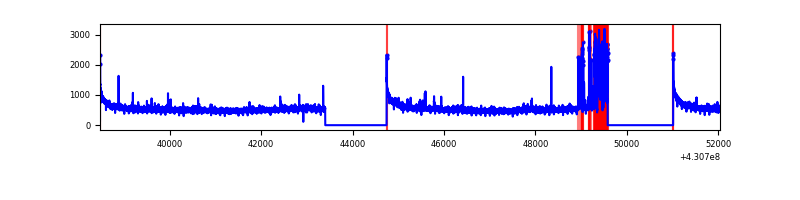 |
| B | 13565 | 10790 | 29 | 29 | 0.21% | 0.27% | 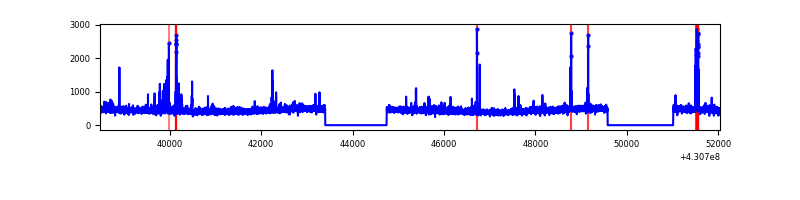 |
| C | 13565 | 10790 | 29 | 29 | 0.21% | 0.27% | 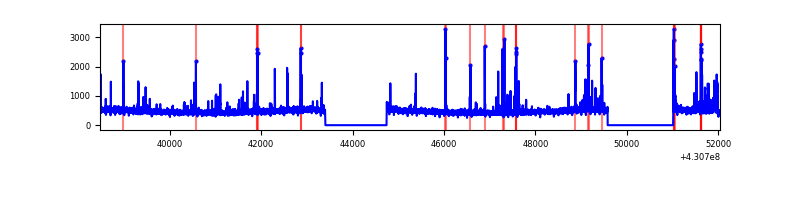 |
| D | 13565 | 10790 | 132 | 132 | 0.97% | 1.22% | 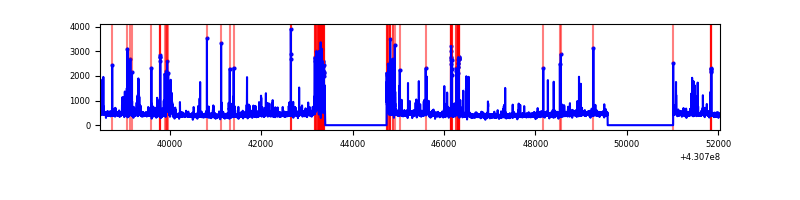 |
Top three noisy pixels from each quadrant. If the there are fewer than three noisy pixels in the level2.evt file, extra rows are filled as -1
| Pixel properties | Quadrant properties | ||||||
|---|---|---|---|---|---|---|---|
| Quadrant | DetID | PixID | Counts | Sigma | Mean | Median | Sigma |
| A | 10 | 83 | 1111783 | 4563.43 | 1191 | 1167 | 243.4 |
| A | 13 | 248 | 548072 | 2247.19 | 1191 | 1167 | 243.4 |
| A | 12 | 189 | 44052 | 176.21 | 1191 | 1167 | 243.4 |
| B | 15 | 35 | 74198 | 316.2 | 1179 | 1145 | 231.0 |
| B | 0 | 230 | 67608 | 287.67 | 1179 | 1145 | 231.0 |
| B | 15 | 85 | 66447 | 282.65 | 1179 | 1145 | 231.0 |
| C | 15 | 214 | 446262 | 1635.35 | 1168 | 1179 | 272.2 |
| C | 14 | 254 | 223268 | 816.01 | 1168 | 1179 | 272.2 |
| C | 10 | 34 | 67473 | 243.58 | 1168 | 1179 | 272.2 |
| D | 2 | 249 | 297717 | 1031.83 | 1168 | 1135 | 287.4 |
| D | 5 | 171 | 144845 | 499.98 | 1168 | 1135 | 287.4 |
| D | 10 | 118 | 124931 | 430.7 | 1168 | 1135 | 287.4 |
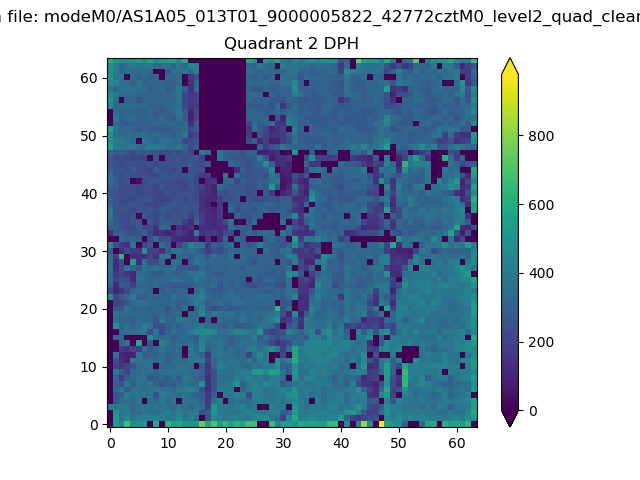
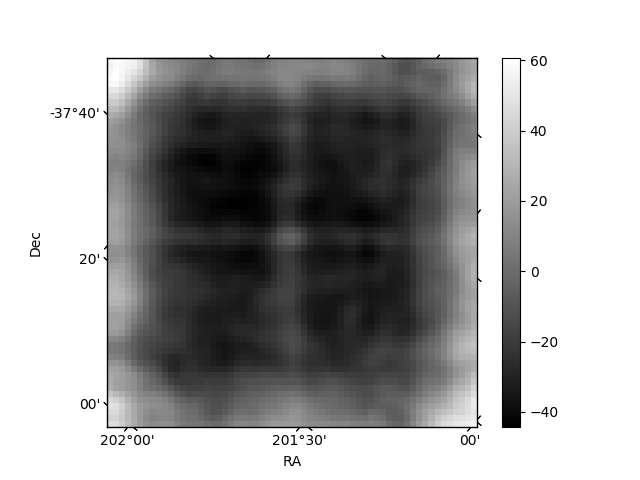
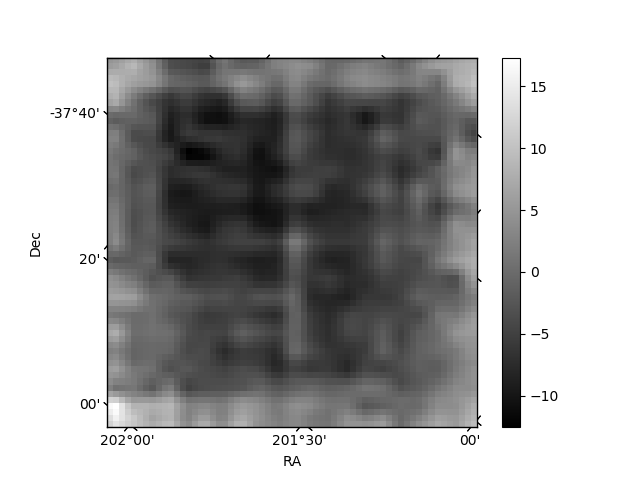
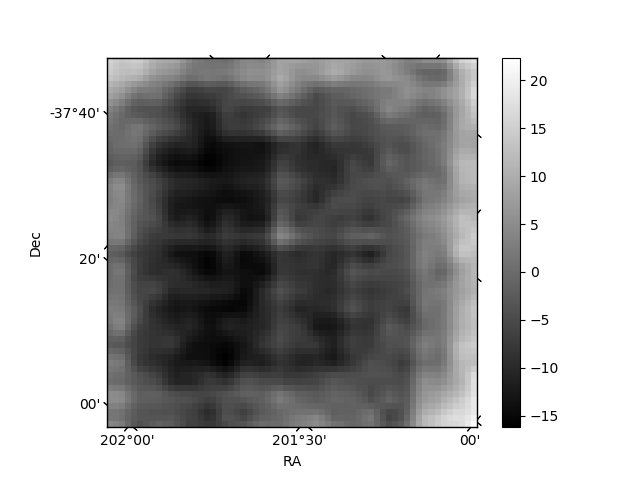
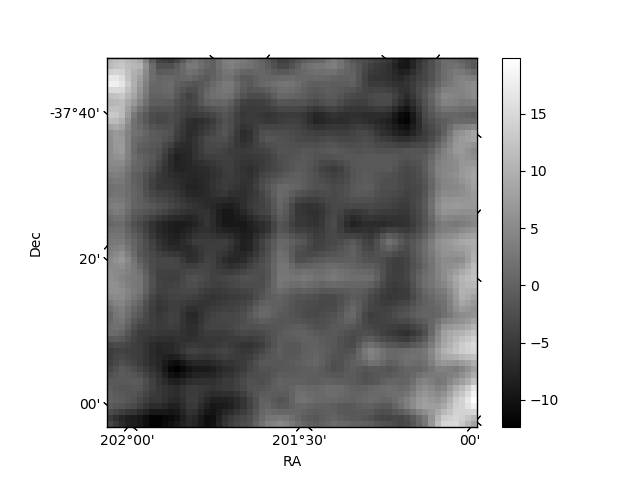
Histogram calculated using DETX and DETY for each event in the final _common_clean file
| Quadrant A | 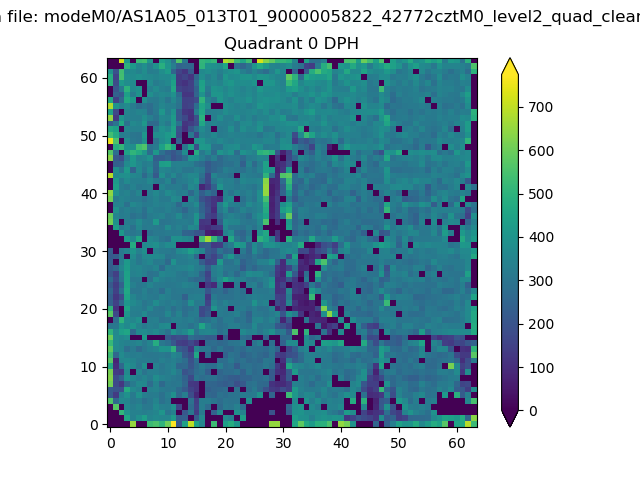 |
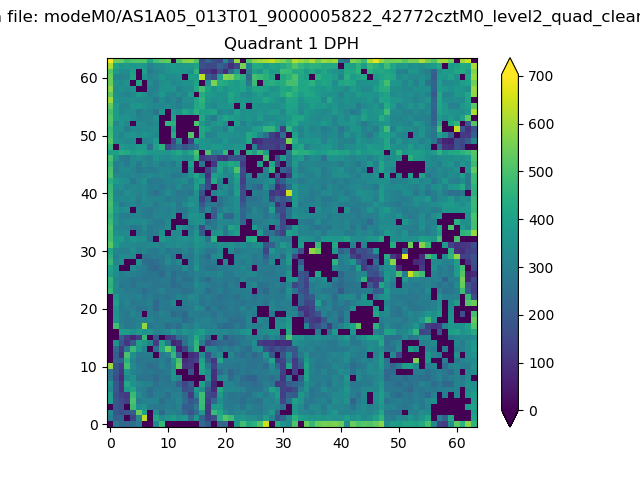 |
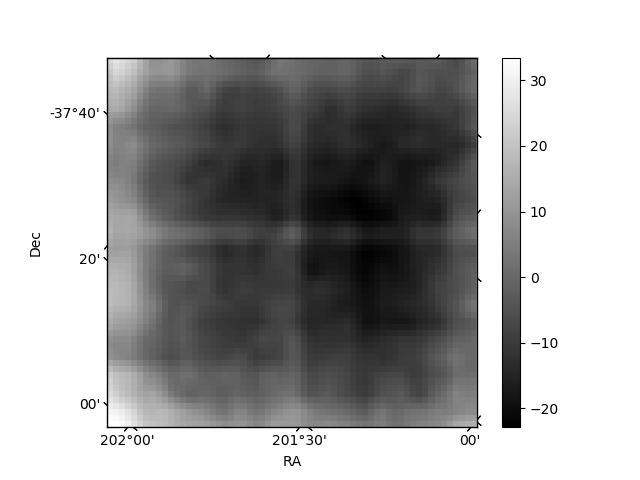
Quadrant B |
|---|---|---|---|
| Quadrant D | 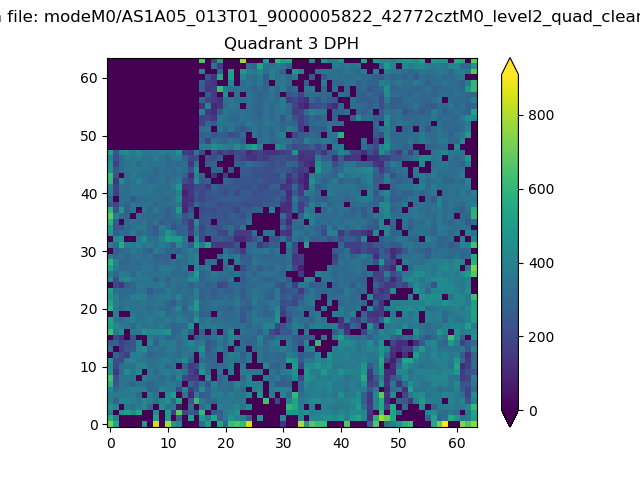 |
 |
Quadrant C |
| Plot type | Count rate plots | Images |
|---|---|---|
| Comparison with Poisson distribution Blue bars denote a histogram of data divided into 1 sec bins. Red curve is a Poisson curve with rate = median count rate of data. |
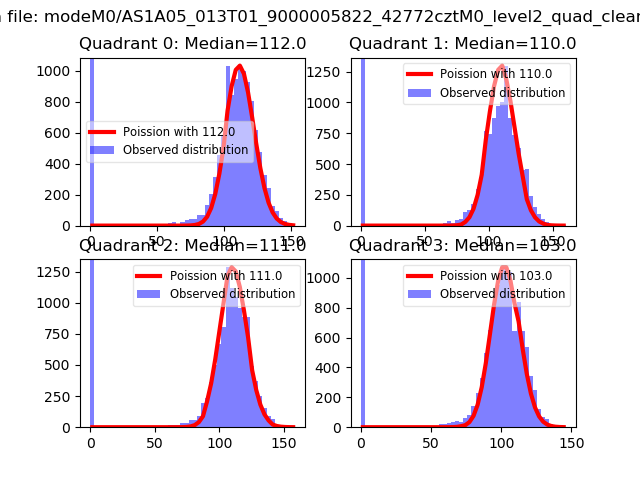 |
 |
| Quadrant-wise count rates Data is divided into 100 sec bins |
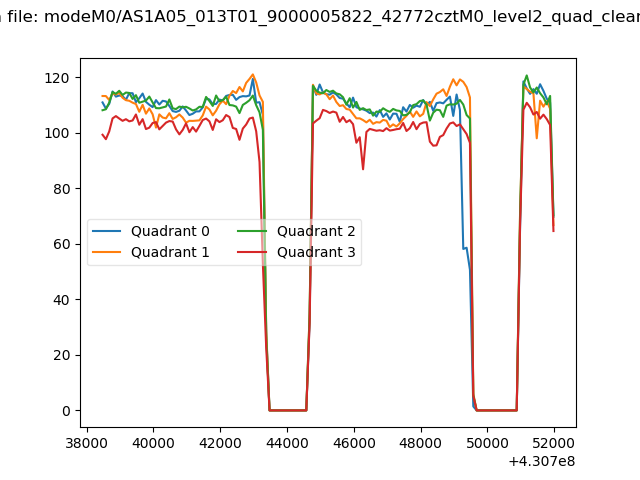 |
|
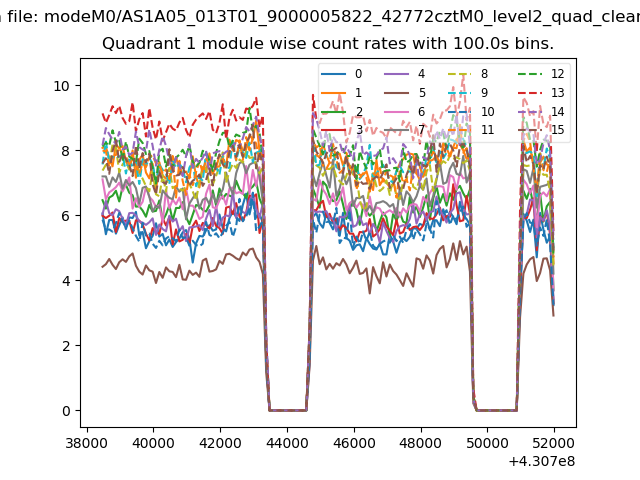
| Module-wise count rates for Quadrant A Data is divided into 100 sec bins |
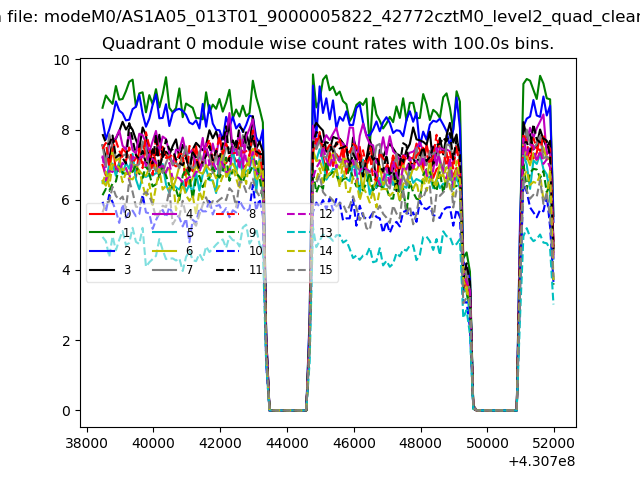 |
 |
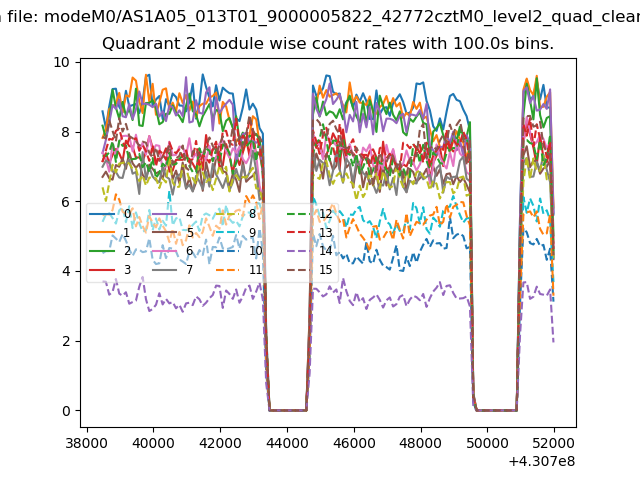
| Module-wise count rates for Quadrant B Data is divided into 100 sec bins |
 |
 |
| Module-wise count rates for Quadrant C Data is divided into 100 sec bins |
 |
 |
| Module-wise count rates for Quadrant D Data is divided into 100 sec bins |
 |
 |
| Parameter | Plot |
|---|---|
| CZT HV Monitor | 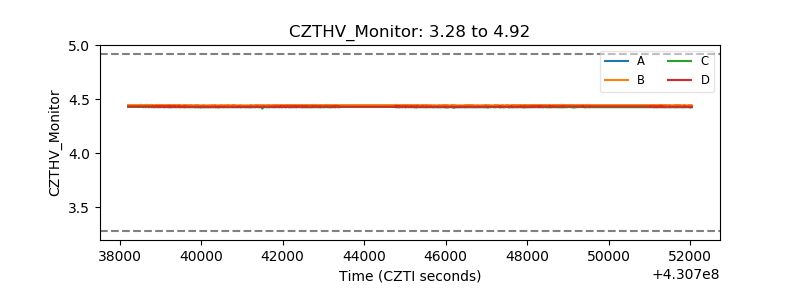 |
| D_VDD | 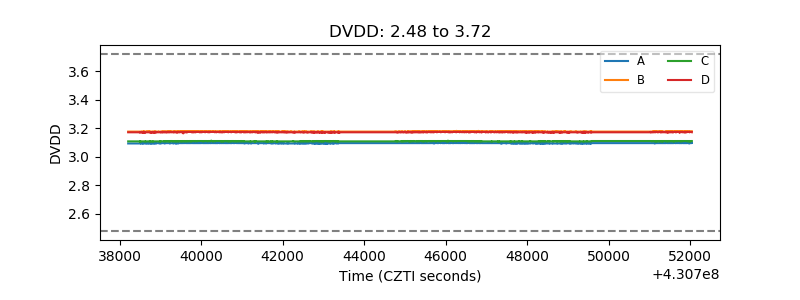 |
| Temperature 1 | 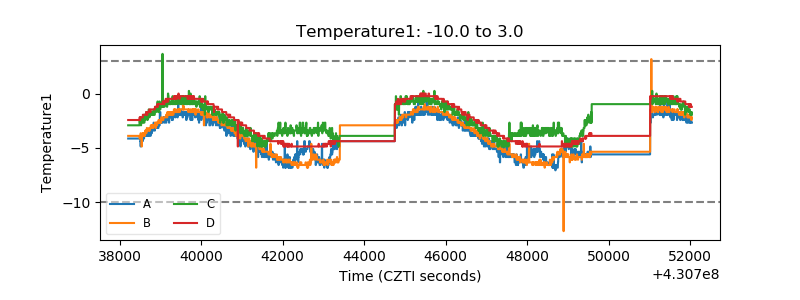 |
| Veto HV Monitor | 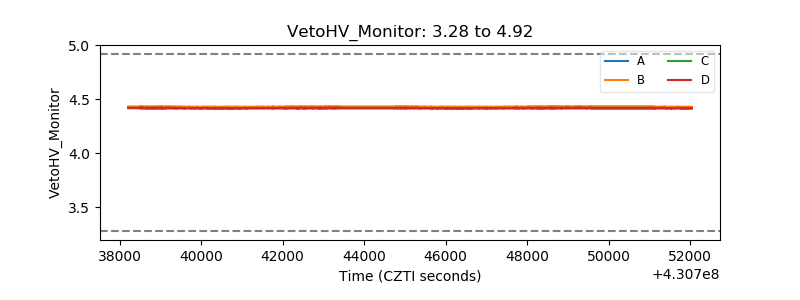 |
| Veto LLD | 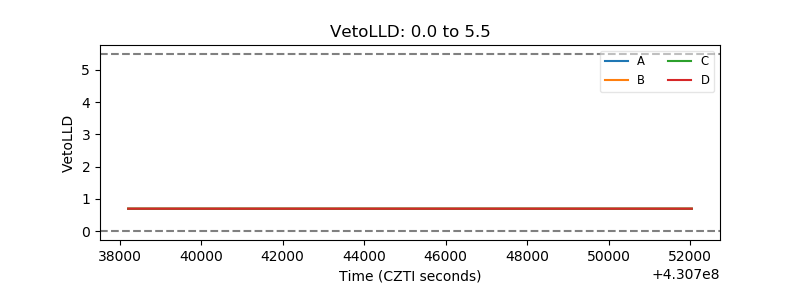 |
| Alpha Counter | 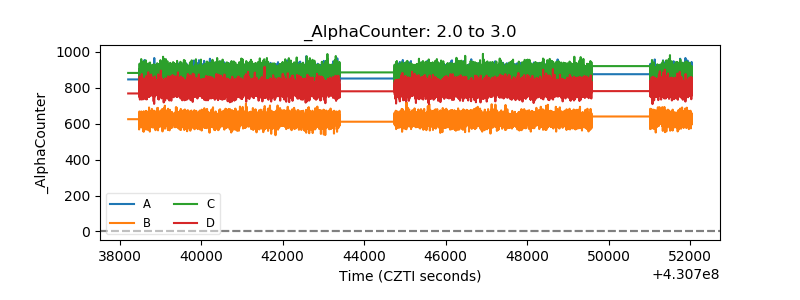 |
| _CPM_Rate | 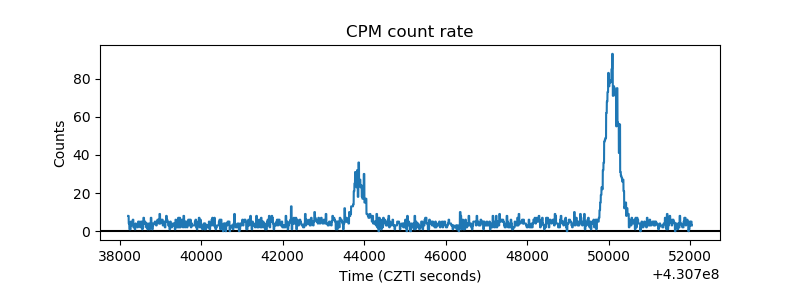 |
| CZT Counter | 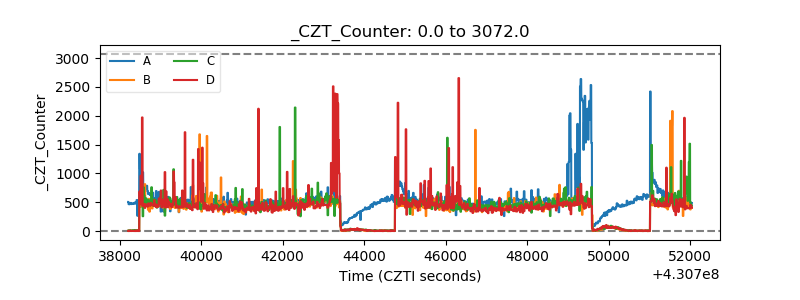 |
| +2.5 Volts monitor | 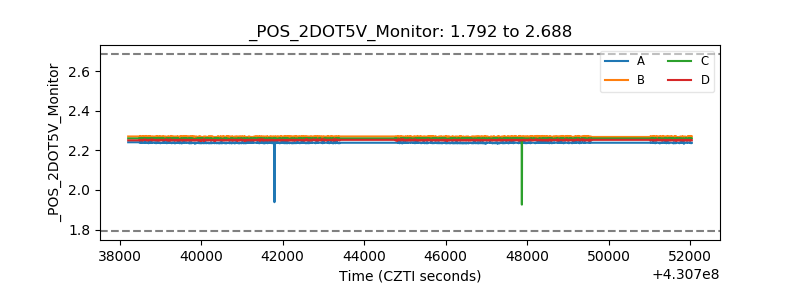 |
| +5 Volts monitor | 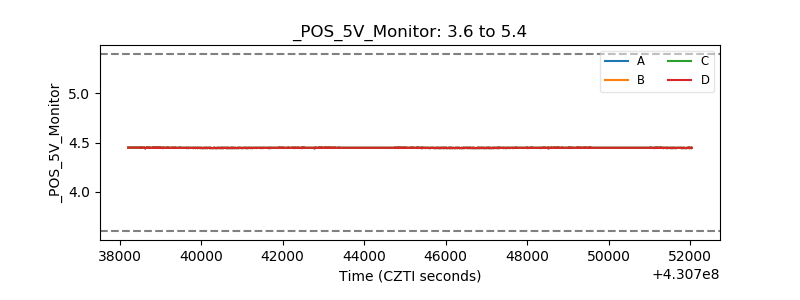 |
| _ROLL_ROT | 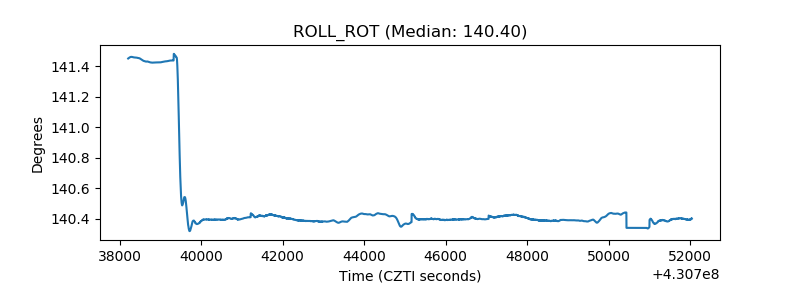 |
| _Roll_DEC | 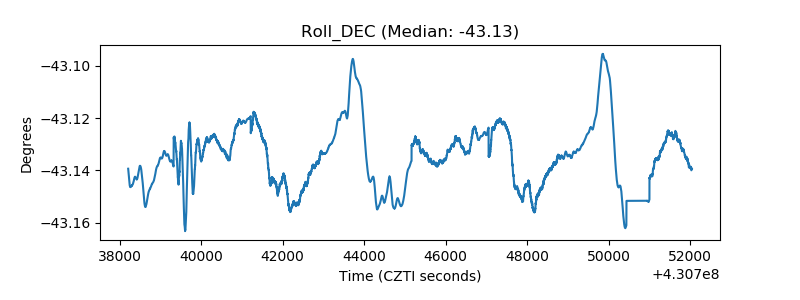 |
| _Roll_RA | 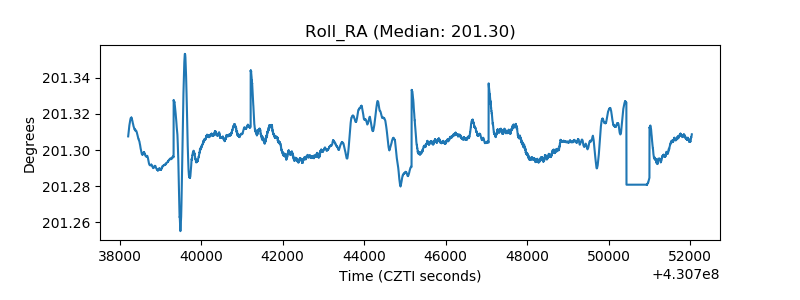 |
| Veto Counter | 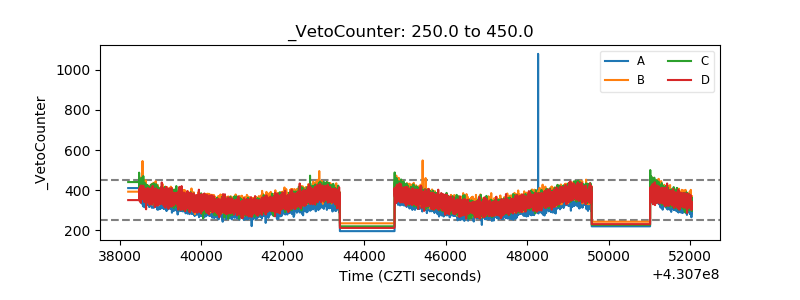 |