| Param | Original file | Final file |
|---|---|---|
| Filename | modeM0/AS1A05_013T01_9000005822_42773cztM0_level2.fits | modeM0/AS1A05_013T01_9000005822_42773cztM0_level2_quad_clean.evt |
| Size (bytes) | 310,757,760 | 91,630,080 |
| Size | 296.4 MB | 87.4 MB |
| Events in quadrant A | 2,975,890 | 613,680 |
| Events in quadrant B | 2,508,254 | 605,832 |
| Events in quadrant C | 2,892,226 | 607,479 |
| Events in quadrant D | 2,699,718 | 563,776 |
| Mode M0 | |||
|---|---|---|---|
| Quadrant | BADHDUFLAG | Total packets | Discarded packets |
| A | 0 | 12085 | 2 |
| B | 0 | 11339 | 1 |
| C | 0 | 12208 | 1 |
| D | 0 | 11977 | 1 |
| Mode M9 | |||
|---|---|---|---|
| Quadrant | BADHDUFLAG | Total packets | Discarded packets |
| A | 0 | 16 | 0 |
| B | 0 | 16 | 0 |
| C | 0 | 16 | 0 |
| D | 0 | 16 | 0 |
| Mode SS | |||
|---|---|---|---|
| Quadrant | BADHDUFLAG | Total packets | Discarded packets |
| A | 0 | 112 | 0 |
| B | 0 | 112 | 0 |
| C | 0 | 112 | 0 |
| D | 0 | 112 | 0 |
| Quadrant | Total seconds | Saturated seconds | Saturation percentage |
|---|---|---|---|
| A | 5482 | 13 | 0.237140% |
| B | 5482 | 31 | 0.565487% |
| C | 5482 | 13 | 0.237140% |
| D | 5482 | 28 | 0.510762% |
Noise dominated data is calculated using 1-second bins in cleaned event files. If a bin has >2000 counts, and if more than 50% of those come from <1% of pixels, then it is considered to be noise-dominated and hence unusable.
| Quadrant | # 1 sec bins | Bins with >0 counts | Bins with >2000 counts | High rate bins dominated by noise | Noise dominated (total time) | Noise dominated (detector-on time) | Marked lightcurve |
|---|---|---|---|---|---|---|---|
| A | 7065 | 5483 | 3 | 3 | 0.04% | 0.05% | 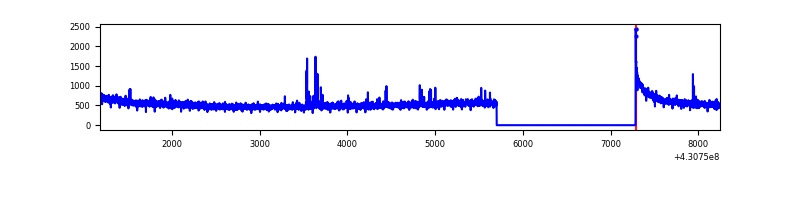 |
| B | 7065 | 5483 | 24 | 24 | 0.34% | 0.44% | 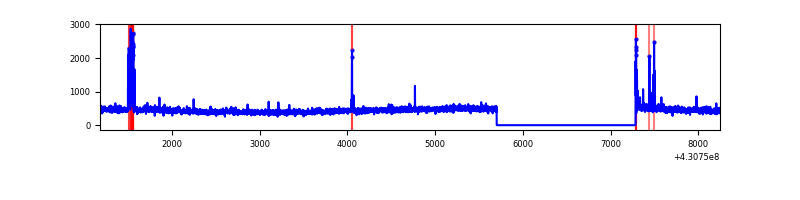 |
| C | 7065 | 5483 | 8 | 8 | 0.11% | 0.15% | 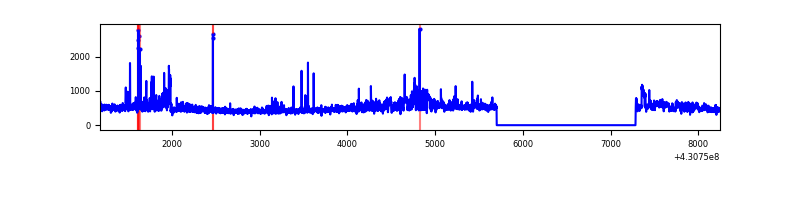 |
| D | 7065 | 5483 | 29 | 29 | 0.41% | 0.53% | 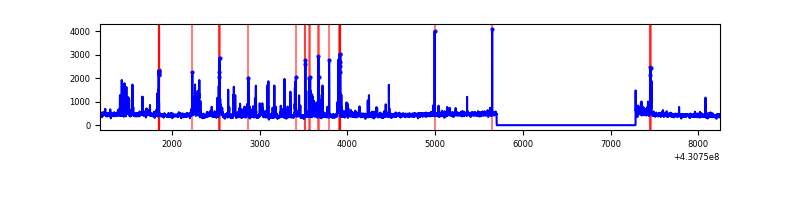 |
Top three noisy pixels from each quadrant. If the there are fewer than three noisy pixels in the level2.evt file, extra rows are filled as -1
| Pixel properties | Quadrant properties | ||||||
|---|---|---|---|---|---|---|---|
| Quadrant | DetID | PixID | Counts | Sigma | Mean | Median | Sigma |
| A | 10 | 83 | 561576 | 4508.06 | 603 | 590 | 124.4 |
| A | 13 | 248 | 30392 | 239.49 | 603 | 590 | 124.4 |
| A | 13 | 6 | 19078 | 148.57 | 603 | 590 | 124.4 |
| B | 15 | 35 | 72560 | 613.14 | 596 | 579 | 117.4 |
| B | 5 | 172 | 42240 | 354.87 | 596 | 579 | 117.4 |
| B | 0 | 230 | 27406 | 228.52 | 596 | 579 | 117.4 |
| C | 10 | 34 | 252977 | 1845.42 | 586 | 591 | 136.8 |
| C | 15 | 214 | 226386 | 1650.99 | 586 | 591 | 136.8 |
| C | 14 | 254 | 79251 | 575.15 | 586 | 591 | 136.8 |
| D | 12 | 233 | 234316 | 1599.07 | 588 | 571 | 146.2 |
| D | 5 | 70 | 42397 | 286.14 | 588 | 571 | 146.2 |
| D | 1 | 52 | 36416 | 245.22 | 588 | 571 | 146.2 |
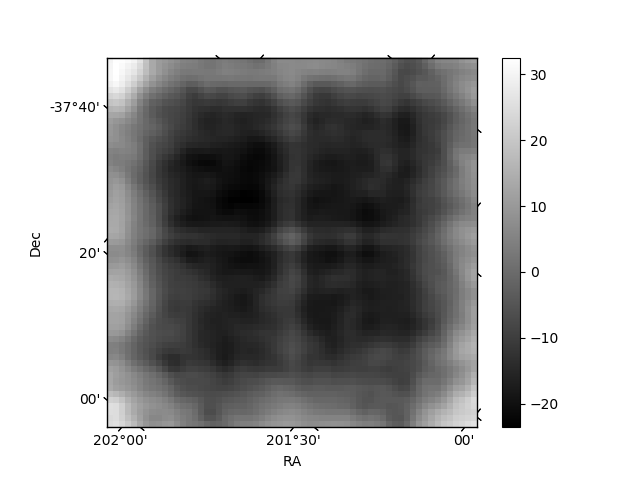
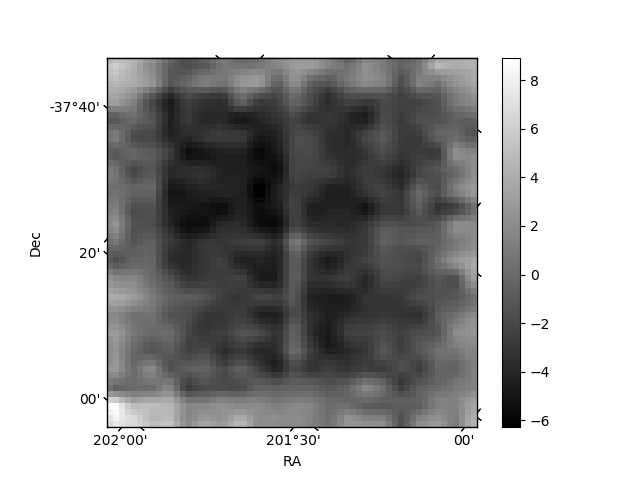
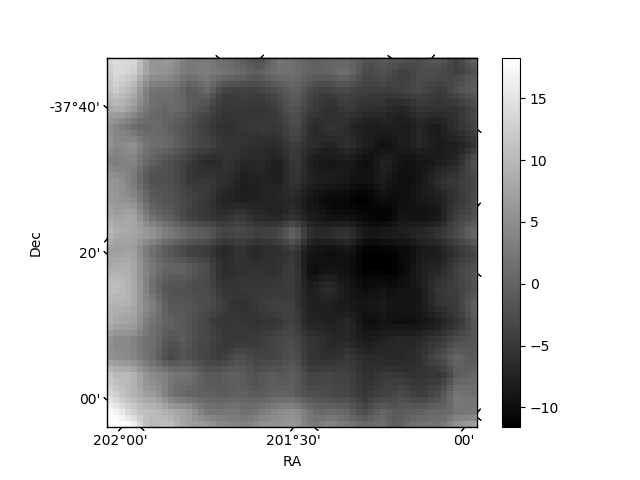
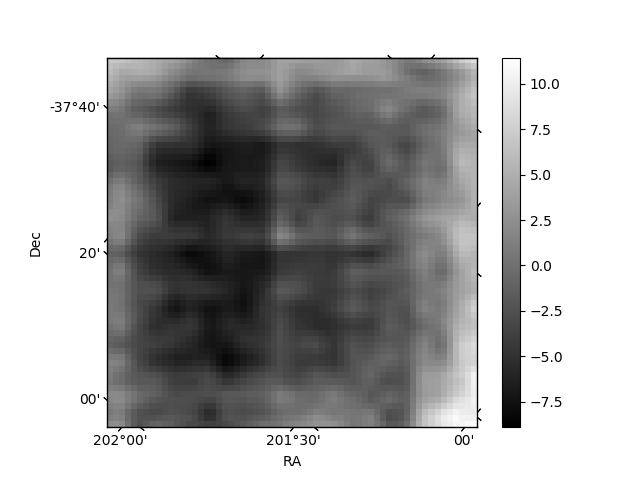
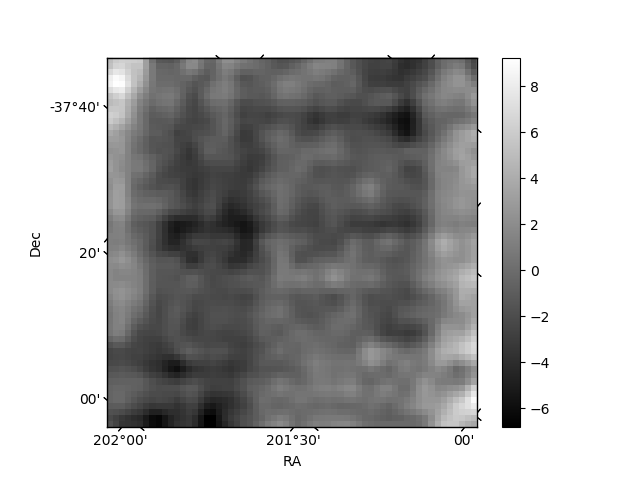
Histogram calculated using DETX and DETY for each event in the final _common_clean file
| Quadrant A | 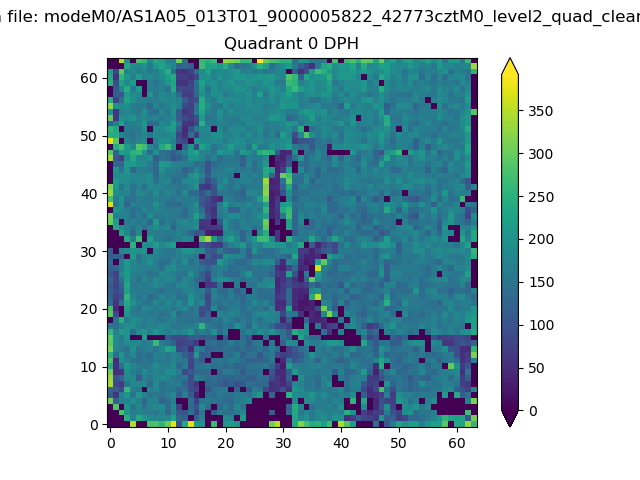 |
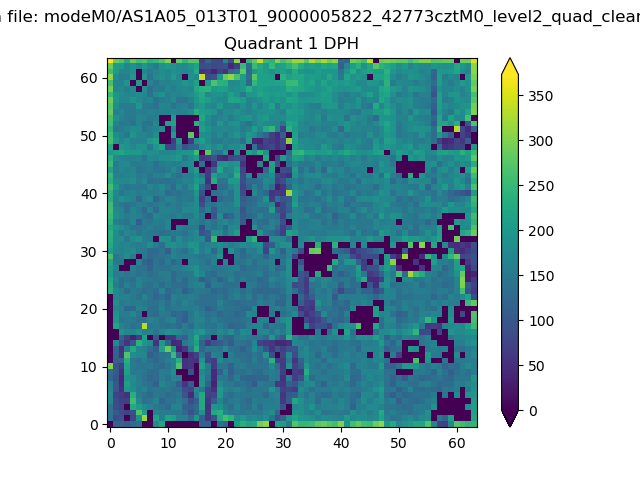 |
Quadrant B |
|---|---|---|---|
| Quadrant D | 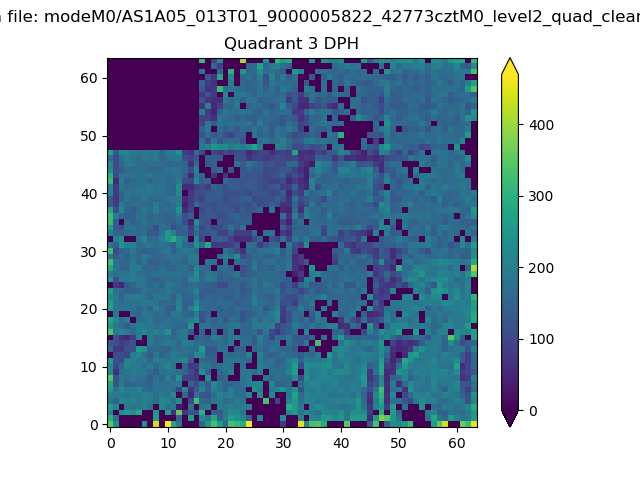 |
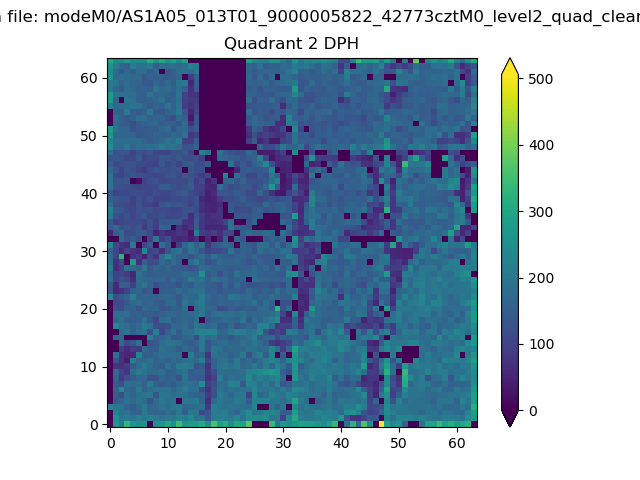 |
Quadrant C |
| Plot type | Count rate plots | Images |
|---|---|---|
| Comparison with Poisson distribution Blue bars denote a histogram of data divided into 1 sec bins. Red curve is a Poisson curve with rate = median count rate of data. |
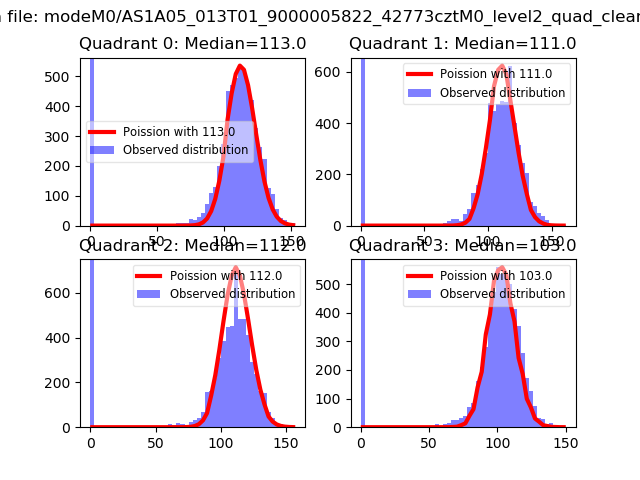 |
 |
| Quadrant-wise count rates Data is divided into 100 sec bins |
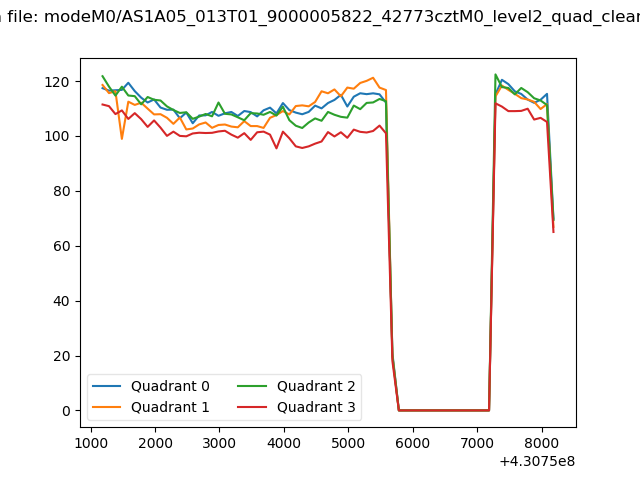 |
|
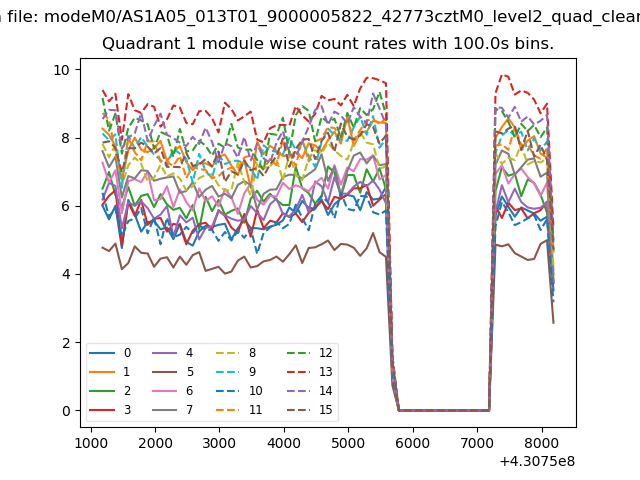
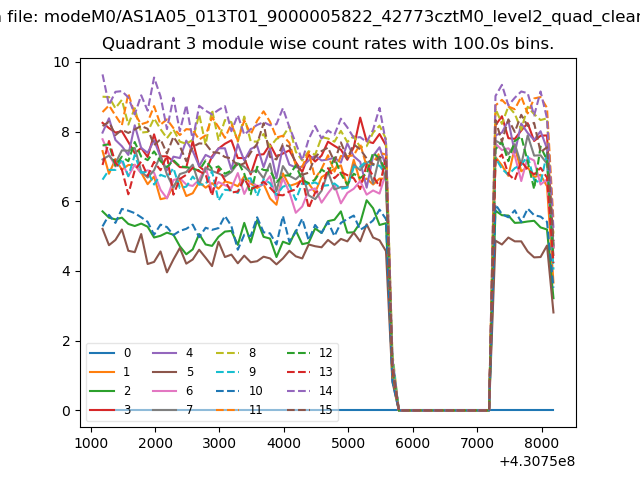
| Module-wise count rates for Quadrant A Data is divided into 100 sec bins |
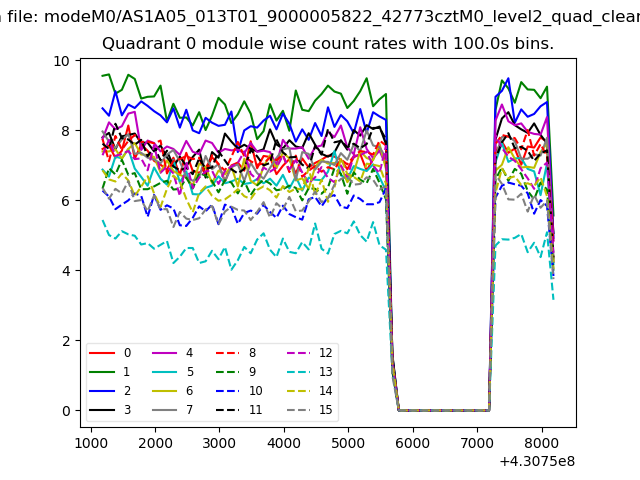 |
 |
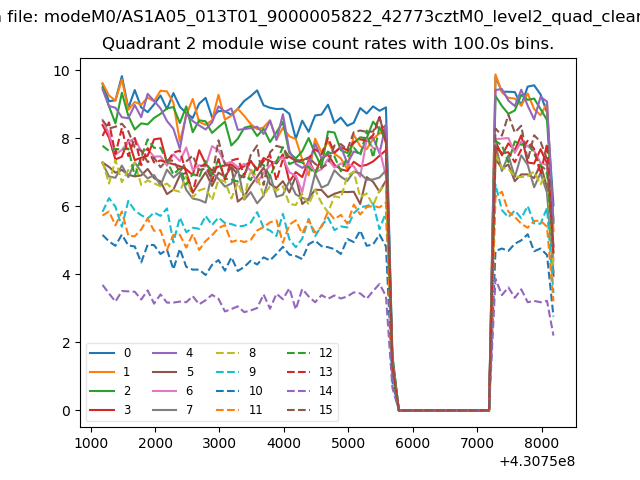
| Module-wise count rates for Quadrant B Data is divided into 100 sec bins |
 |
 |
| Module-wise count rates for Quadrant C Data is divided into 100 sec bins |
 |
 |
| Module-wise count rates for Quadrant D Data is divided into 100 sec bins |
 |
 |
| Parameter | Plot |
|---|---|
| CZT HV Monitor | 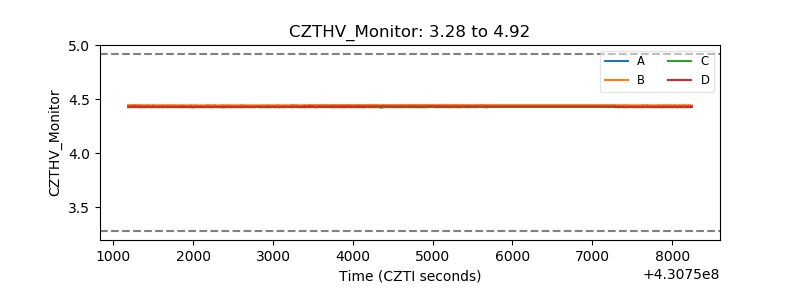 |
| D_VDD | 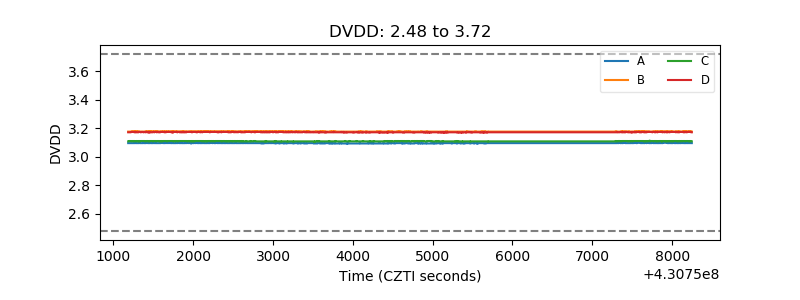 |
| Temperature 1 | 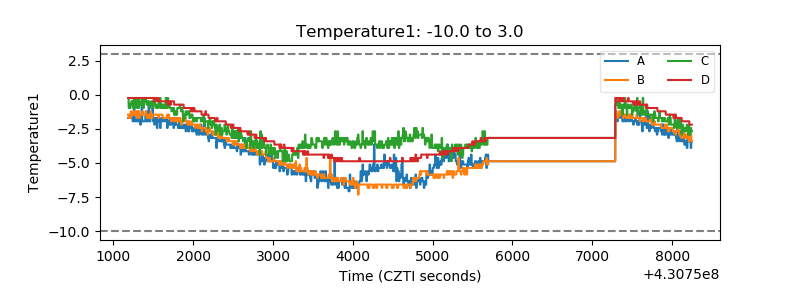 |
| Veto HV Monitor | 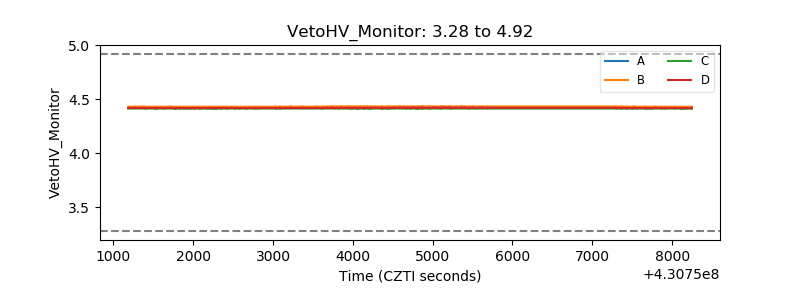 |
| Veto LLD | 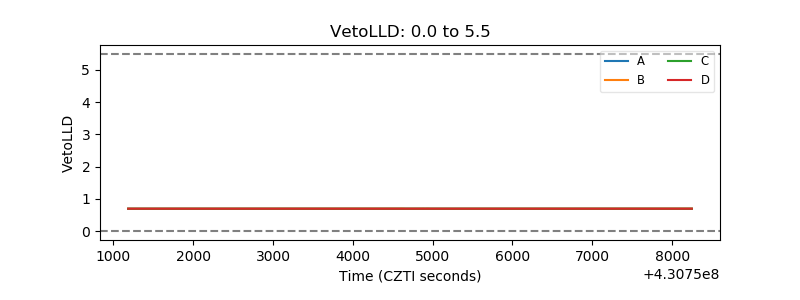 |
| Alpha Counter | 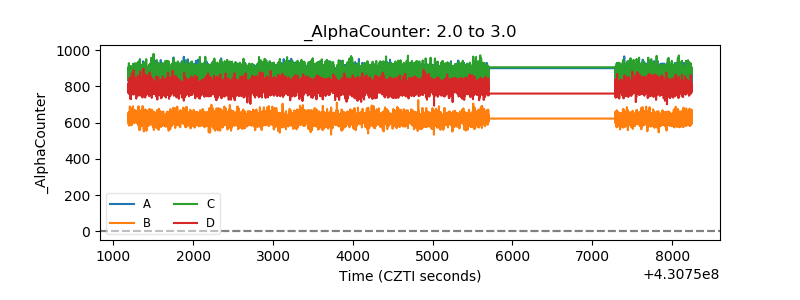 |
| _CPM_Rate | 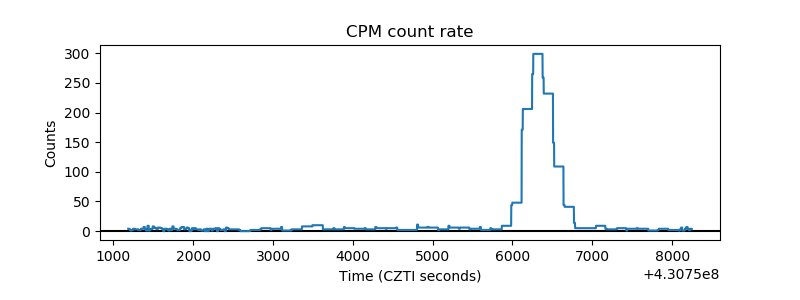 |
| CZT Counter | 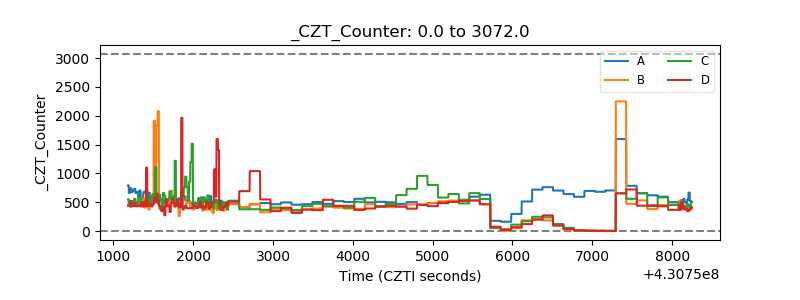 |
| +2.5 Volts monitor | 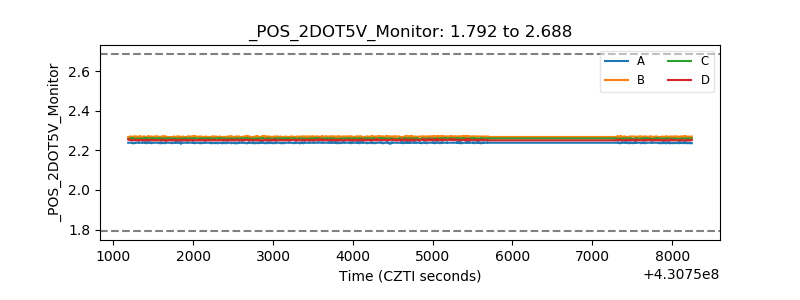 |
| +5 Volts monitor | 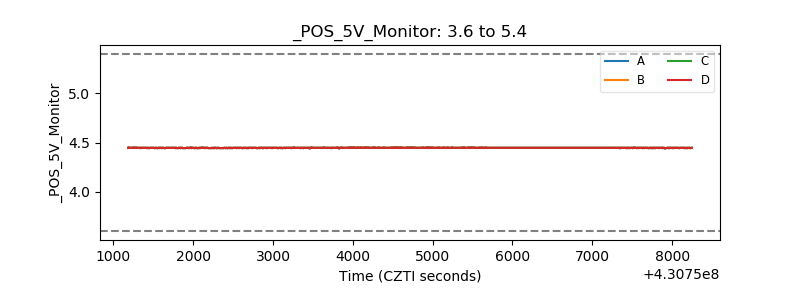 |
| _ROLL_ROT | 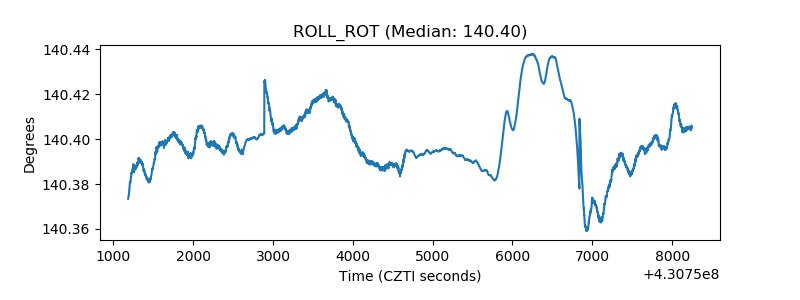 |
| _Roll_DEC | 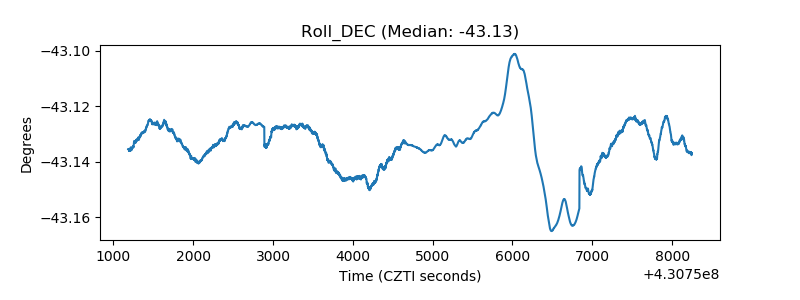 |
| _Roll_RA | 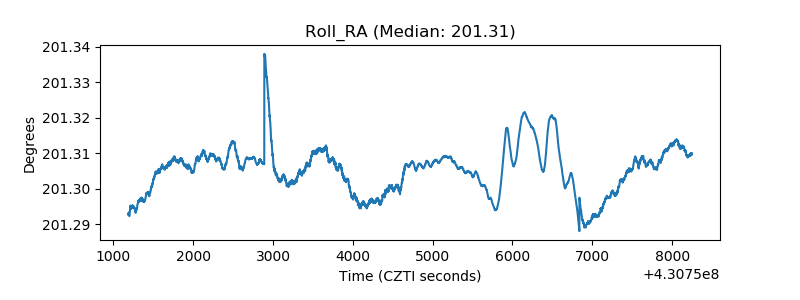 |
| Veto Counter |  |