| Param | Original file | Final file |
|---|---|---|
| Filename | modeM0/AS1A05_013T01_9000005822_42774cztM0_level2.fits | modeM0/AS1A05_013T01_9000005822_42774cztM0_level2_quad_clean.evt |
| Size (bytes) | 320,186,880 | 90,388,800 |
| Size | 305.4 MB | 86.2 MB |
| Events in quadrant A | 3,099,694 | 608,317 |
| Events in quadrant B | 2,533,819 | 609,414 |
| Events in quadrant C | 2,791,515 | 599,633 |
| Events in quadrant D | 3,004,748 | 539,725 |
| Mode M0 | |||
|---|---|---|---|
| Quadrant | BADHDUFLAG | Total packets | Discarded packets |
| A | 0 | 12410 | 2 |
| B | 0 | 11360 | 2 |
| C | 0 | 11853 | 3 |
| D | 0 | 12959 | 2 |
| Mode M9 | |||
|---|---|---|---|
| Quadrant | BADHDUFLAG | Total packets | Discarded packets |
| A | 0 | 17 | 0 |
| B | 0 | 17 | 0 |
| C | 0 | 17 | 0 |
| D | 0 | 17 | 0 |
| Mode SS | |||
|---|---|---|---|
| Quadrant | BADHDUFLAG | Total packets | Discarded packets |
| A | 0 | 112 | 0 |
| B | 0 | 112 | 0 |
| C | 0 | 112 | 0 |
| D | 0 | 112 | 0 |
| Quadrant | Total seconds | Saturated seconds | Saturation percentage |
|---|---|---|---|
| A | 5421 | 30 | 0.553403% |
| B | 5421 | 23 | 0.424276% |
| C | 5420 | 24 | 0.442804% |
| D | 5421 | 219 | 4.039845% |
Noise dominated data is calculated using 1-second bins in cleaned event files. If a bin has >2000 counts, and if more than 50% of those come from <1% of pixels, then it is considered to be noise-dominated and hence unusable.
| Quadrant | # 1 sec bins | Bins with >0 counts | Bins with >2000 counts | High rate bins dominated by noise | Noise dominated (total time) | Noise dominated (detector-on time) | Marked lightcurve |
|---|---|---|---|---|---|---|---|
| A | 7125 | 5422 | 21 | 21 | 0.29% | 0.39% | 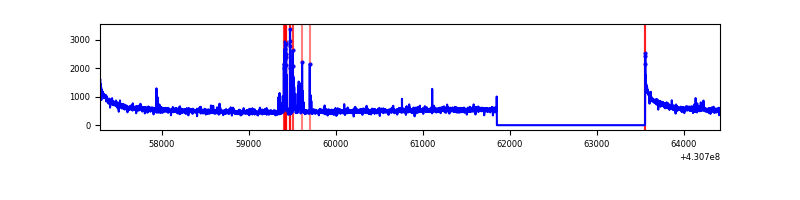 |
| B | 7125 | 5422 | 19 | 19 | 0.27% | 0.35% | 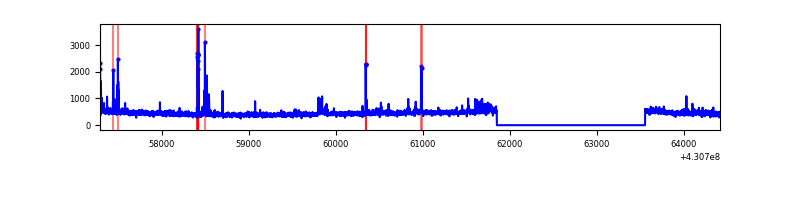 |
| C | 7124 | 5421 | 27 | 27 | 0.38% | 0.50% | 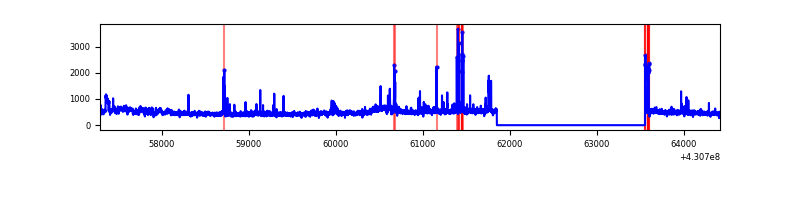 |
| D | 7125 | 5422 | 213 | 213 | 2.99% | 3.93% | 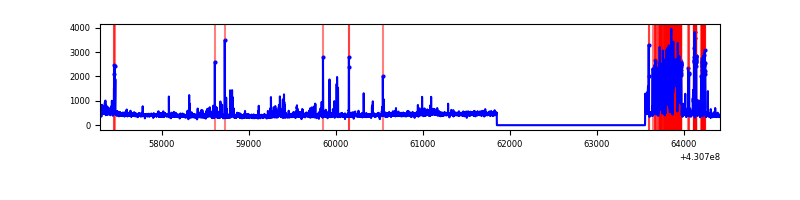 |
Top three noisy pixels from each quadrant. If the there are fewer than three noisy pixels in the level2.evt file, extra rows are filled as -1
| Pixel properties | Quadrant properties | ||||||
|---|---|---|---|---|---|---|---|
| Quadrant | DetID | PixID | Counts | Sigma | Mean | Median | Sigma |
| A | 10 | 83 | 611658 | 4969.23 | 596 | 584 | 123.0 |
| A | 13 | 248 | 128914 | 1043.57 | 596 | 584 | 123.0 |
| A | 12 | 189 | 22189 | 175.69 | 596 | 584 | 123.0 |
| B | 5 | 172 | 91111 | 789.35 | 590 | 574 | 114.7 |
| B | 15 | 33 | 47727 | 411.11 | 590 | 574 | 114.7 |
| B | 0 | 245 | 35469 | 304.23 | 590 | 574 | 114.7 |
| C | 15 | 214 | 221640 | 1630.03 | 578 | 582 | 135.6 |
| C | 14 | 254 | 146483 | 1075.84 | 578 | 582 | 135.6 |
| C | 10 | 34 | 132700 | 974.21 | 578 | 582 | 135.6 |
| D | 10 | 118 | 451432 | 3197.43 | 569 | 553 | 141.0 |
| D | 13 | 249 | 217298 | 1537.06 | 569 | 553 | 141.0 |
| D | 9 | 19 | 36057 | 251.78 | 569 | 553 | 141.0 |
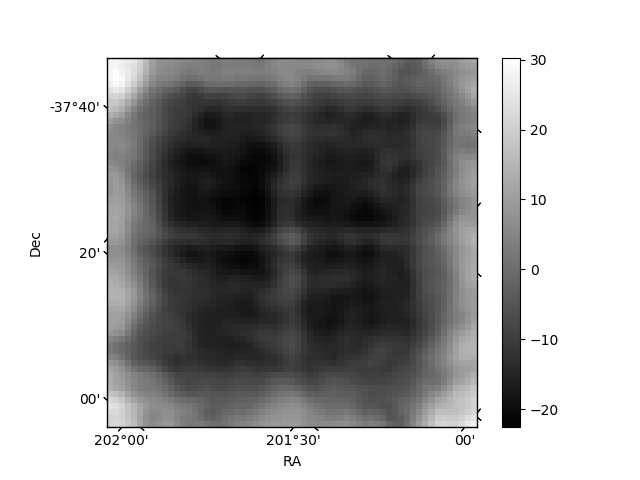
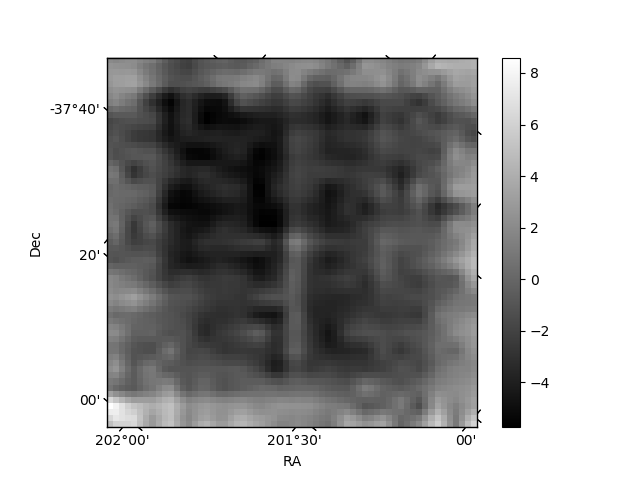
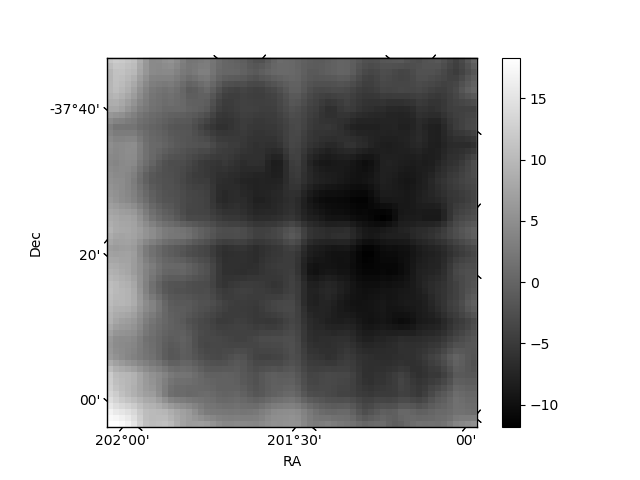
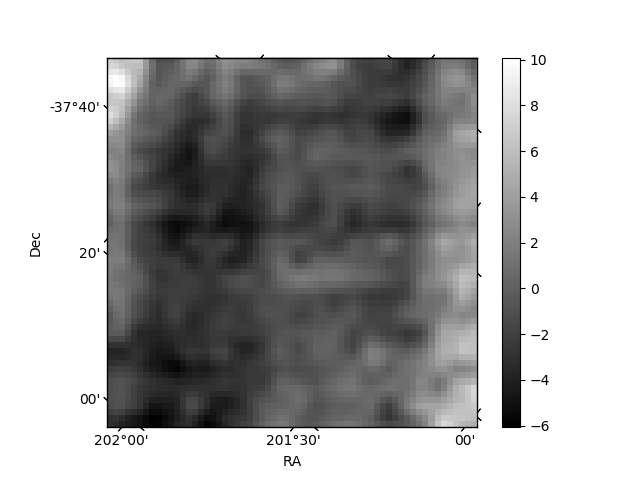
Histogram calculated using DETX and DETY for each event in the final _common_clean file
| Quadrant A | 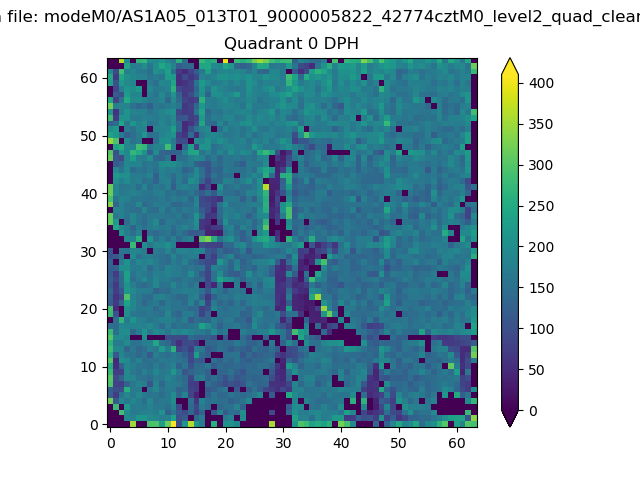 |
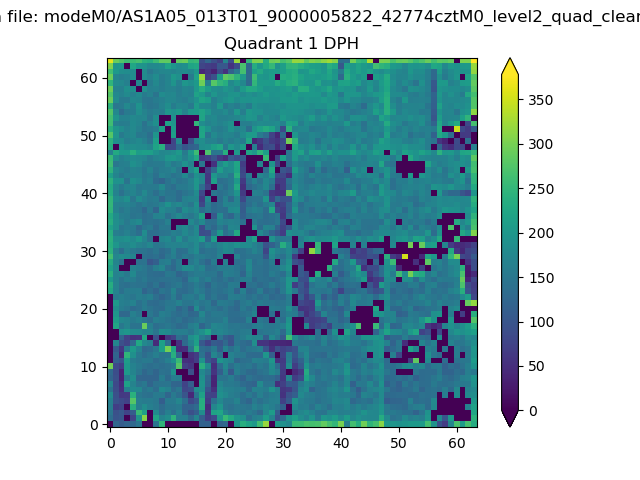 |
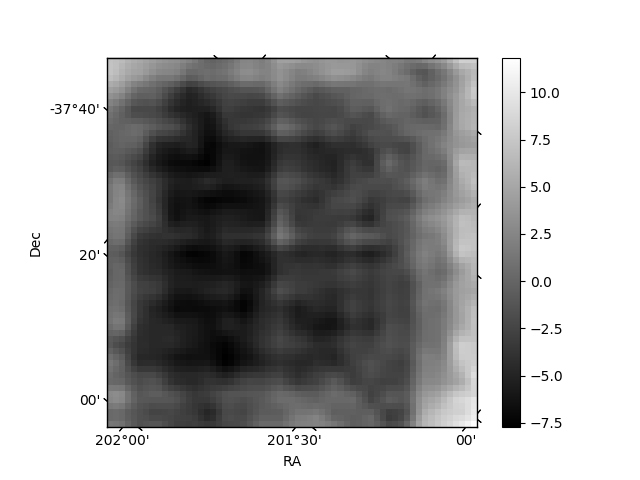
Quadrant B |
|---|---|---|---|
| Quadrant D |  |
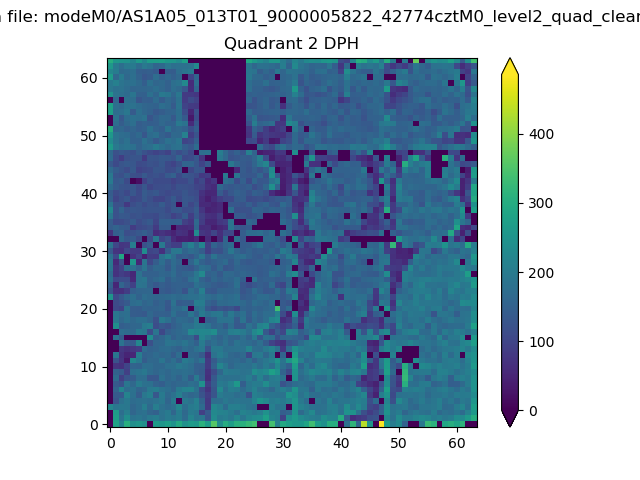 |
Quadrant C |
| Plot type | Count rate plots | Images |
|---|---|---|
| Comparison with Poisson distribution Blue bars denote a histogram of data divided into 1 sec bins. Red curve is a Poisson curve with rate = median count rate of data. |
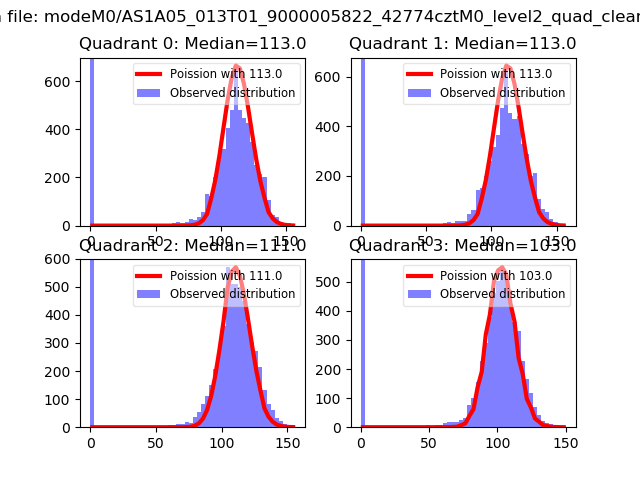 |
 |
| Quadrant-wise count rates Data is divided into 100 sec bins |
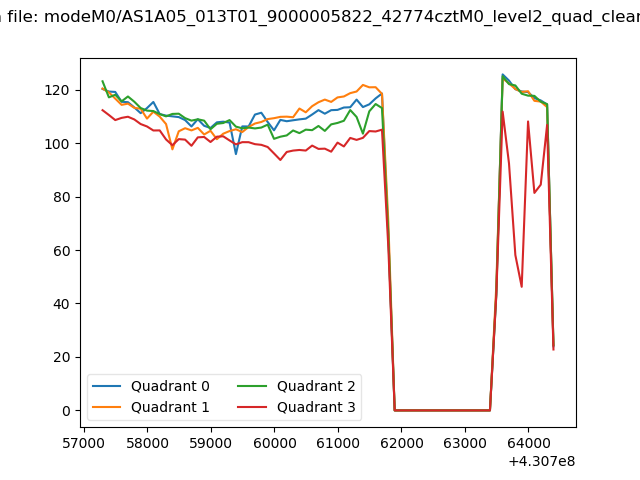 |
|
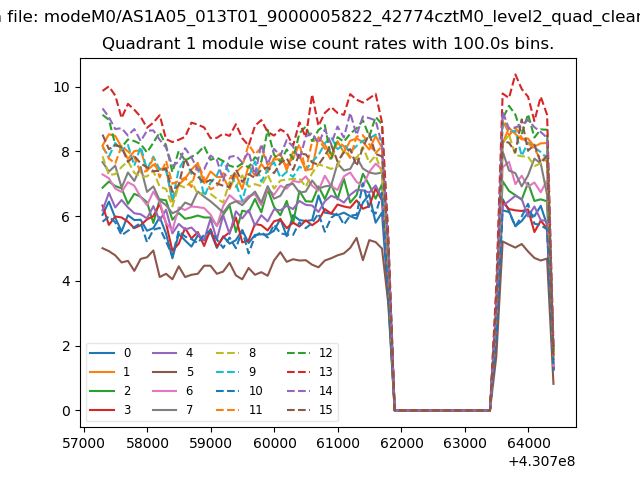
| Module-wise count rates for Quadrant A Data is divided into 100 sec bins |
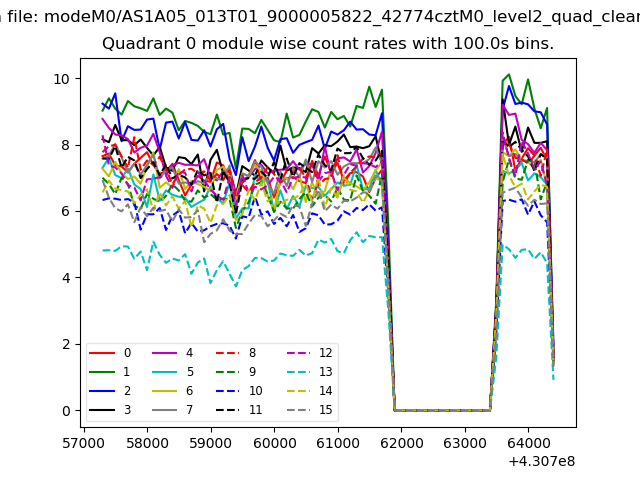 |
 |
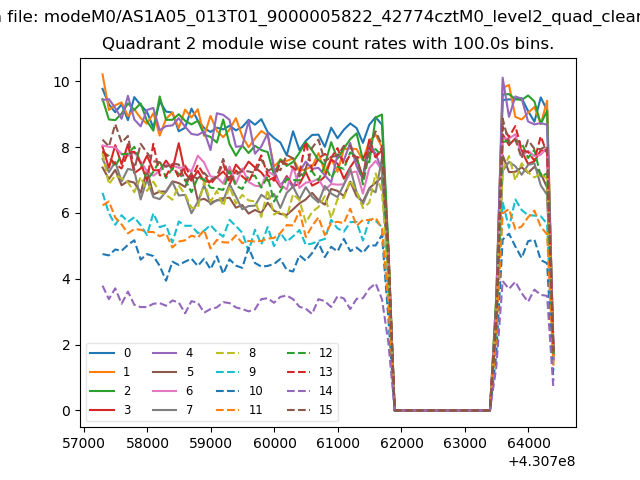
| Module-wise count rates for Quadrant B Data is divided into 100 sec bins |
 |
 |
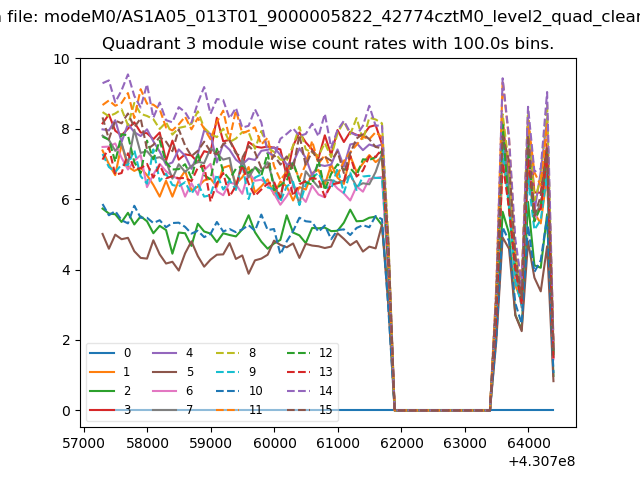
| Module-wise count rates for Quadrant C Data is divided into 100 sec bins |
 |
 |
| Module-wise count rates for Quadrant D Data is divided into 100 sec bins |
 |
 |
| Parameter | Plot |
|---|---|
| CZT HV Monitor | 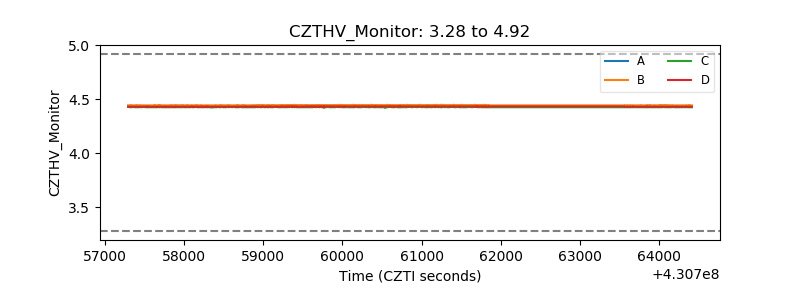 |
| D_VDD | 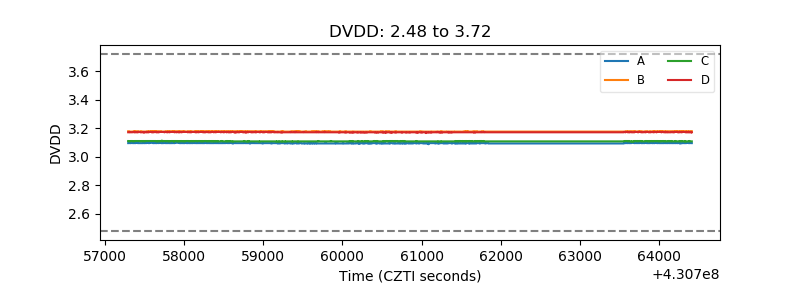 |
| Temperature 1 | 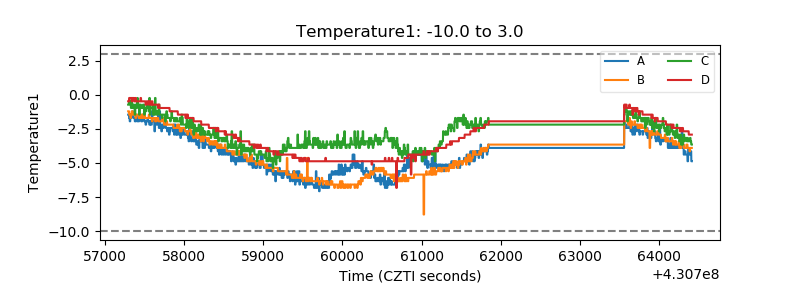 |
| Veto HV Monitor | 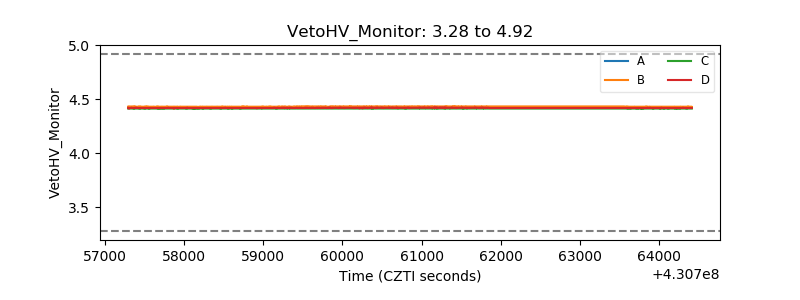 |
| Veto LLD | 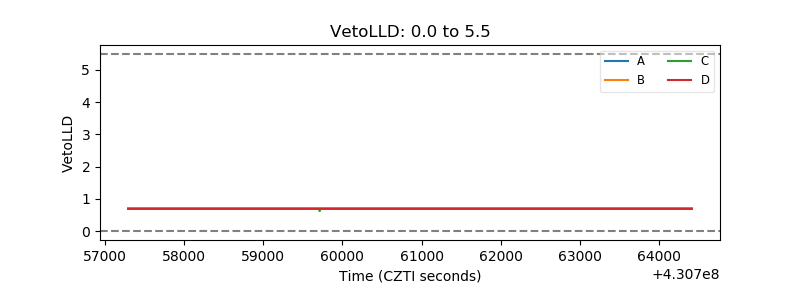 |
| Alpha Counter | 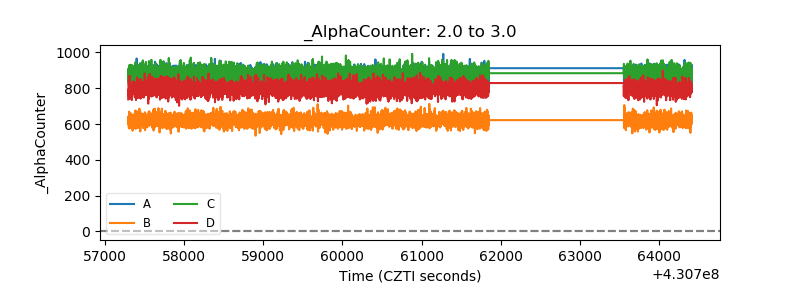 |
| _CPM_Rate | 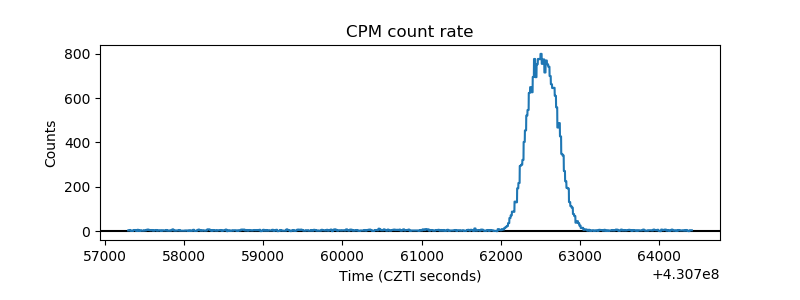 |
| CZT Counter | 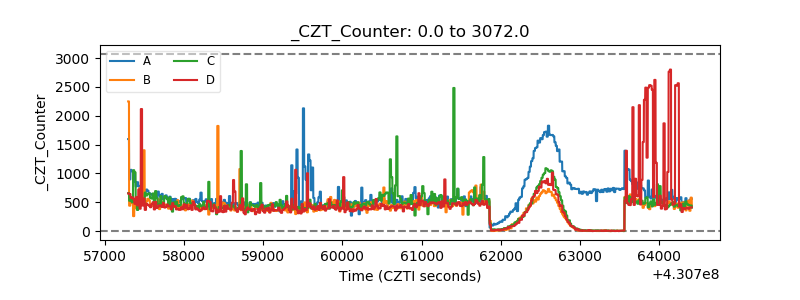 |
| +2.5 Volts monitor | 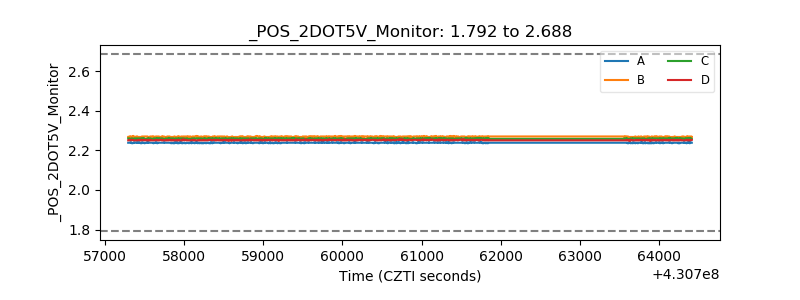 |
| +5 Volts monitor | 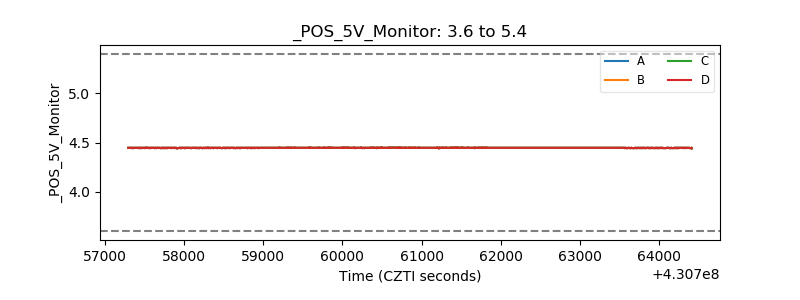 |
| _ROLL_ROT | 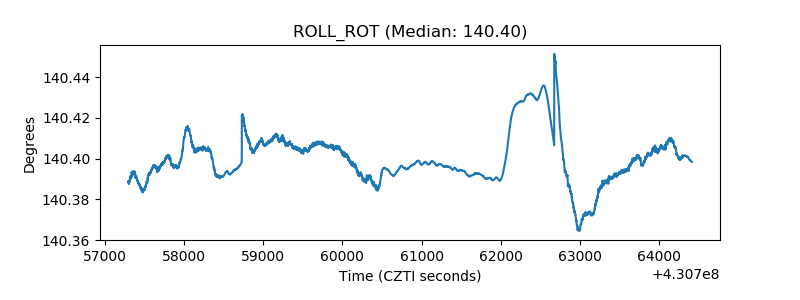 |
| _Roll_DEC | 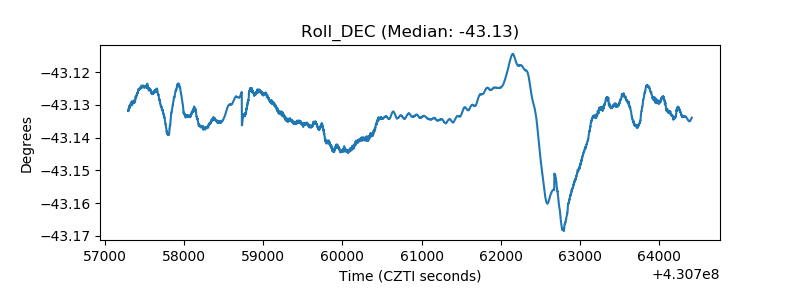 |
| _Roll_RA | 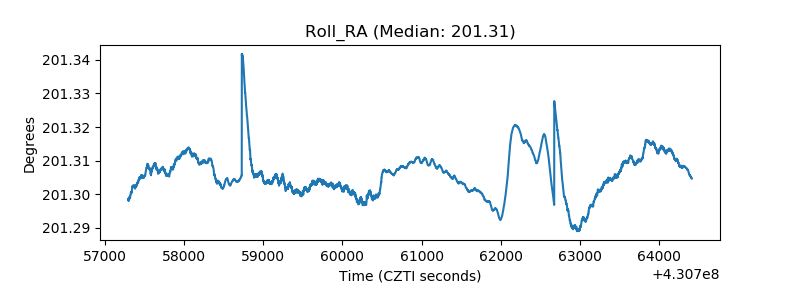 |
| Veto Counter | 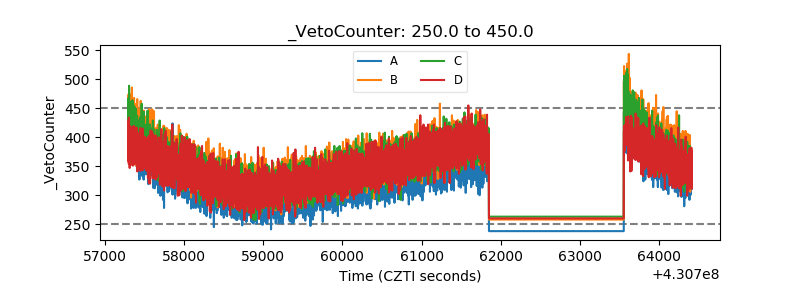 |