| Param | Original file | Final file |
|---|---|---|
| Filename | modeM0/AS1A05_013T01_9000005822_42776cztM0_level2.fits | modeM0/AS1A05_013T01_9000005822_42776cztM0_level2_quad_clean.evt |
| Size (bytes) | 325,586,880 | 89,461,440 |
| Size | 310.5 MB | 85.3 MB |
| Events in quadrant A | 2,928,817 | 610,978 |
| Events in quadrant B | 2,808,195 | 599,980 |
| Events in quadrant C | 2,650,405 | 595,241 |
| Events in quadrant D | 3,253,176 | 532,953 |
| Mode M0 | |||
|---|---|---|---|
| Quadrant | BADHDUFLAG | Total packets | Discarded packets |
| A | 0 | 11807 | 2 |
| B | 0 | 11982 | 2 |
| C | 0 | 11205 | 2 |
| D | 0 | 13572 | 4 |
| Mode M9 | |||
|---|---|---|---|
| Quadrant | BADHDUFLAG | Total packets | Discarded packets |
| A | 0 | 18 | 0 |
| B | 0 | 19 | 0 |
| C | 0 | 19 | 0 |
| D | 0 | 19 | 0 |
| Mode SS | |||
|---|---|---|---|
| Quadrant | BADHDUFLAG | Total packets | Discarded packets |
| A | 0 | 108 | 0 |
| B | 0 | 108 | 0 |
| C | 0 | 108 | 0 |
| D | 0 | 108 | 0 |
| Quadrant | Total seconds | Saturated seconds | Saturation percentage |
|---|---|---|---|
| A | 5281 | 13 | 0.246165% |
| B | 5281 | 153 | 2.897179% |
| C | 5281 | 37 | 0.700625% |
| D | 5280 | 224 | 4.242424% |
Noise dominated data is calculated using 1-second bins in cleaned event files. If a bin has >2000 counts, and if more than 50% of those come from <1% of pixels, then it is considered to be noise-dominated and hence unusable.
| Quadrant | # 1 sec bins | Bins with >0 counts | Bins with >2000 counts | High rate bins dominated by noise | Noise dominated (total time) | Noise dominated (detector-on time) | Marked lightcurve |
|---|---|---|---|---|---|---|---|
| A | 7103 | 5282 | 6 | 6 | 0.08% | 0.11% | 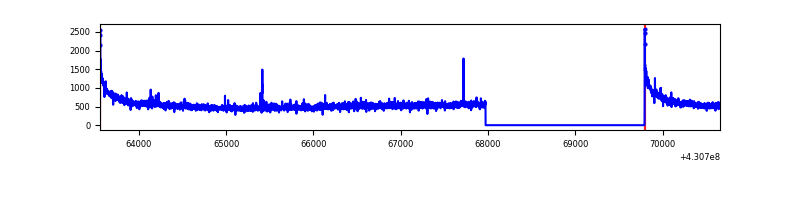 |
| B | 7103 | 5282 | 108 | 108 | 1.52% | 2.04% | 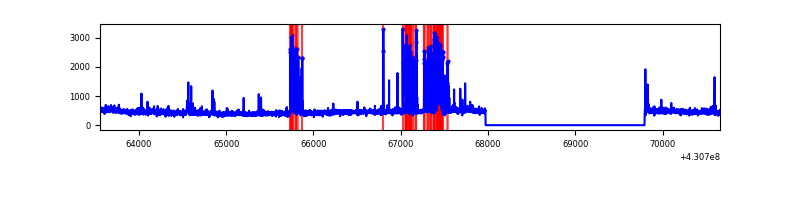 |
| C | 7103 | 5282 | 38 | 38 | 0.53% | 0.72% | 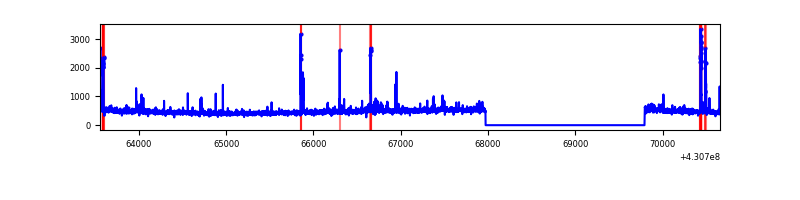 |
| D | 7102 | 5281 | 217 | 217 | 3.06% | 4.11% | 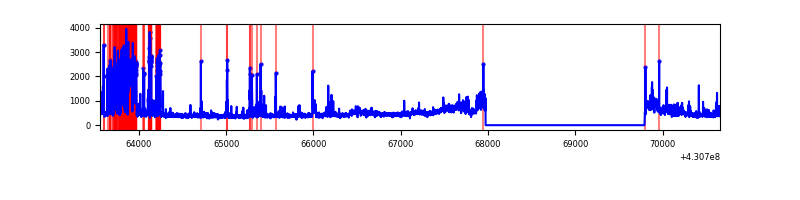 |
Top three noisy pixels from each quadrant. If the there are fewer than three noisy pixels in the level2.evt file, extra rows are filled as -1
| Pixel properties | Quadrant properties | ||||||
|---|---|---|---|---|---|---|---|
| Quadrant | DetID | PixID | Counts | Sigma | Mean | Median | Sigma |
| A | 10 | 83 | 584302 | 4807.25 | 589 | 576 | 121.4 |
| A | 13 | 6 | 21349 | 171.08 | 589 | 576 | 121.4 |
| A | 12 | 189 | 14813 | 117.25 | 589 | 576 | 121.4 |
| B | 0 | 229 | 370898 | 3279.98 | 577 | 560 | 112.9 |
| B | 0 | 156 | 102884 | 906.25 | 577 | 560 | 112.9 |
| B | 0 | 245 | 48754 | 426.84 | 577 | 560 | 112.9 |
| C | 15 | 214 | 213947 | 1593.44 | 571 | 576 | 133.9 |
| C | 14 | 254 | 124563 | 925.93 | 571 | 576 | 133.9 |
| C | 8 | 79 | 49862 | 368.07 | 571 | 576 | 133.9 |
| D | 10 | 118 | 451443 | 3279.76 | 556 | 540 | 137.5 |
| D | 1 | 20 | 311458 | 2261.54 | 556 | 540 | 137.5 |
| D | 13 | 249 | 193991 | 1407.12 | 556 | 540 | 137.5 |
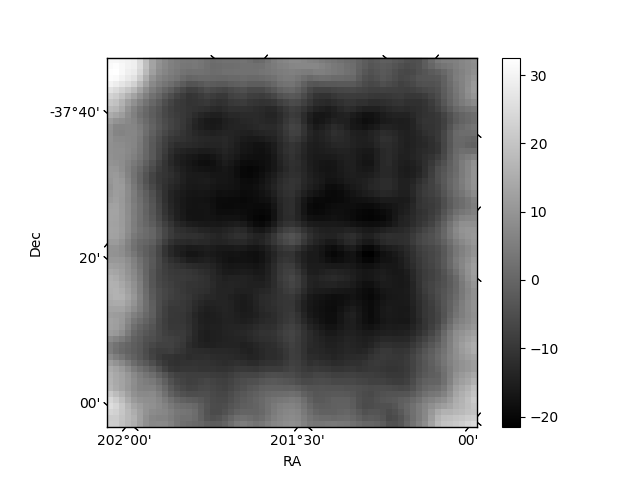
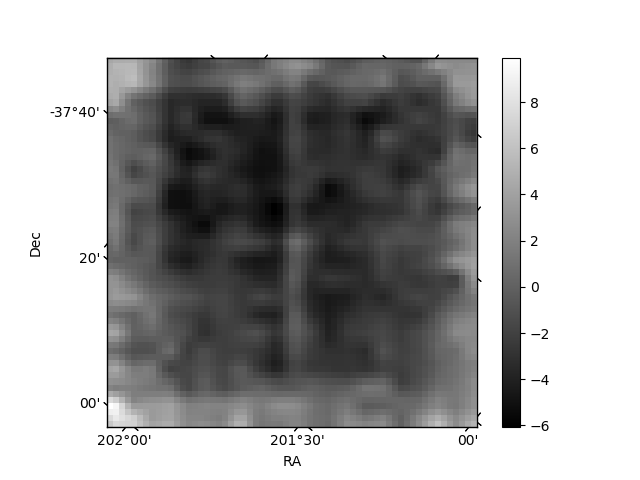
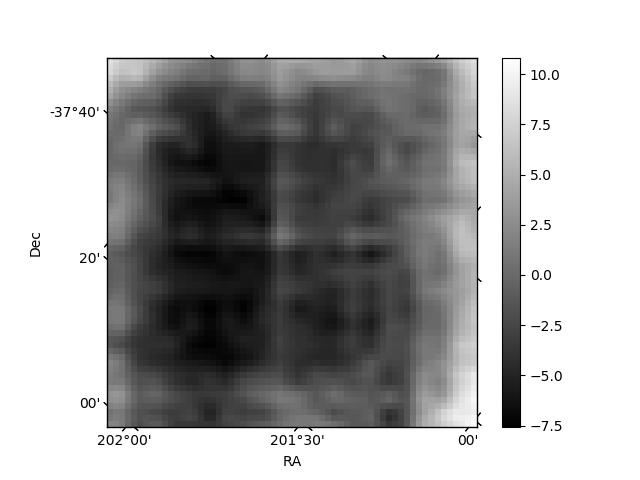
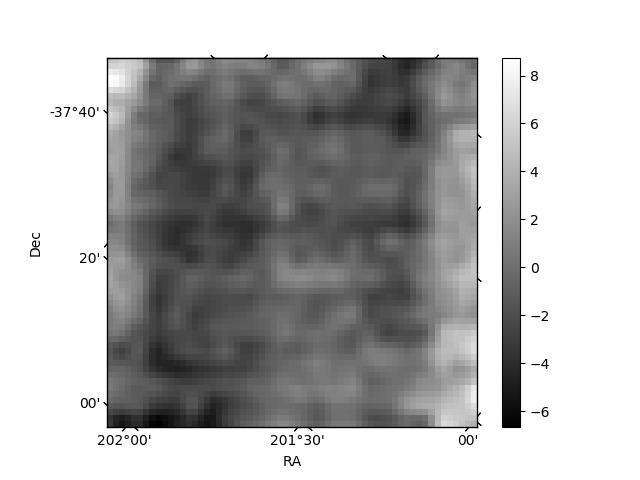
Histogram calculated using DETX and DETY for each event in the final _common_clean file
| Quadrant A | 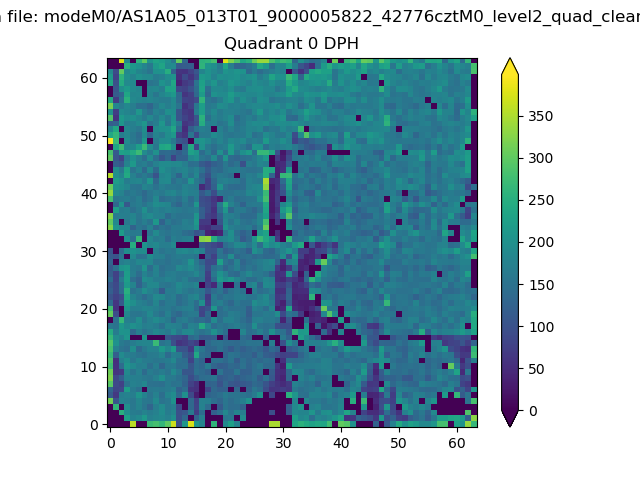 |
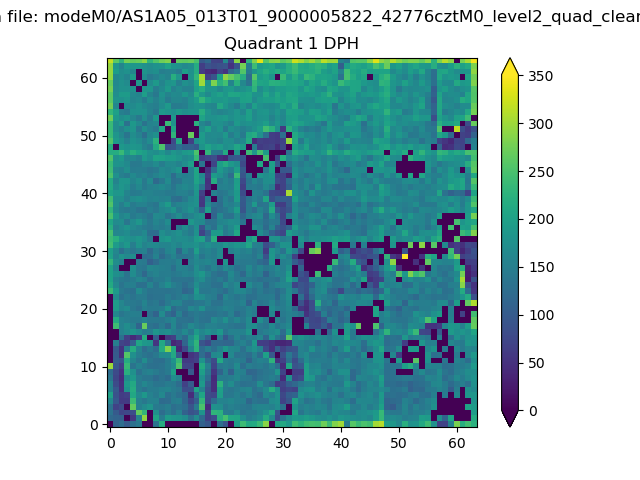 |
Quadrant B |
|---|---|---|---|
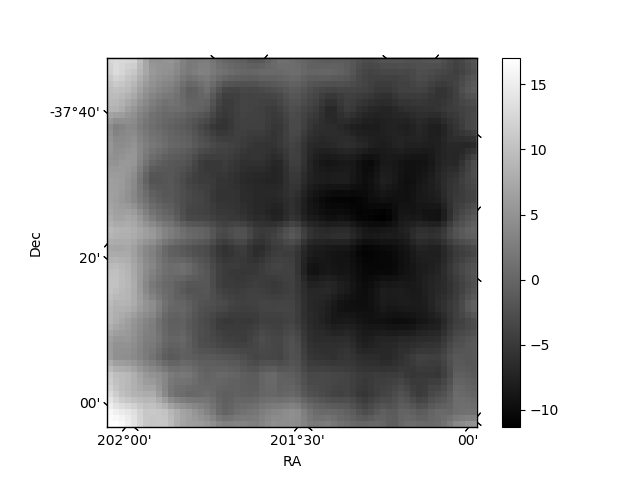
| Quadrant D | 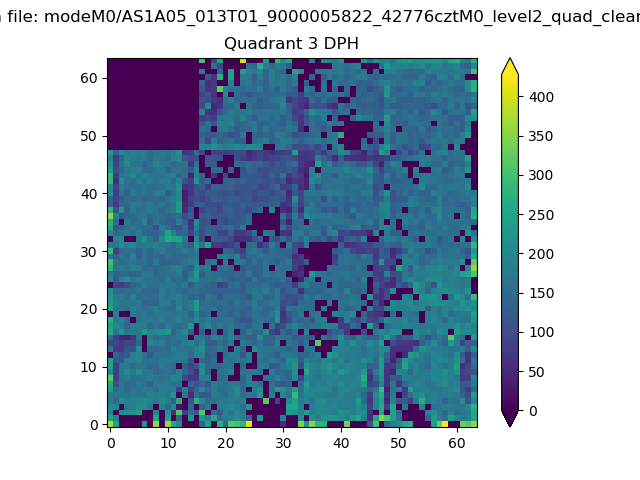 |
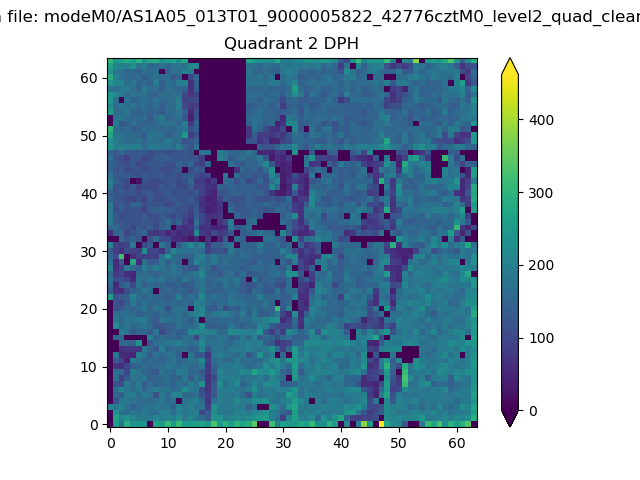 |
Quadrant C |
| Plot type | Count rate plots | Images |
|---|---|---|
| Comparison with Poisson distribution Blue bars denote a histogram of data divided into 1 sec bins. Red curve is a Poisson curve with rate = median count rate of data. |
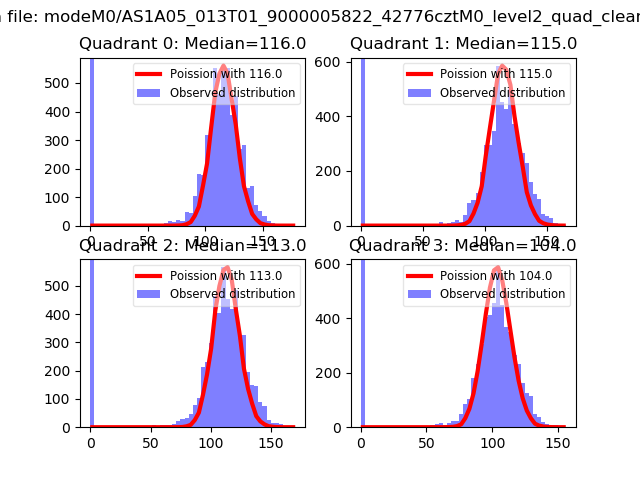 |
 |
| Quadrant-wise count rates Data is divided into 100 sec bins |
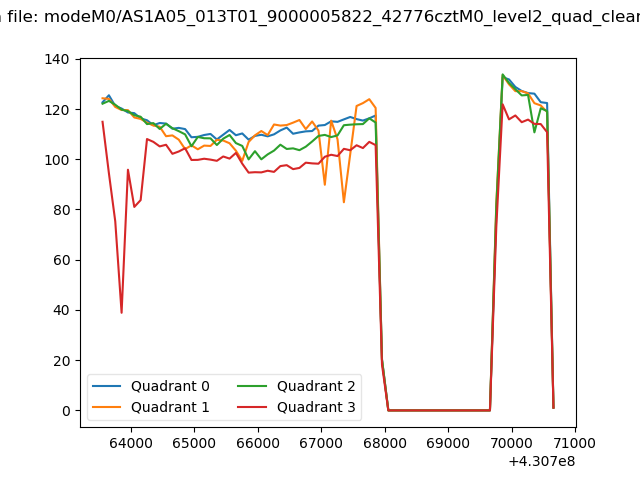 |
|
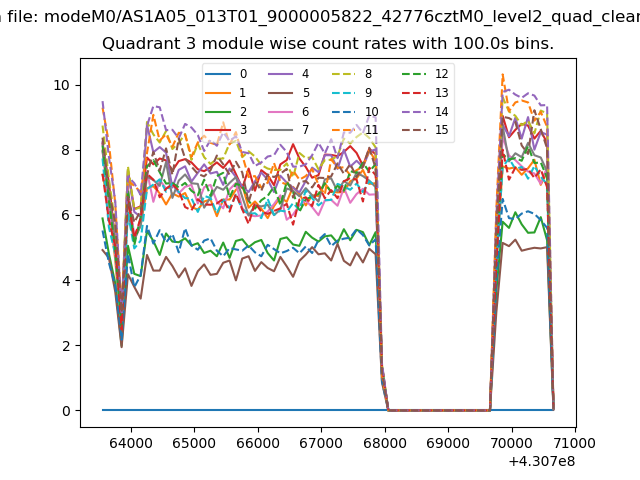
| Module-wise count rates for Quadrant A Data is divided into 100 sec bins |
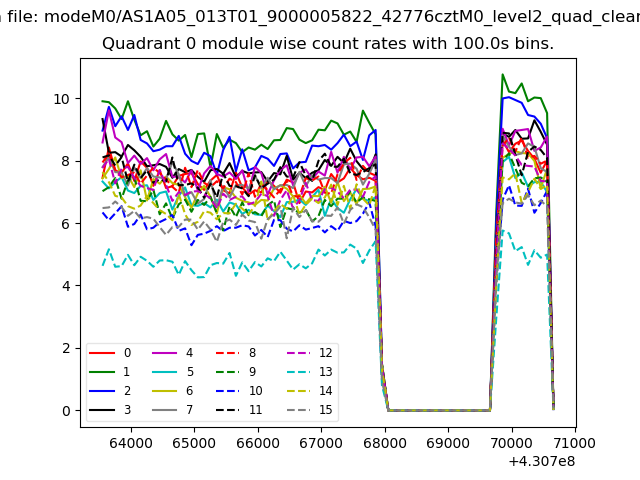 |
 |
| Module-wise count rates for Quadrant B Data is divided into 100 sec bins |
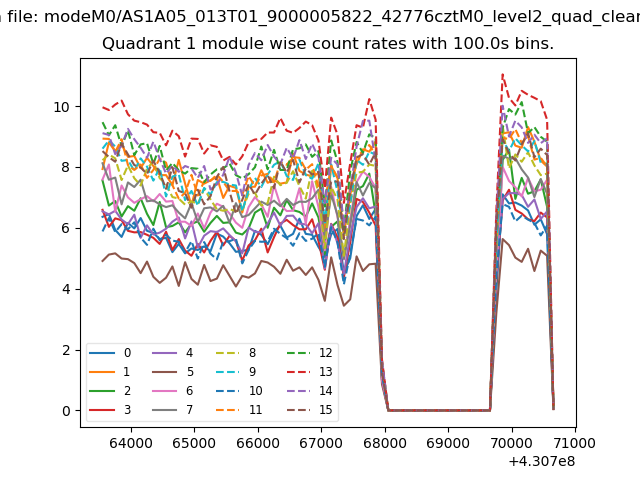 |
 |
| Module-wise count rates for Quadrant C Data is divided into 100 sec bins |
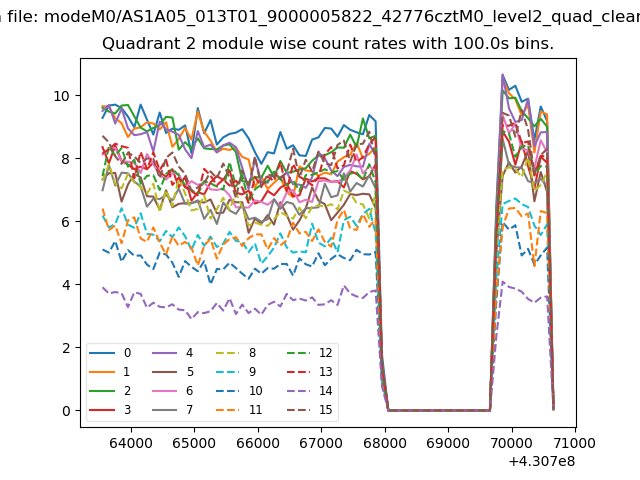 |
 |
| Module-wise count rates for Quadrant D Data is divided into 100 sec bins |
 |
 |
| Parameter | Plot |
|---|---|
| CZT HV Monitor | 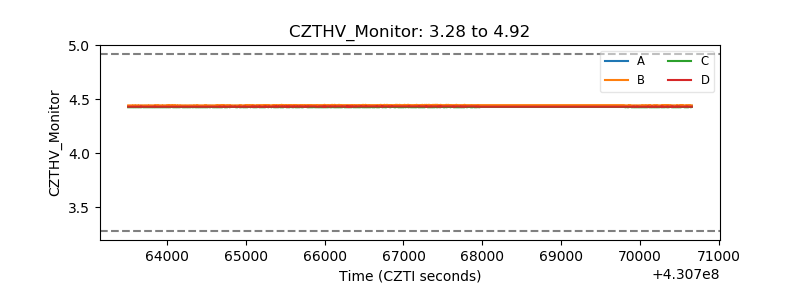 |
| D_VDD | 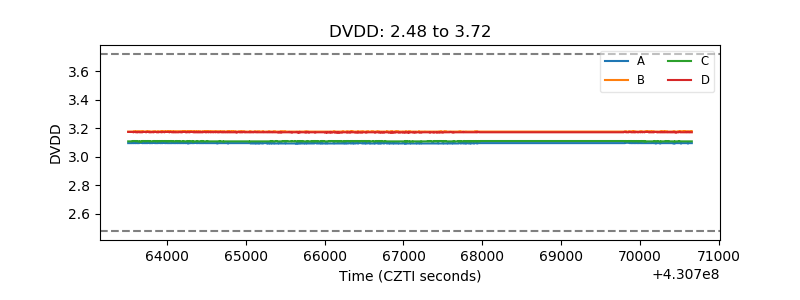 |
| Temperature 1 |  |
| Veto HV Monitor | 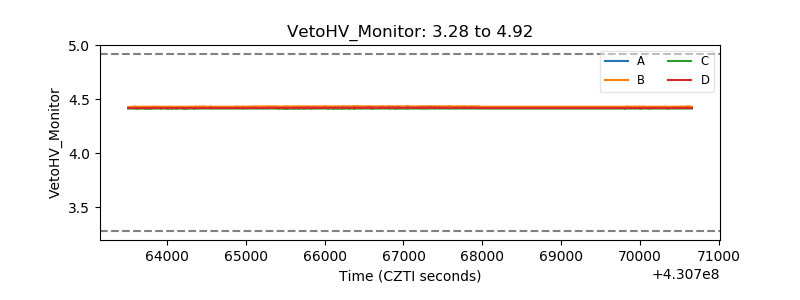 |
| Veto LLD | 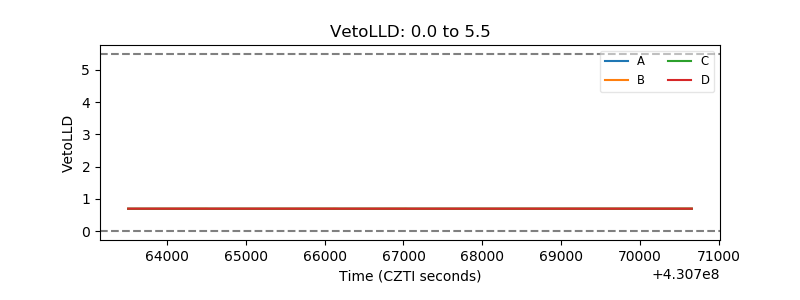 |
| Alpha Counter | 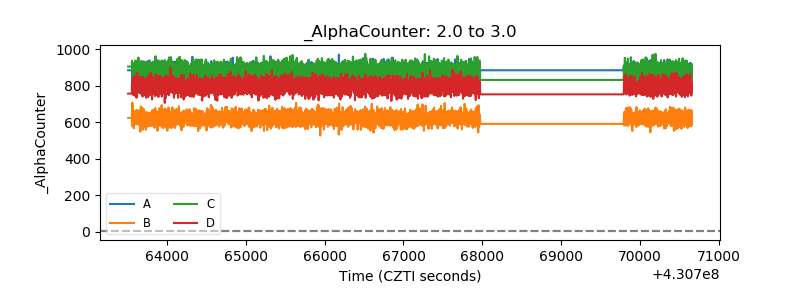 |
| _CPM_Rate | 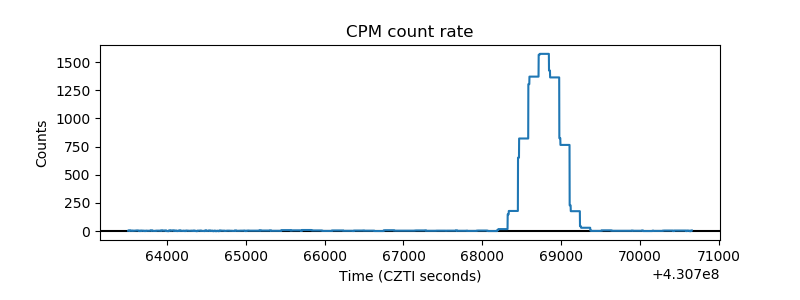 |
| CZT Counter | 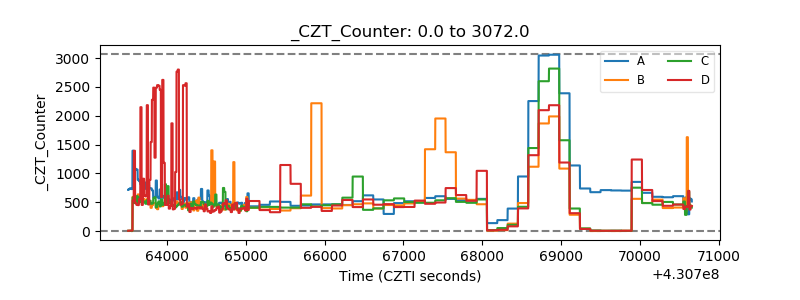 |
| +2.5 Volts monitor | 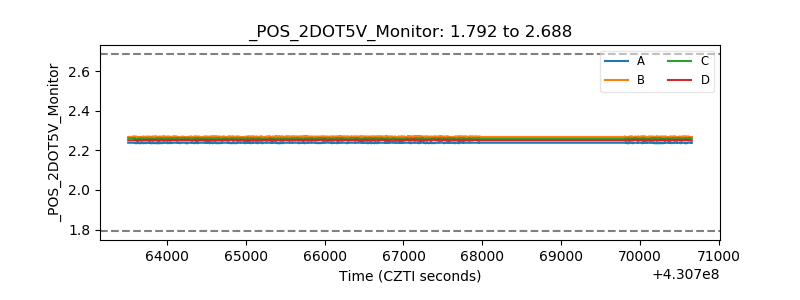 |
| +5 Volts monitor | 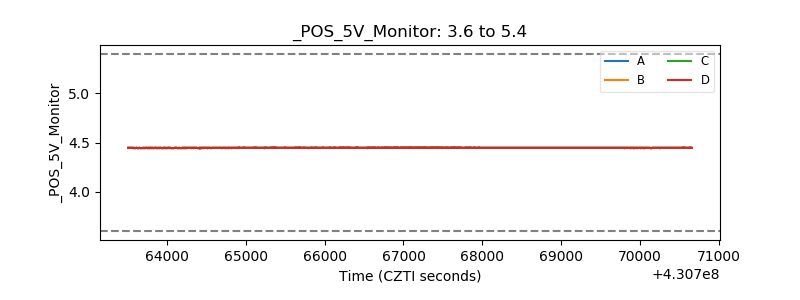 |
| _ROLL_ROT | 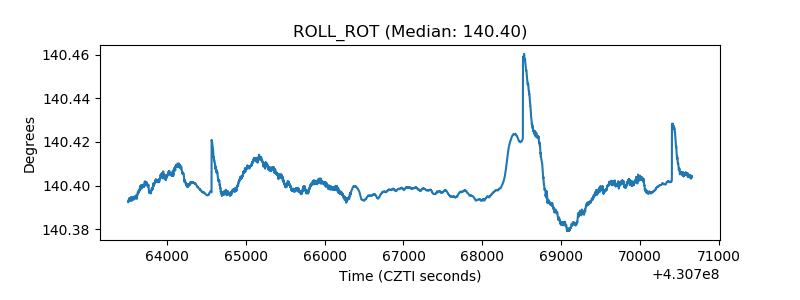 |
| _Roll_DEC | 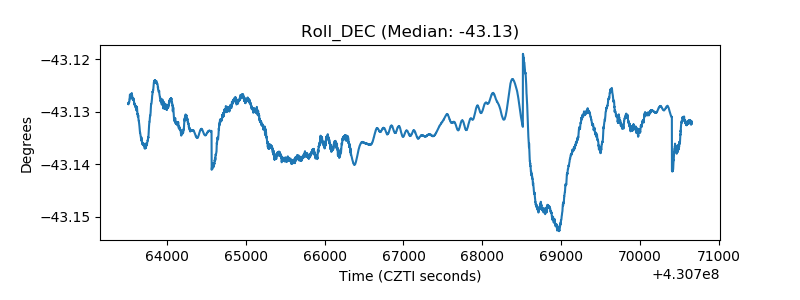 |
| _Roll_RA | 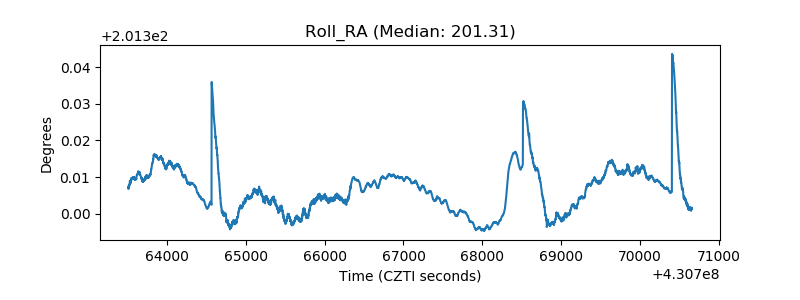 |
| Veto Counter | 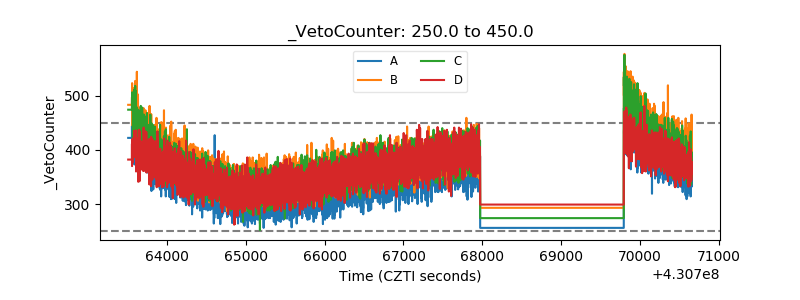 |