| Param | Original file | Final file |
|---|---|---|
| Filename | modeM0/AS1A05_013T01_9000005822_42777cztM0_level2.fits | modeM0/AS1A05_013T01_9000005822_42777cztM0_level2_quad_clean.evt |
| Size (bytes) | 300,188,160 | 89,167,680 |
| Size | 286.3 MB | 85.0 MB |
| Events in quadrant A | 2,878,884 | 608,172 |
| Events in quadrant B | 2,637,891 | 604,688 |
| Events in quadrant C | 2,532,251 | 591,215 |
| Events in quadrant D | 2,668,147 | 540,940 |
| Mode M0 | |||
|---|---|---|---|
| Quadrant | BADHDUFLAG | Total packets | Discarded packets |
| A | 0 | 11456 | 2 |
| B | 0 | 11151 | 2 |
| C | 0 | 10552 | 2 |
| D | 0 | 11592 | 2 |
| Mode M9 | |||
|---|---|---|---|
| Quadrant | BADHDUFLAG | Total packets | Discarded packets |
| A | 0 | 21 | 0 |
| B | 0 | 22 | 0 |
| C | 0 | 22 | 0 |
| D | 0 | 22 | 0 |
| Mode SS | |||
|---|---|---|---|
| Quadrant | BADHDUFLAG | Total packets | Discarded packets |
| A | 0 | 104 | 0 |
| B | 0 | 104 | 0 |
| C | 0 | 104 | 0 |
| D | 0 | 104 | 0 |
| Quadrant | Total seconds | Saturated seconds | Saturation percentage |
|---|---|---|---|
| A | 5064 | 17 | 0.335703% |
| B | 5064 | 112 | 2.211690% |
| C | 5064 | 29 | 0.572670% |
| D | 5064 | 62 | 1.224329% |
Noise dominated data is calculated using 1-second bins in cleaned event files. If a bin has >2000 counts, and if more than 50% of those come from <1% of pixels, then it is considered to be noise-dominated and hence unusable.
| Quadrant | # 1 sec bins | Bins with >0 counts | Bins with >2000 counts | High rate bins dominated by noise | Noise dominated (total time) | Noise dominated (detector-on time) | Marked lightcurve |
|---|---|---|---|---|---|---|---|
| A | 7007 | 5065 | 6 | 6 | 0.09% | 0.12% | 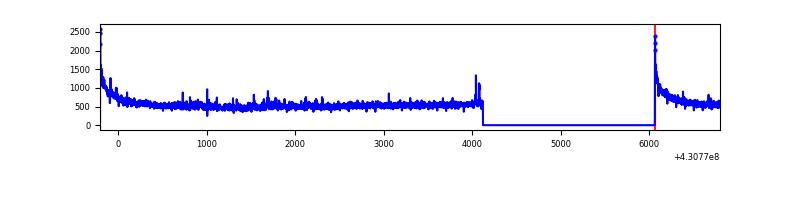 |
| B | 7007 | 5065 | 80 | 80 | 1.14% | 1.58% | 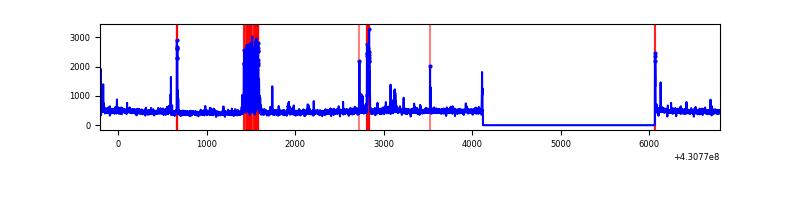 |
| C | 7007 | 5065 | 22 | 22 | 0.31% | 0.43% | 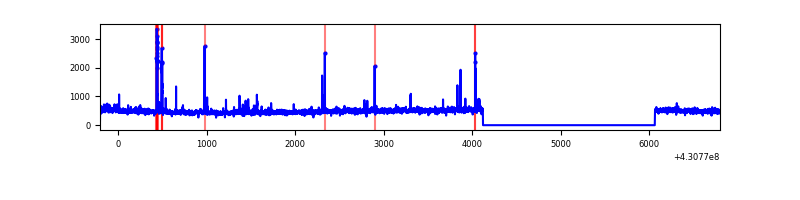 |
| D | 7007 | 5065 | 61 | 61 | 0.87% | 1.20% | 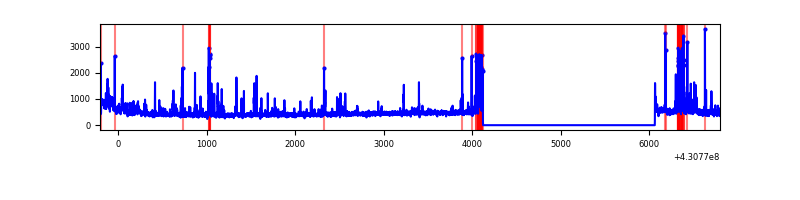 |
Top three noisy pixels from each quadrant. If the there are fewer than three noisy pixels in the level2.evt file, extra rows are filled as -1
| Pixel properties | Quadrant properties | ||||||
|---|---|---|---|---|---|---|---|
| Quadrant | DetID | PixID | Counts | Sigma | Mean | Median | Sigma |
| A | 10 | 83 | 550646 | 4642.5 | 578 | 566 | 118.5 |
| A | 12 | 189 | 45980 | 383.28 | 578 | 566 | 118.5 |
| A | 13 | 6 | 25539 | 210.76 | 578 | 566 | 118.5 |
| B | 0 | 156 | 198239 | 1817.75 | 571 | 556 | 108.8 |
| B | 5 | 172 | 94993 | 868.37 | 571 | 556 | 108.8 |
| B | 0 | 245 | 45124 | 409.82 | 571 | 556 | 108.8 |
| C | 15 | 214 | 204873 | 1554.72 | 562 | 569 | 131.4 |
| C | 14 | 254 | 101717 | 769.72 | 562 | 569 | 131.4 |
| C | 8 | 79 | 31042 | 231.9 | 562 | 569 | 131.4 |
| D | 2 | 249 | 176826 | 1288.16 | 557 | 541 | 136.8 |
| D | 12 | 233 | 110374 | 802.58 | 557 | 541 | 136.8 |
| D | 13 | 249 | 106829 | 776.68 | 557 | 541 | 136.8 |
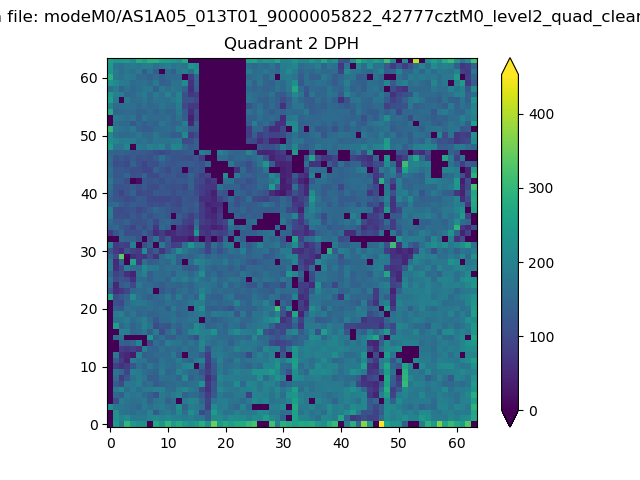
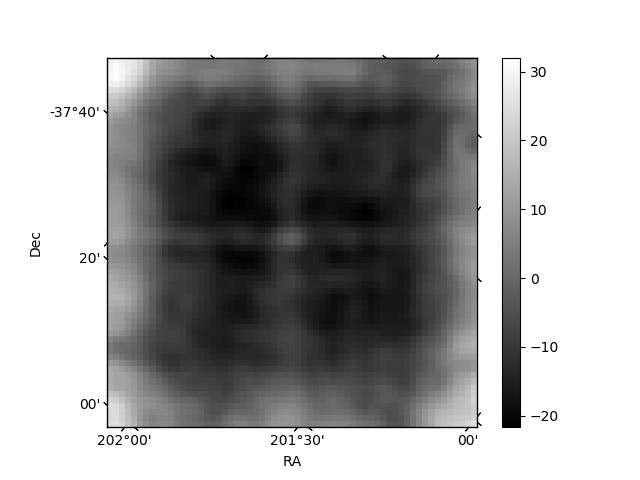
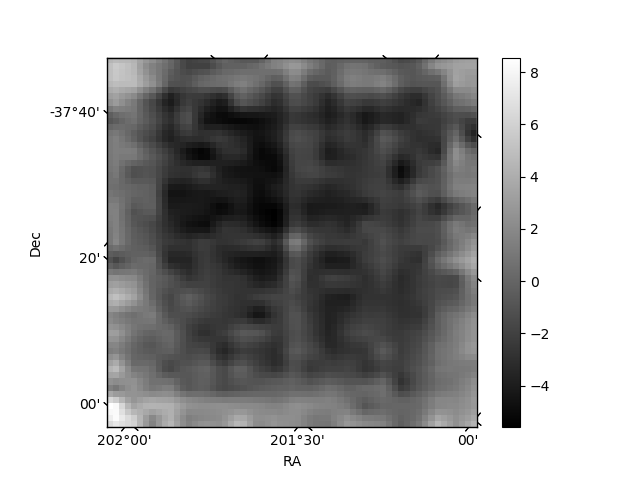
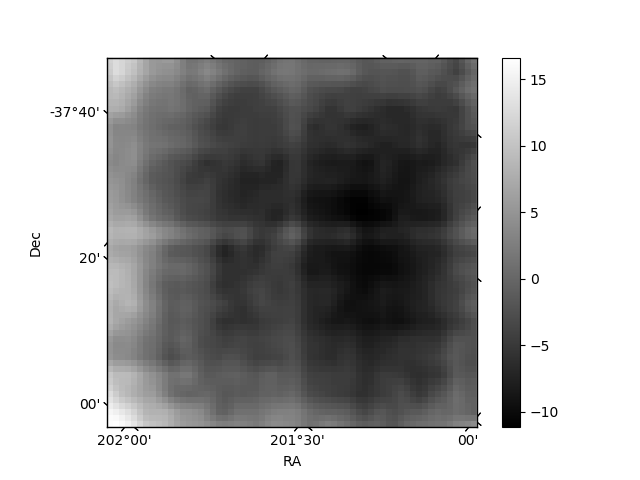
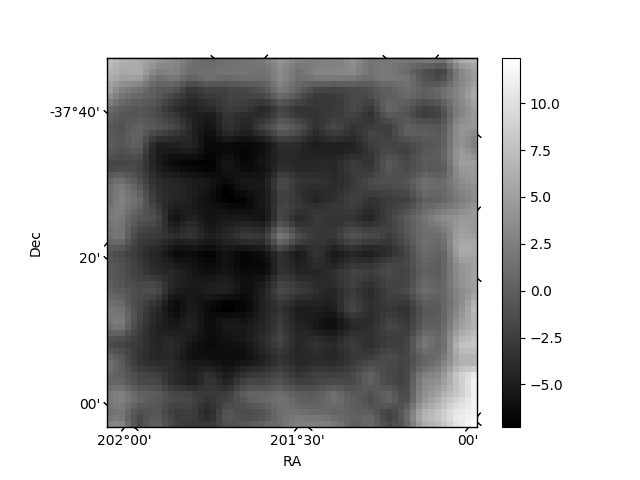
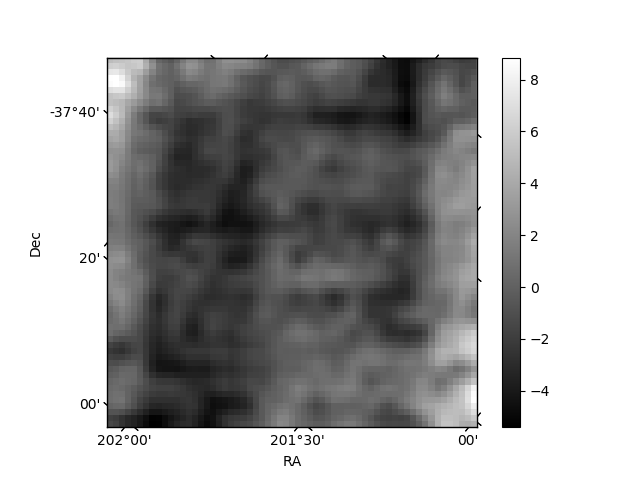
Histogram calculated using DETX and DETY for each event in the final _common_clean file
| Quadrant A | 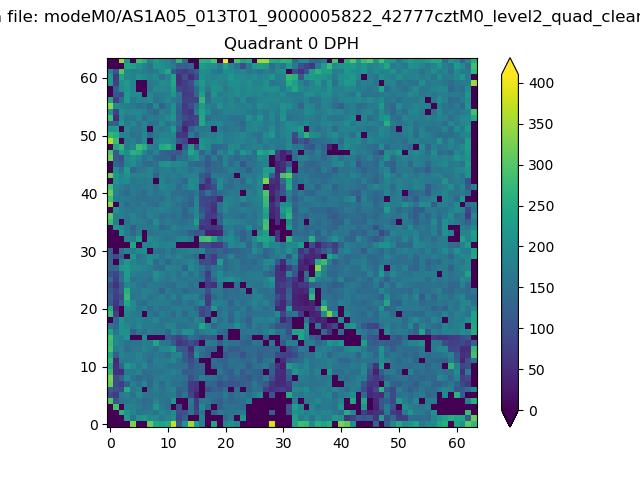 |
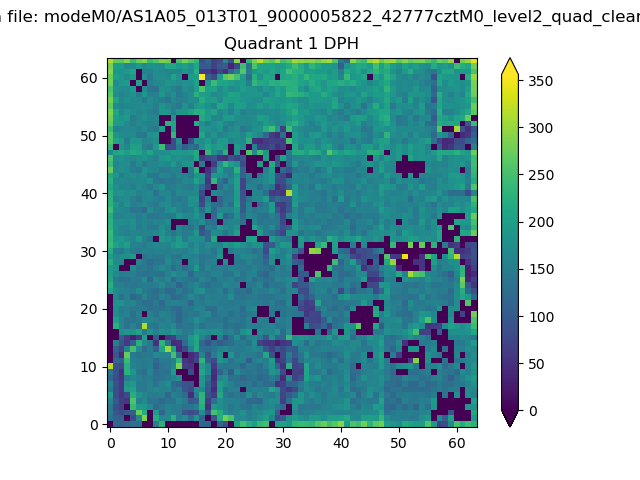 |
Quadrant B |
|---|---|---|---|
| Quadrant D | 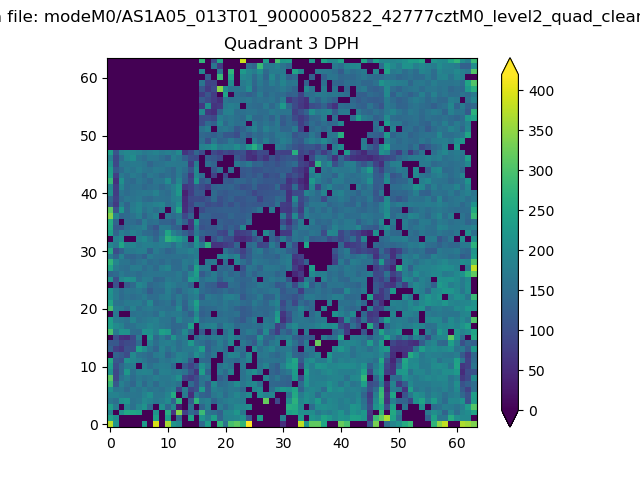 |
 |
Quadrant C |
| Plot type | Count rate plots | Images |
|---|---|---|
| Comparison with Poisson distribution Blue bars denote a histogram of data divided into 1 sec bins. Red curve is a Poisson curve with rate = median count rate of data. |
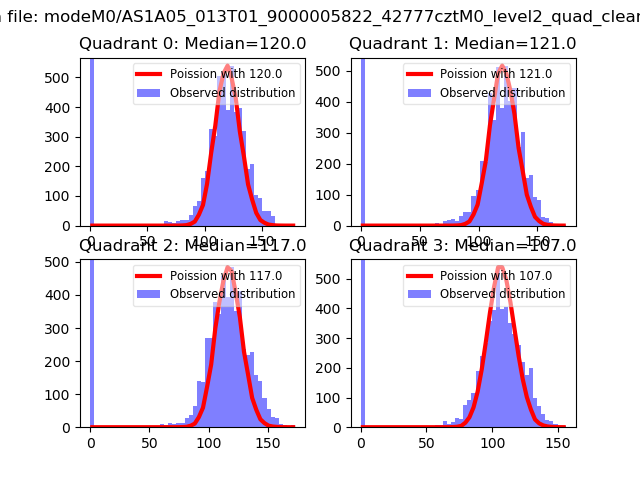 |
 |
| Quadrant-wise count rates Data is divided into 100 sec bins |
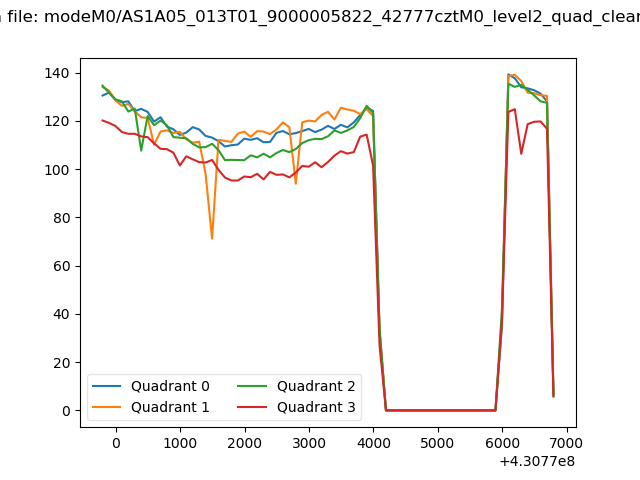 |
|
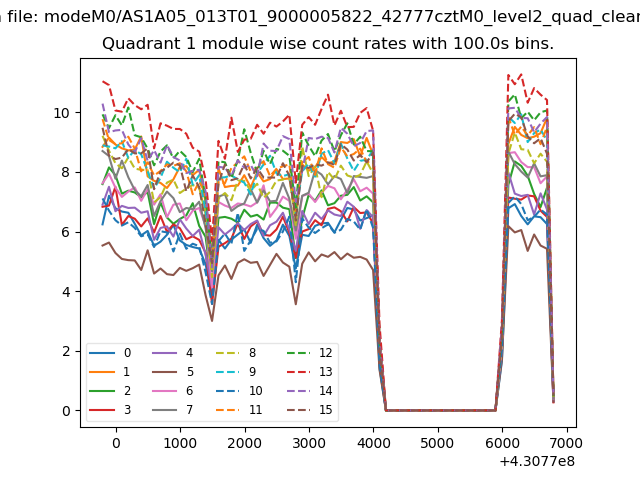
| Module-wise count rates for Quadrant A Data is divided into 100 sec bins |
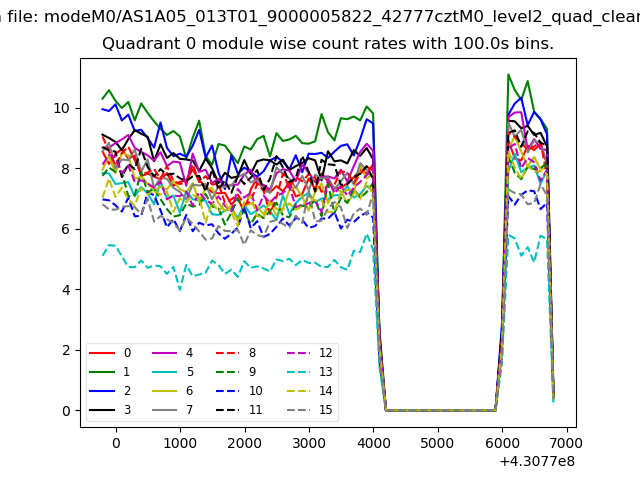 |
 |
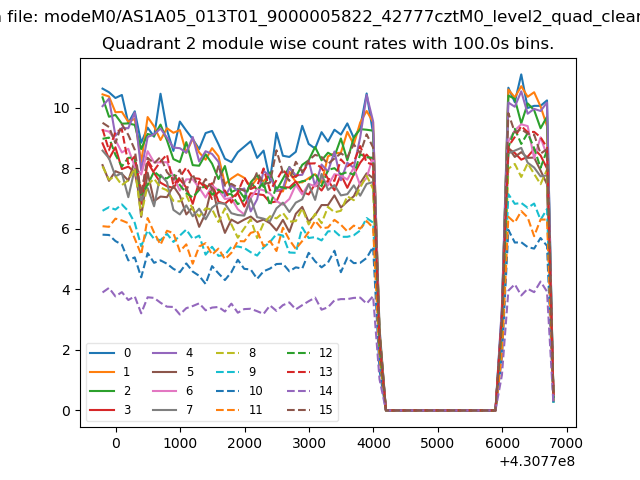
| Module-wise count rates for Quadrant B Data is divided into 100 sec bins |
 |
 |
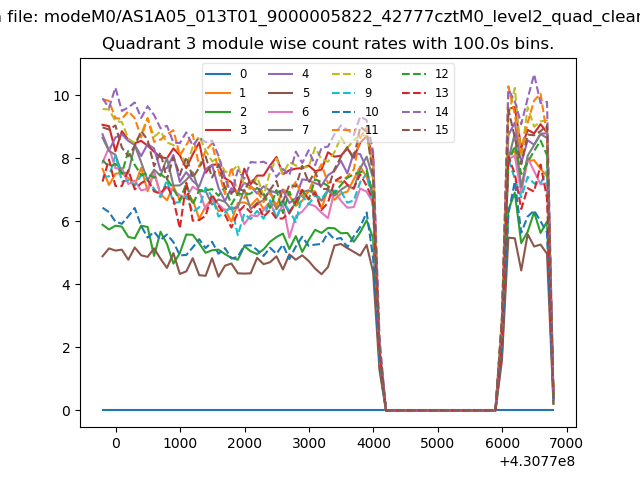
| Module-wise count rates for Quadrant C Data is divided into 100 sec bins |
 |
 |
| Module-wise count rates for Quadrant D Data is divided into 100 sec bins |
 |
 |
| Parameter | Plot |
|---|---|
| CZT HV Monitor | 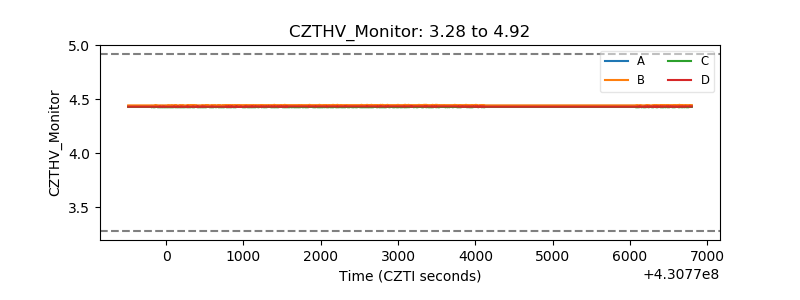 |
| D_VDD | 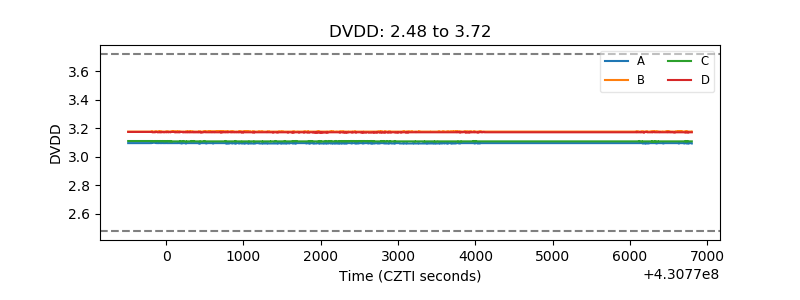 |
| Temperature 1 | 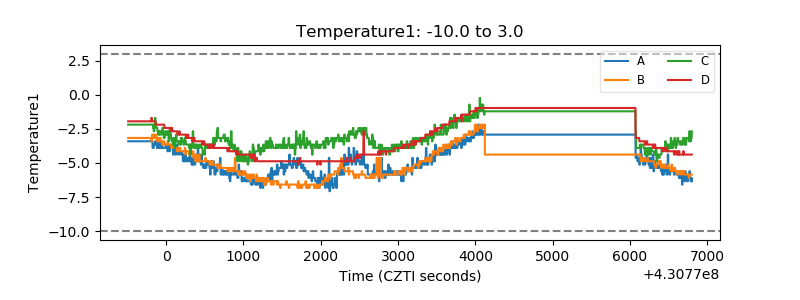 |
| Veto HV Monitor | 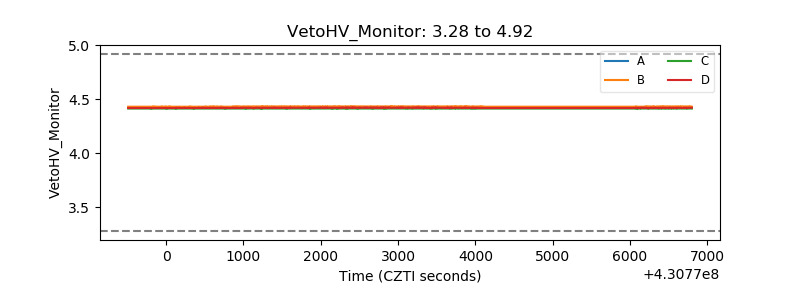 |
| Veto LLD | 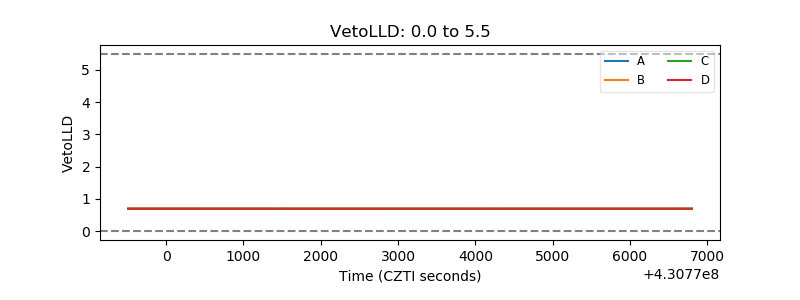 |
| Alpha Counter | 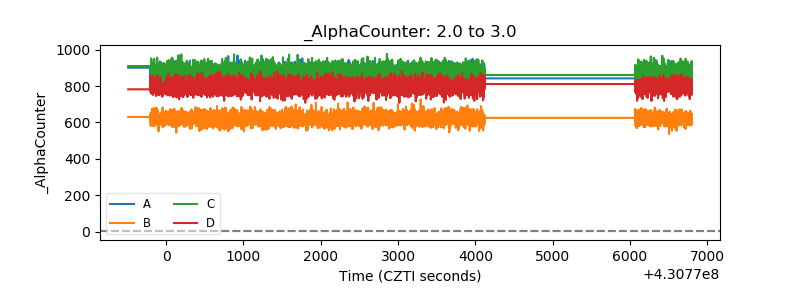 |
| _CPM_Rate | 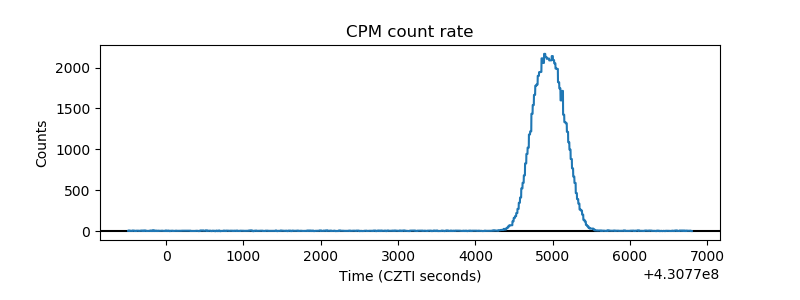 |
| CZT Counter | 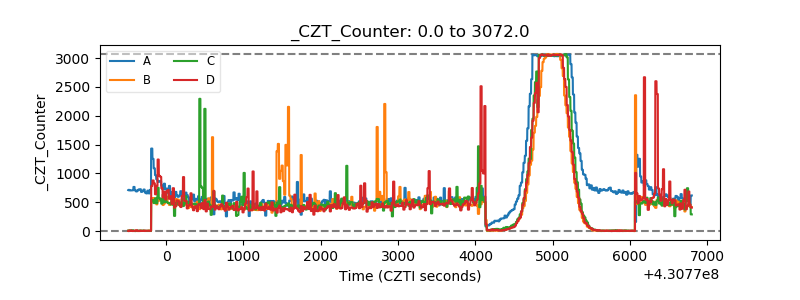 |
| +2.5 Volts monitor |  |
| +5 Volts monitor | 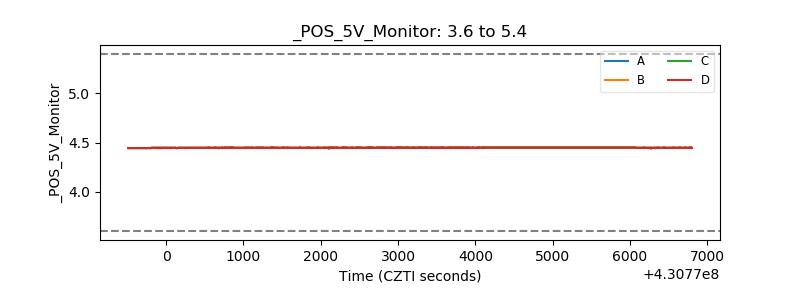 |
| _ROLL_ROT | 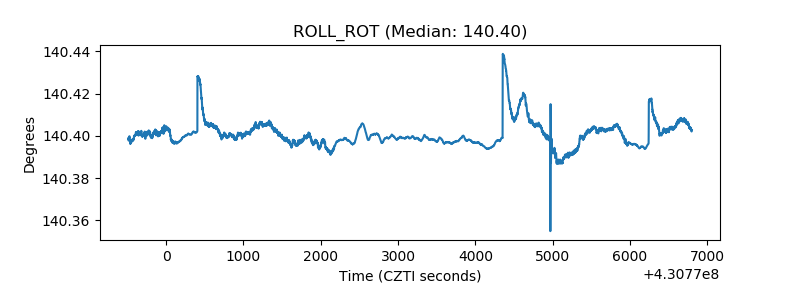 |
| _Roll_DEC | 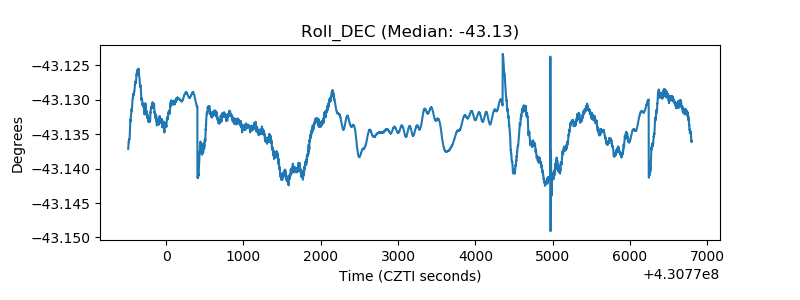 |
| _Roll_RA | 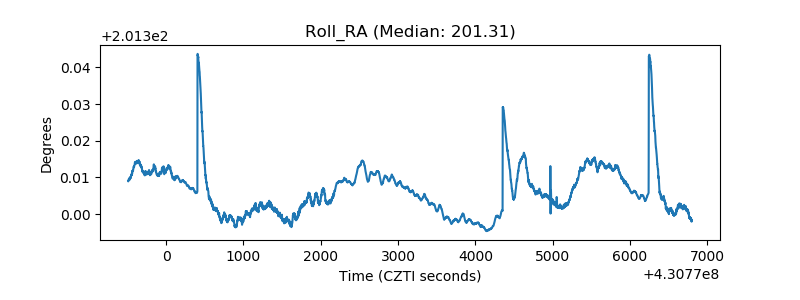 |
| Veto Counter | 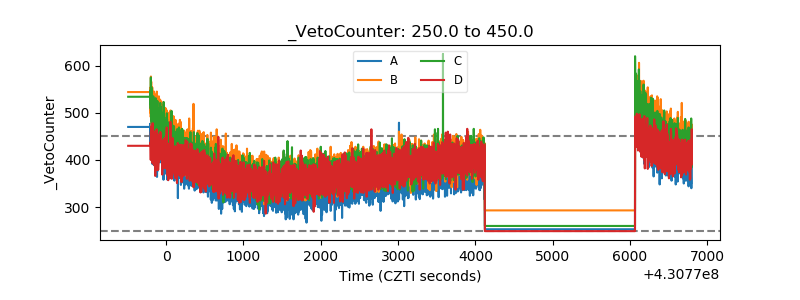 |