| Param | Original file | Final file |
|---|---|---|
| Filename | modeM0/AS1A05_013T01_9000005822_42779cztM0_level2.fits | modeM0/AS1A05_013T01_9000005822_42779cztM0_level2_quad_clean.evt |
| Size (bytes) | 287,890,560 | 89,317,440 |
| Size | 274.6 MB | 85.2 MB |
| Events in quadrant A | 2,788,236 | 608,257 |
| Events in quadrant B | 2,350,158 | 619,276 |
| Events in quadrant C | 2,470,985 | 593,041 |
| Events in quadrant D | 2,664,821 | 539,929 |
| Mode M0 | |||
|---|---|---|---|
| Quadrant | BADHDUFLAG | Total packets | Discarded packets |
| A | 0 | 11217 | 103 |
| B | 0 | 10162 | 90 |
| C | 0 | 10190 | 69 |
| D | 0 | 11424 | 124 |
| Mode M9 | |||
|---|---|---|---|
| Quadrant | BADHDUFLAG | Total packets | Discarded packets |
| A | 0 | 36 | 0 |
| B | 0 | 37 | 0 |
| C | 0 | 37 | 0 |
| D | 0 | 37 | 0 |
| Mode SS | |||
|---|---|---|---|
| Quadrant | BADHDUFLAG | Total packets | Discarded packets |
| A | 0 | 101 | 1 |
| B | 0 | 102 | 0 |
| C | 0 | 102 | 0 |
| D | 0 | 101 | 0 |
| Quadrant | Total seconds | Saturated seconds | Saturation percentage |
|---|---|---|---|
| A | 4901 | 11 | 0.224444% |
| B | 4907 | 12 | 0.244549% |
| C | 4915 | 8 | 0.162767% |
| D | 4893 | 56 | 1.144492% |
Noise dominated data is calculated using 1-second bins in cleaned event files. If a bin has >2000 counts, and if more than 50% of those come from <1% of pixels, then it is considered to be noise-dominated and hence unusable.
| Quadrant | # 1 sec bins | Bins with >0 counts | Bins with >2000 counts | High rate bins dominated by noise | Noise dominated (total time) | Noise dominated (detector-on time) | Marked lightcurve |
|---|---|---|---|---|---|---|---|
| A | 7084 | 4942 | 4 | 4 | 0.06% | 0.08% | 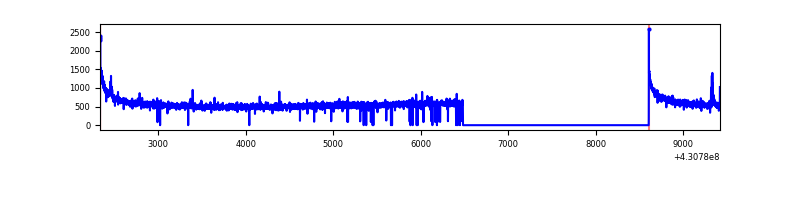 |
| B | 7084 | 4944 | 3 | 3 | 0.04% | 0.06% | 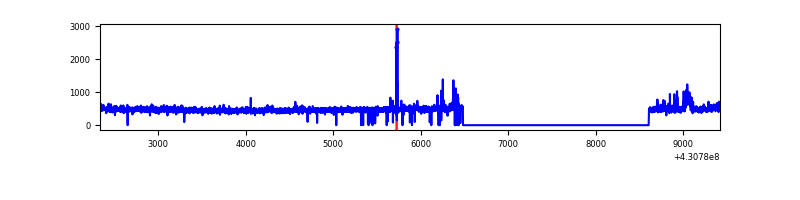 |
| C | 7083 | 4945 | 4 | 4 | 0.06% | 0.08% | 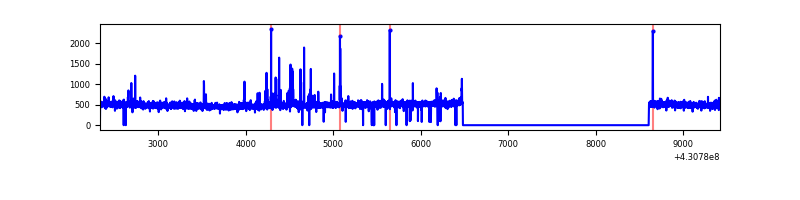 |
| D | 7083 | 4940 | 52 | 52 | 0.73% | 1.05% | 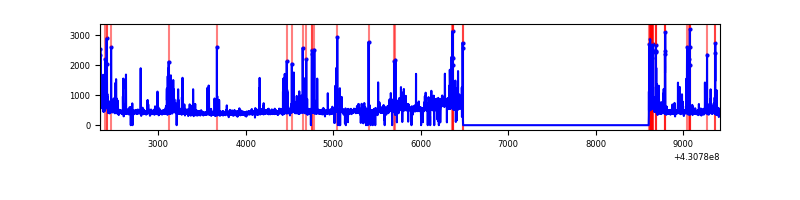 |
Top three noisy pixels from each quadrant. If the there are fewer than three noisy pixels in the level2.evt file, extra rows are filled as -1
| Pixel properties | Quadrant properties | ||||||
|---|---|---|---|---|---|---|---|
| Quadrant | DetID | PixID | Counts | Sigma | Mean | Median | Sigma |
| A | 10 | 83 | 524716 | 4467.46 | 575 | 564 | 117.3 |
| A | 13 | 248 | 20060 | 166.17 | 575 | 564 | 117.3 |
| A | 13 | 6 | 9189 | 73.51 | 575 | 564 | 117.3 |
| B | 6 | 235 | 37150 | 334.58 | 572 | 557 | 109.4 |
| B | 0 | 245 | 18726 | 166.12 | 572 | 557 | 109.4 |
| B | 5 | 172 | 16904 | 149.46 | 572 | 557 | 109.4 |
| C | 15 | 214 | 198329 | 1524.18 | 561 | 566 | 129.8 |
| C | 14 | 254 | 51434 | 392.05 | 561 | 566 | 129.8 |
| C | 15 | 111 | 16767 | 124.86 | 561 | 566 | 129.8 |
| D | 13 | 249 | 142337 | 1051.12 | 553 | 538 | 134.9 |
| D | 1 | 52 | 114992 | 848.42 | 553 | 538 | 134.9 |
| D | 2 | 249 | 86672 | 638.49 | 553 | 538 | 134.9 |
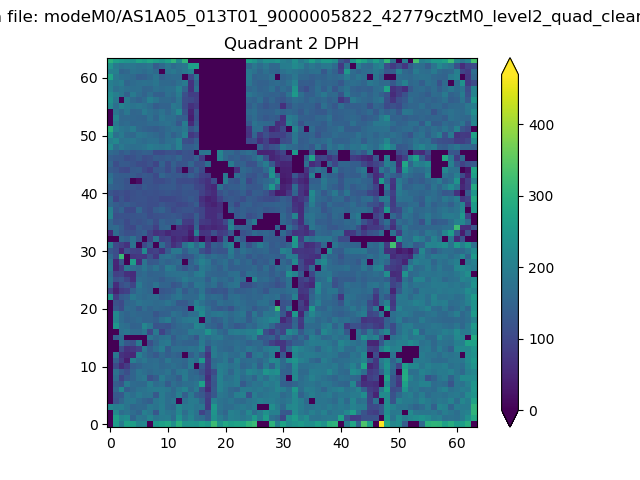
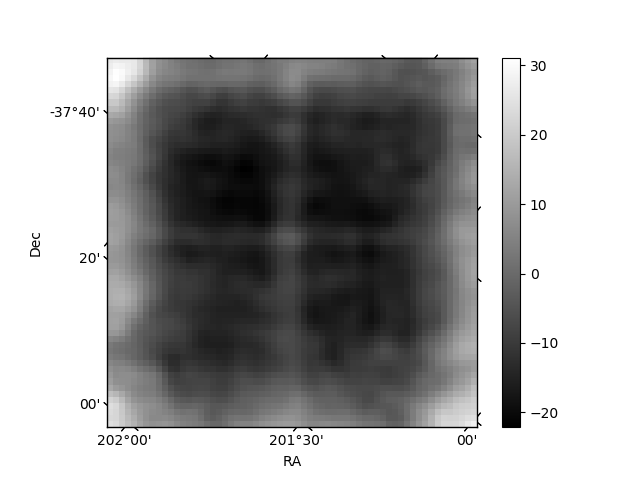
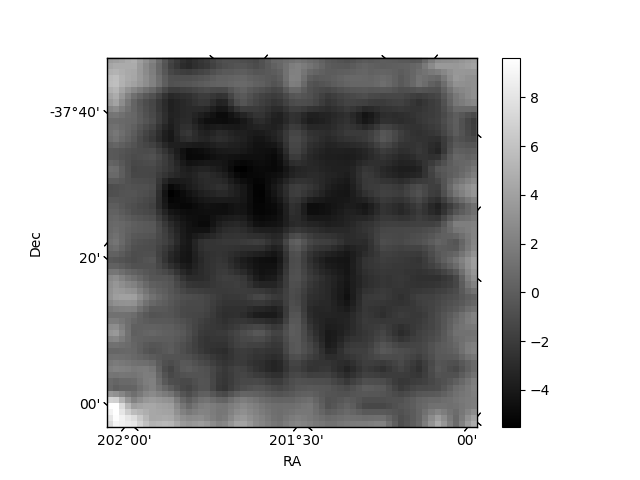
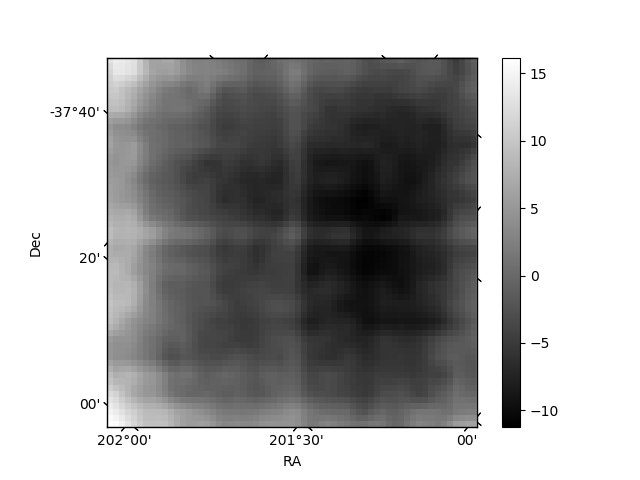
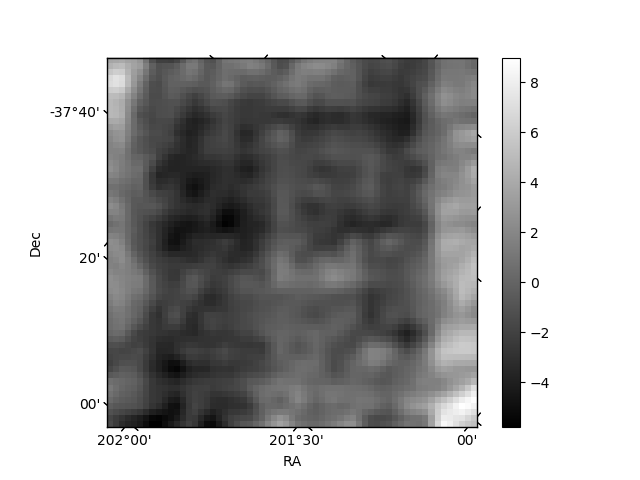
Histogram calculated using DETX and DETY for each event in the final _common_clean file
| Quadrant A | 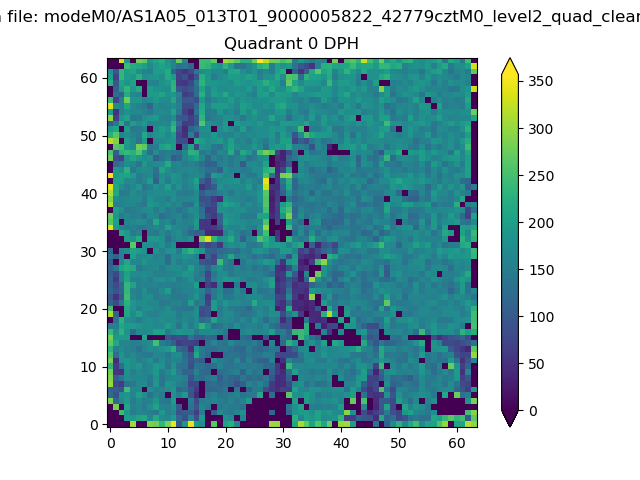 |
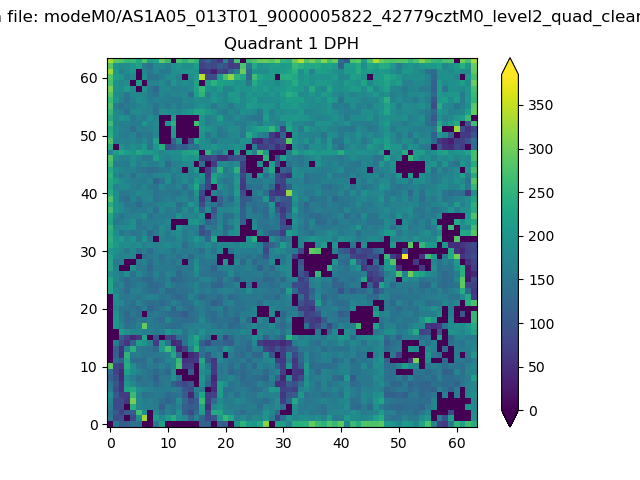 |
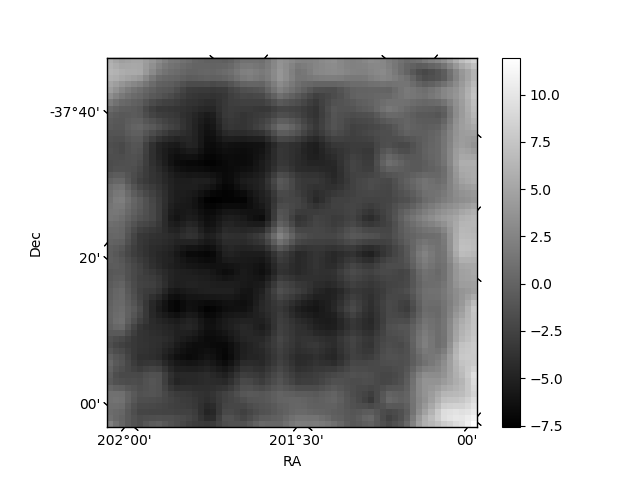
Quadrant B |
|---|---|---|---|
| Quadrant D | 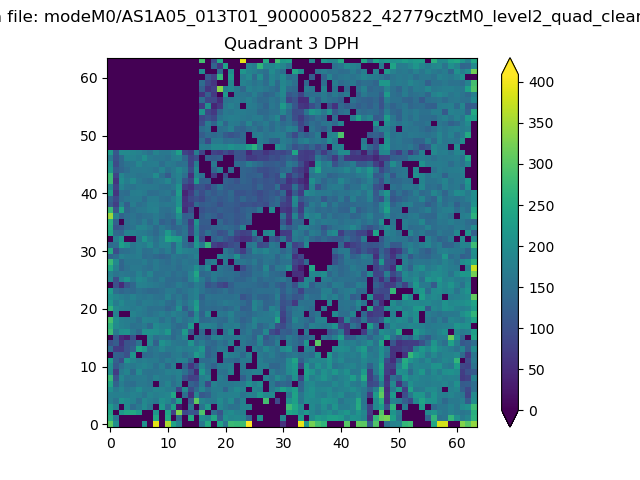 |
 |
Quadrant C |
| Plot type | Count rate plots | Images |
|---|---|---|
| Comparison with Poisson distribution Blue bars denote a histogram of data divided into 1 sec bins. Red curve is a Poisson curve with rate = median count rate of data. |
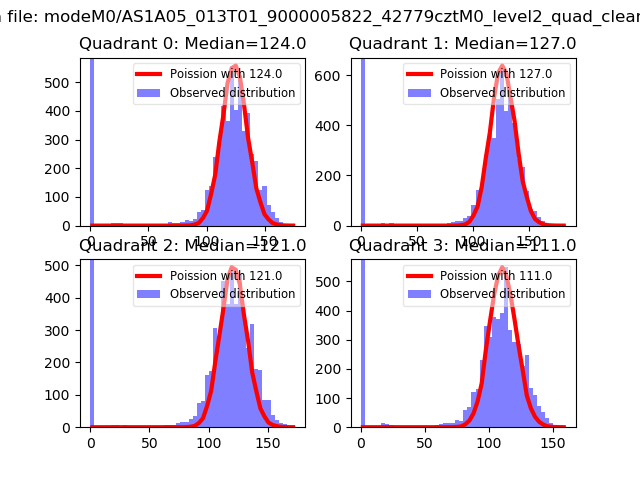 |
 |
| Quadrant-wise count rates Data is divided into 100 sec bins |
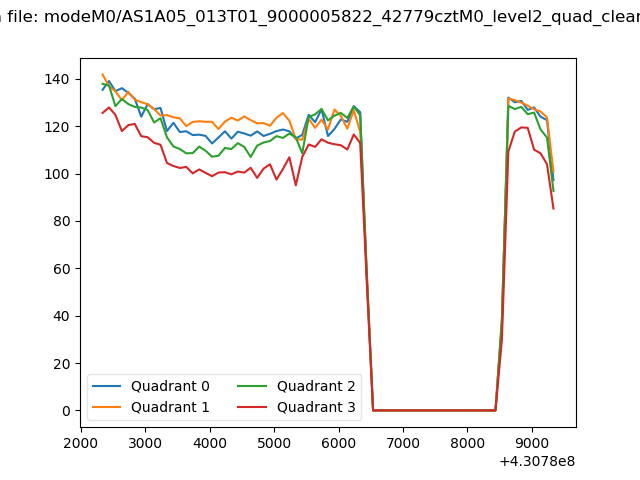 |
|
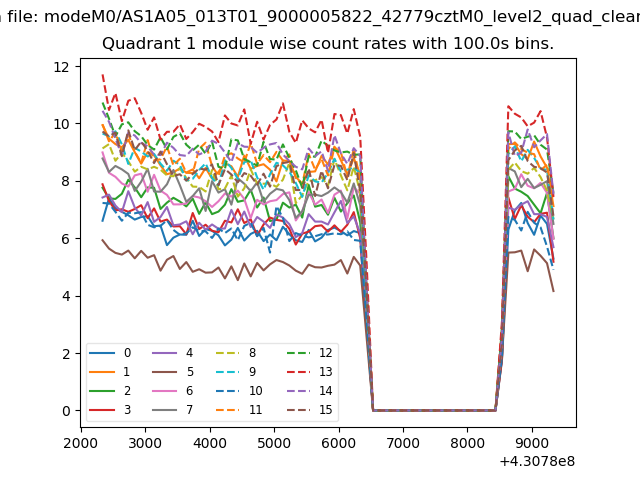
| Module-wise count rates for Quadrant A Data is divided into 100 sec bins |
 |
 |
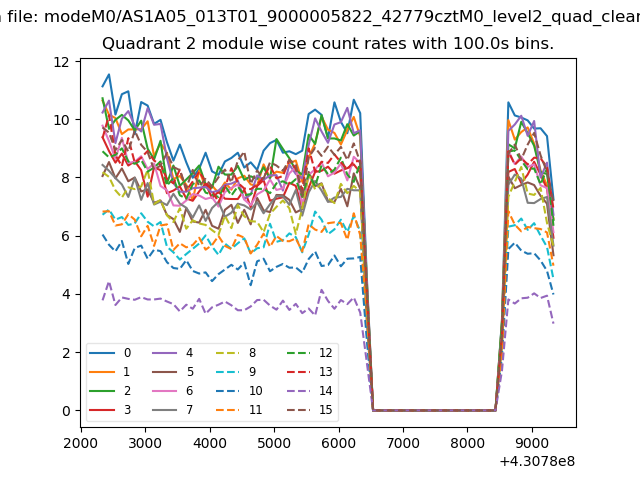
| Module-wise count rates for Quadrant B Data is divided into 100 sec bins |
 |
 |
| Module-wise count rates for Quadrant C Data is divided into 100 sec bins |
 |
 |
| Module-wise count rates for Quadrant D Data is divided into 100 sec bins |
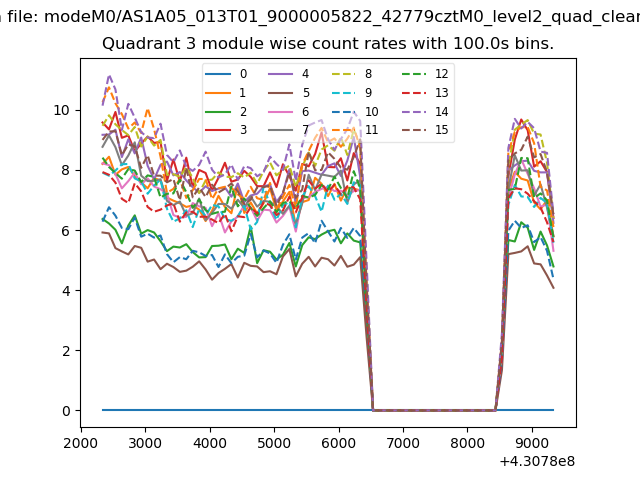 |
 |
| Parameter | Plot |
|---|---|
| CZT HV Monitor | 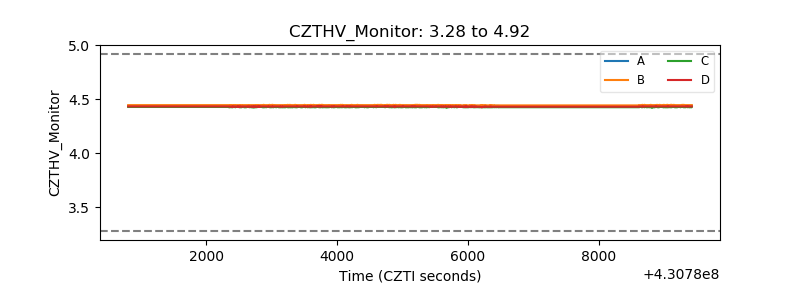 |
| D_VDD | 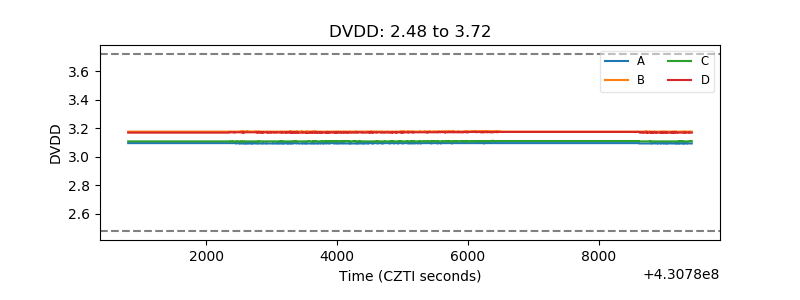 |
| Temperature 1 | 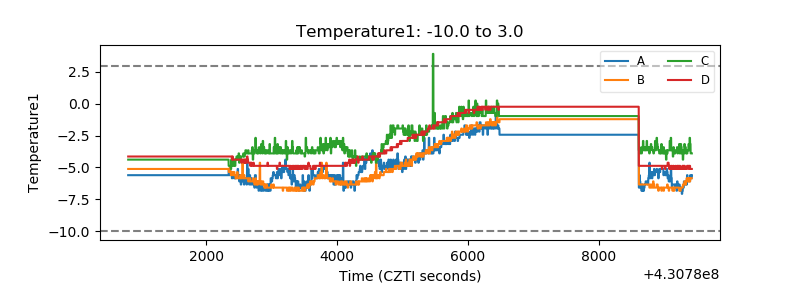 |
| Veto HV Monitor | 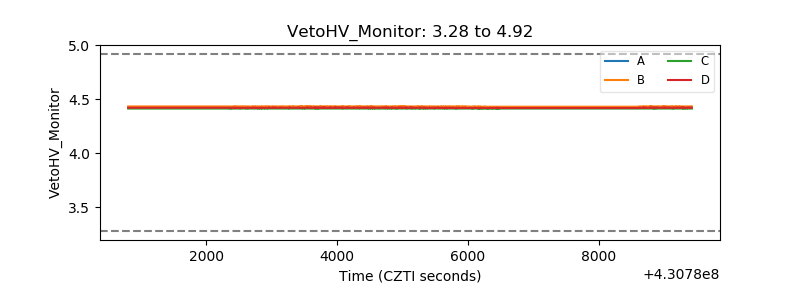 |
| Veto LLD | 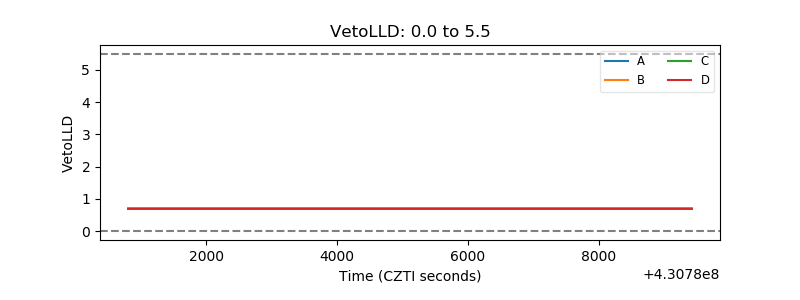 |
| Alpha Counter | 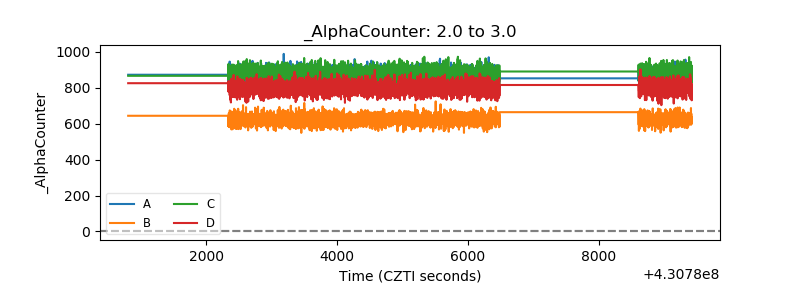 |
| _CPM_Rate | 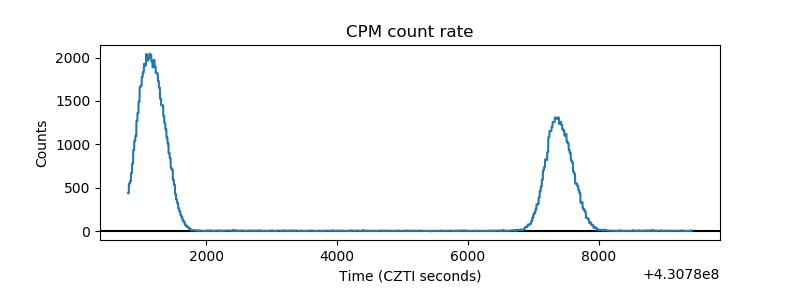 |
| CZT Counter | 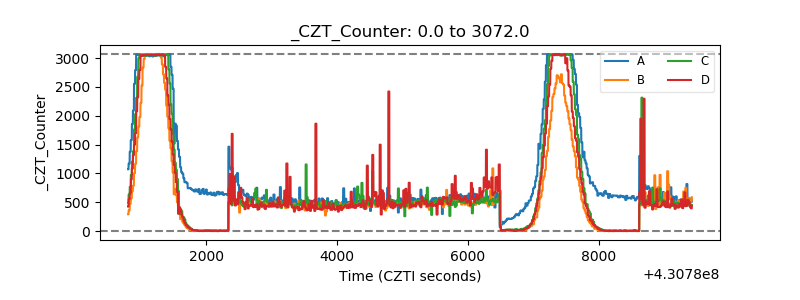 |
| +2.5 Volts monitor | 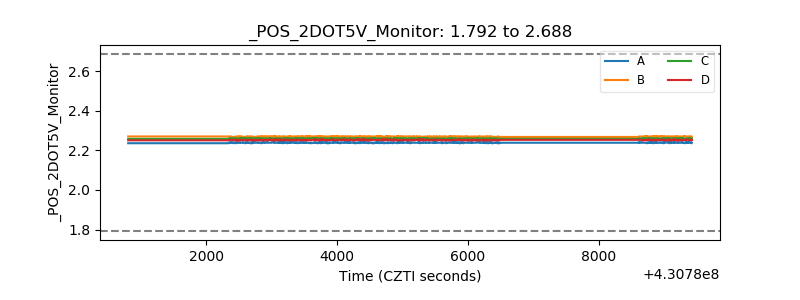 |
| +5 Volts monitor | 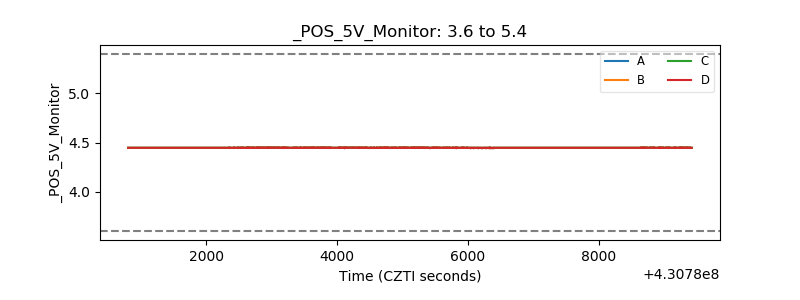 |
| _ROLL_ROT | 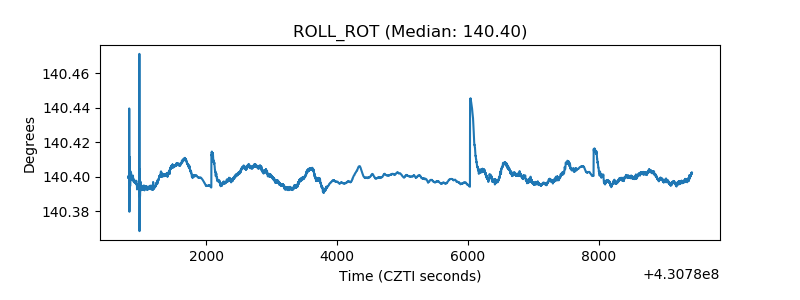 |
| _Roll_DEC | 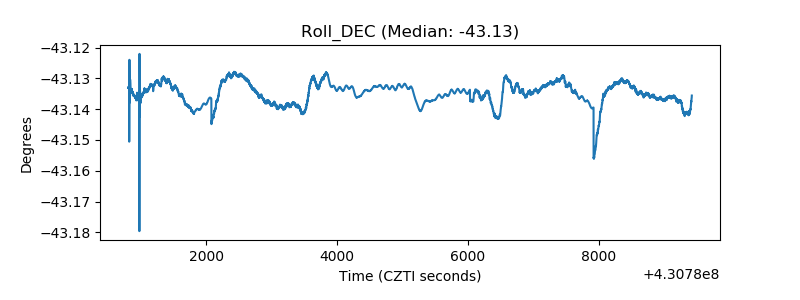 |
| _Roll_RA | 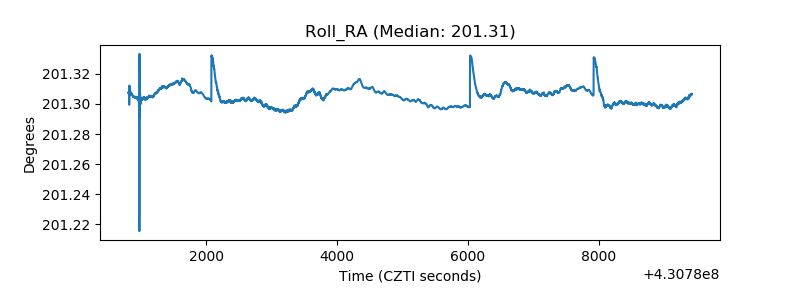 |
| Veto Counter | 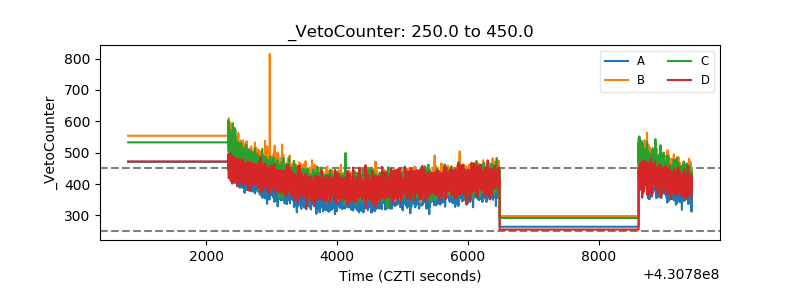 |