| Param | Original file | Final file |
|---|---|---|
| Filename | modeM0/AS1A05_013T01_9000005822_42780cztM0_level2.fits | modeM0/AS1A05_013T01_9000005822_42780cztM0_level2_quad_clean.evt |
| Size (bytes) | 288,455,040 | 86,137,920 |
| Size | 275.1 MB | 82.1 MB |
| Events in quadrant A | 2,750,976 | 585,403 |
| Events in quadrant B | 2,523,432 | 593,701 |
| Events in quadrant C | 2,394,464 | 568,588 |
| Events in quadrant D | 2,629,224 | 518,775 |
| Mode M0 | |||
|---|---|---|---|
| Quadrant | BADHDUFLAG | Total packets | Discarded packets |
| A | 0 | 10970 | 6 |
| B | 0 | 10537 | 11 |
| C | 0 | 9905 | 6 |
| D | 0 | 11263 | 7 |
| Mode M9 | |||
|---|---|---|---|
| Quadrant | BADHDUFLAG | Total packets | Discarded packets |
| A | 0 | 36 | 0 |
| B | 0 | 37 | 0 |
| C | 0 | 37 | 0 |
| D | 0 | 37 | 0 |
| Mode SS | |||
|---|---|---|---|
| Quadrant | BADHDUFLAG | Total packets | Discarded packets |
| A | 0 | 102 | 0 |
| B | 0 | 102 | 0 |
| C | 0 | 102 | 0 |
| D | 0 | 102 | 0 |
| Quadrant | Total seconds | Saturated seconds | Saturation percentage |
|---|---|---|---|
| A | 4866 | 12 | 0.246609% |
| B | 4863 | 33 | 0.678593% |
| C | 4866 | 7 | 0.143855% |
| D | 4866 | 83 | 1.705713% |
Noise dominated data is calculated using 1-second bins in cleaned event files. If a bin has >2000 counts, and if more than 50% of those come from <1% of pixels, then it is considered to be noise-dominated and hence unusable.
| Quadrant | # 1 sec bins | Bins with >0 counts | Bins with >2000 counts | High rate bins dominated by noise | Noise dominated (total time) | Noise dominated (detector-on time) | Marked lightcurve |
|---|---|---|---|---|---|---|---|
| A | 7021 | 4870 | 7 | 7 | 0.10% | 0.14% | 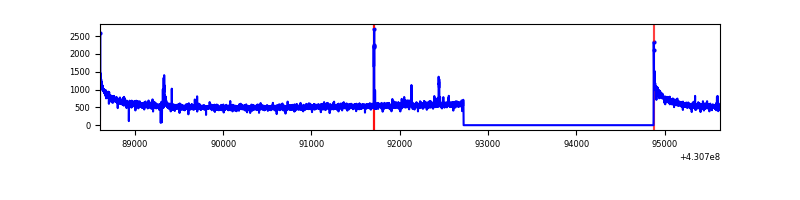 |
| B | 7021 | 4867 | 24 | 24 | 0.34% | 0.49% | 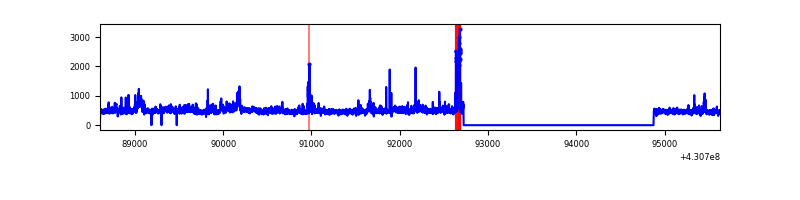 |
| C | 7021 | 4869 | 2 | 2 | 0.03% | 0.04% | 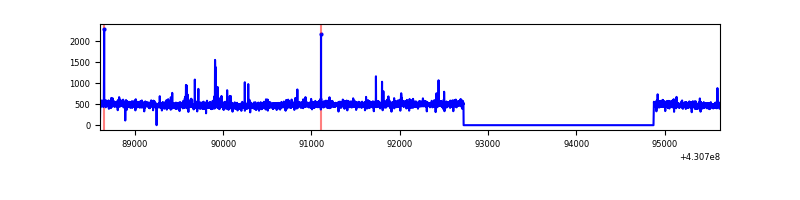 |
| D | 7021 | 4869 | 78 | 78 | 1.11% | 1.60% | 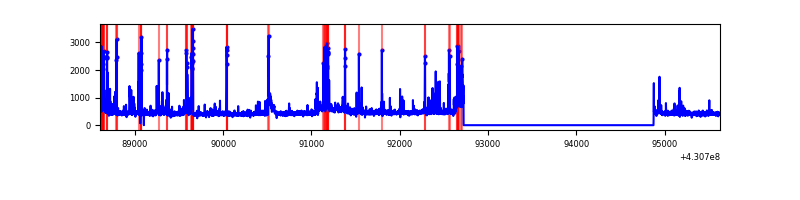 |
Top three noisy pixels from each quadrant. If the there are fewer than three noisy pixels in the level2.evt file, extra rows are filled as -1
| Pixel properties | Quadrant properties | ||||||
|---|---|---|---|---|---|---|---|
| Quadrant | DetID | PixID | Counts | Sigma | Mean | Median | Sigma |
| A | 10 | 83 | 529501 | 4598.15 | 561 | 550 | 115.0 |
| A | 13 | 248 | 29205 | 249.1 | 561 | 550 | 115.0 |
| A | 12 | 189 | 14171 | 118.41 | 561 | 550 | 115.0 |
| B | 3 | 112 | 146072 | 1366.11 | 554 | 540 | 106.5 |
| B | 0 | 229 | 55803 | 518.75 | 554 | 540 | 106.5 |
| B | 5 | 172 | 42726 | 396.0 | 554 | 540 | 106.5 |
| C | 15 | 214 | 197634 | 1559.07 | 548 | 553 | 126.4 |
| C | 14 | 254 | 42389 | 330.96 | 548 | 553 | 126.4 |
| C | 15 | 208 | 9701 | 72.37 | 548 | 553 | 126.4 |
| D | 13 | 249 | 297758 | 2251.77 | 543 | 528 | 132.0 |
| D | 2 | 249 | 97352 | 733.53 | 543 | 528 | 132.0 |
| D | 5 | 171 | 66429 | 499.26 | 543 | 528 | 132.0 |
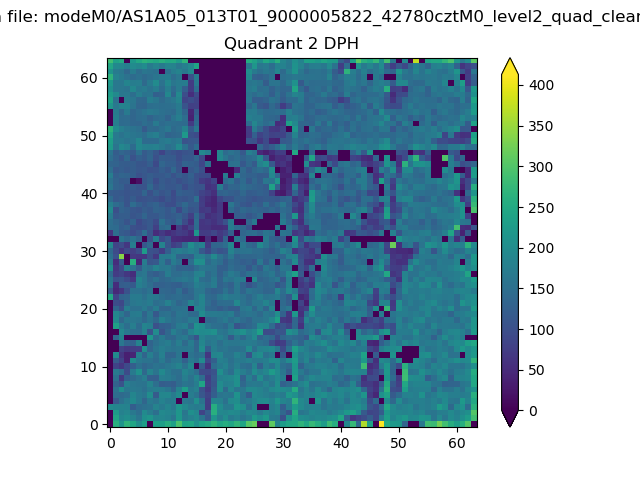
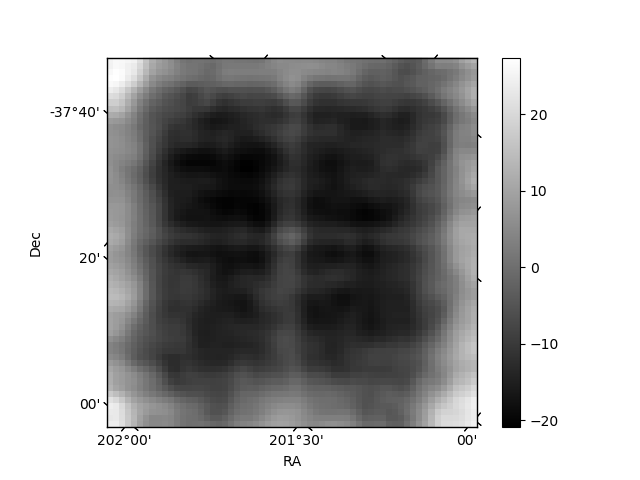
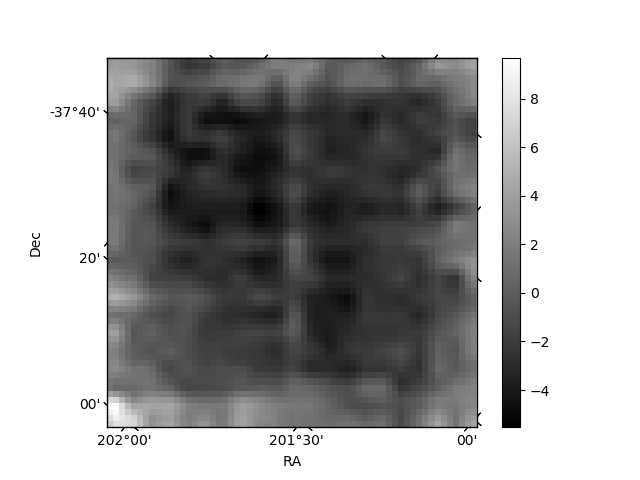
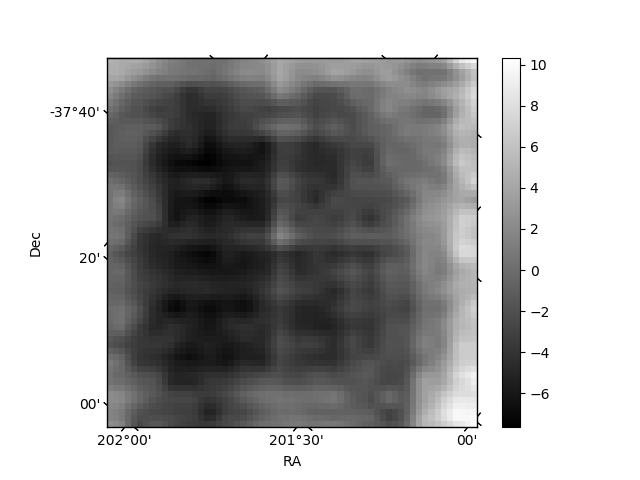
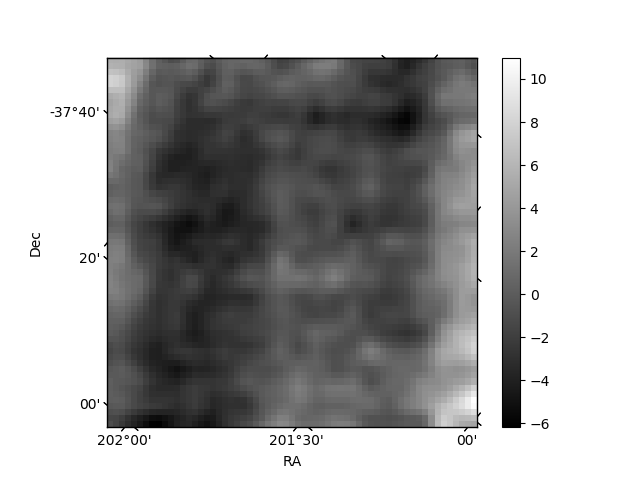
Histogram calculated using DETX and DETY for each event in the final _common_clean file
| Quadrant A | 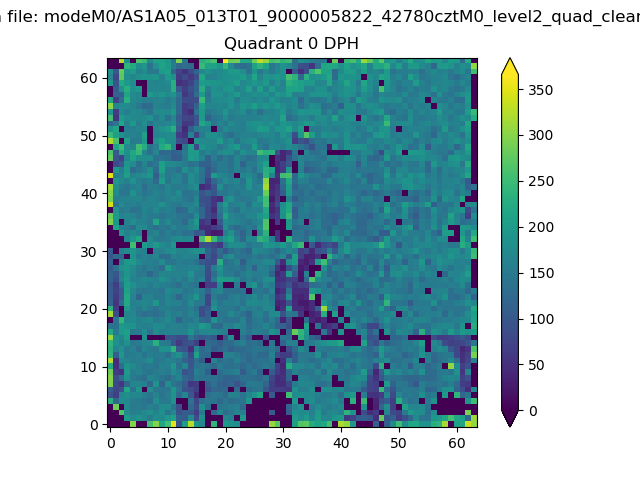 |
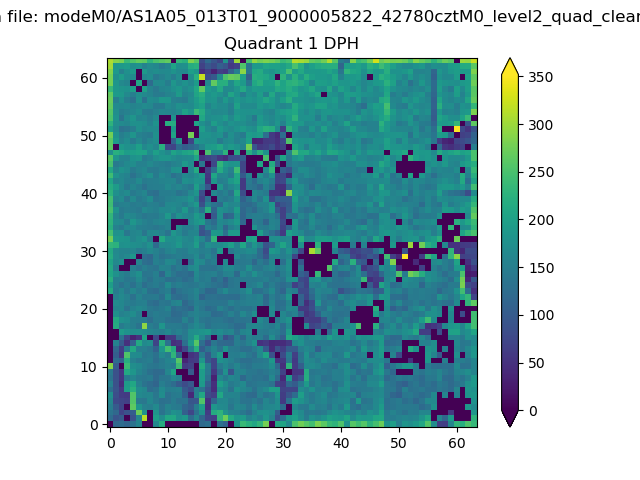 |
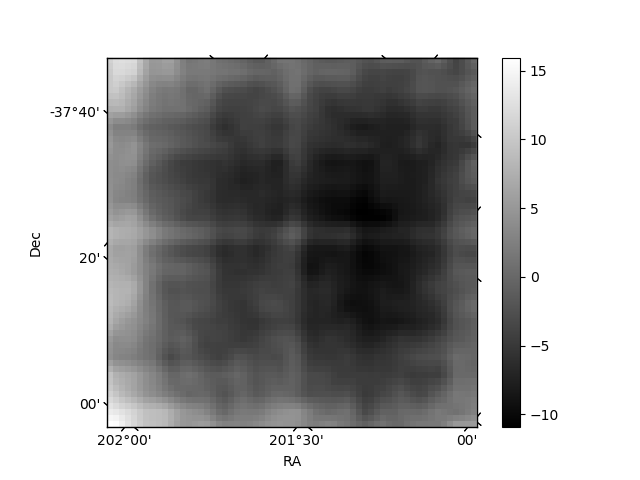
Quadrant B |
|---|---|---|---|
| Quadrant D | 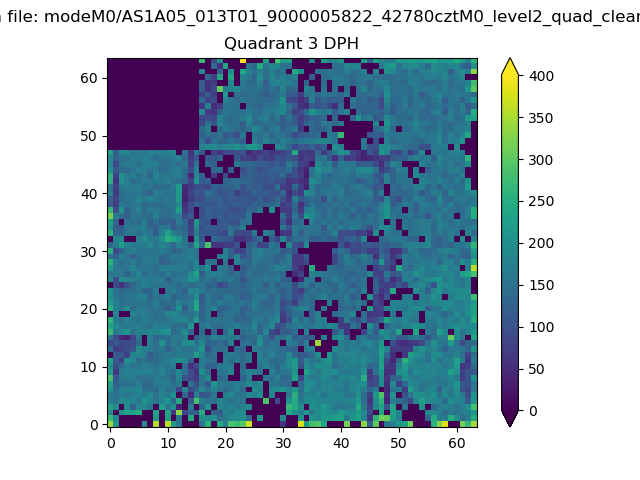 |
 |
Quadrant C |
| Plot type | Count rate plots | Images |
|---|---|---|
| Comparison with Poisson distribution Blue bars denote a histogram of data divided into 1 sec bins. Red curve is a Poisson curve with rate = median count rate of data. |
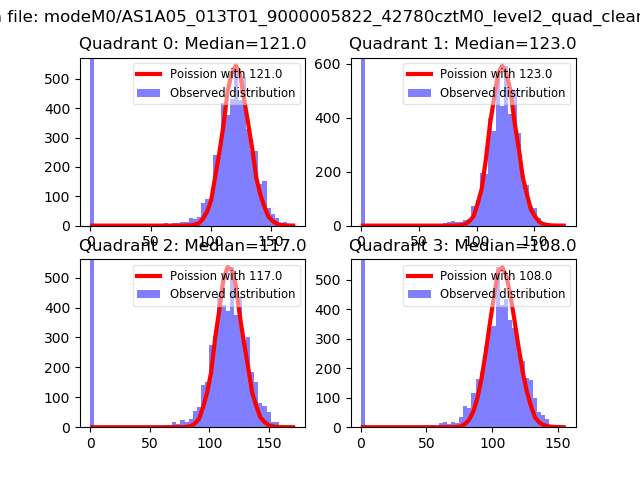 |
 |
| Quadrant-wise count rates Data is divided into 100 sec bins |
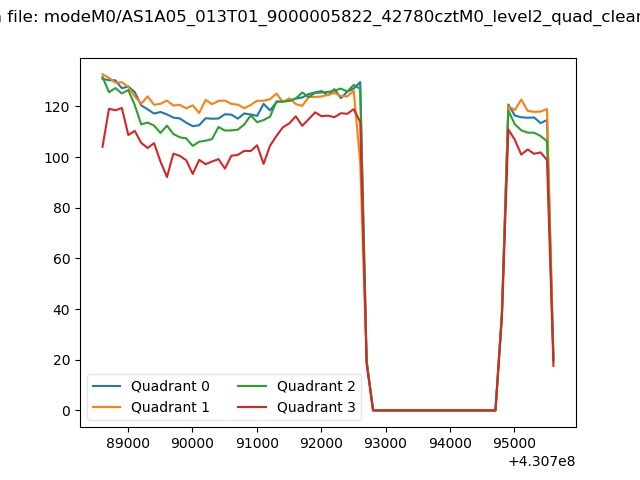 |
|
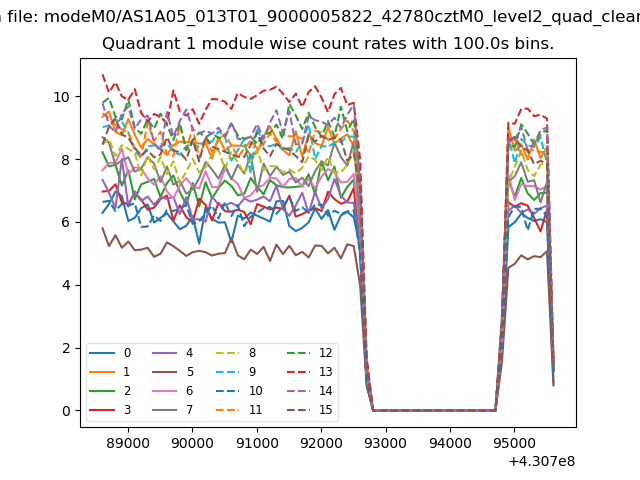
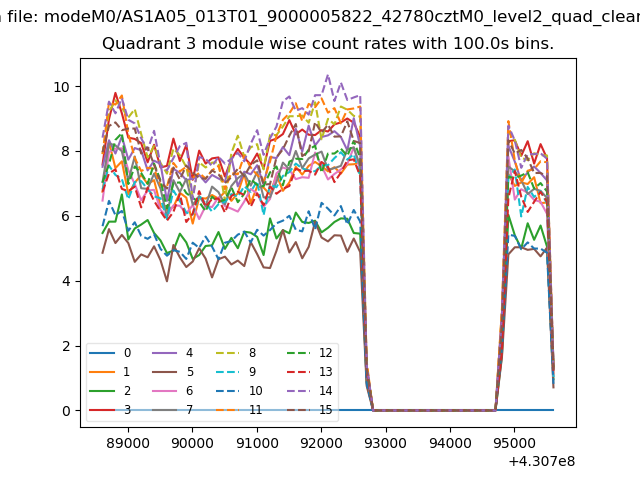
| Module-wise count rates for Quadrant A Data is divided into 100 sec bins |
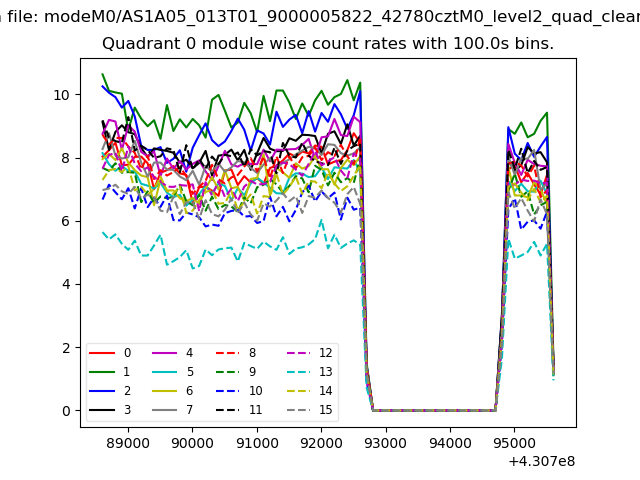 |
 |
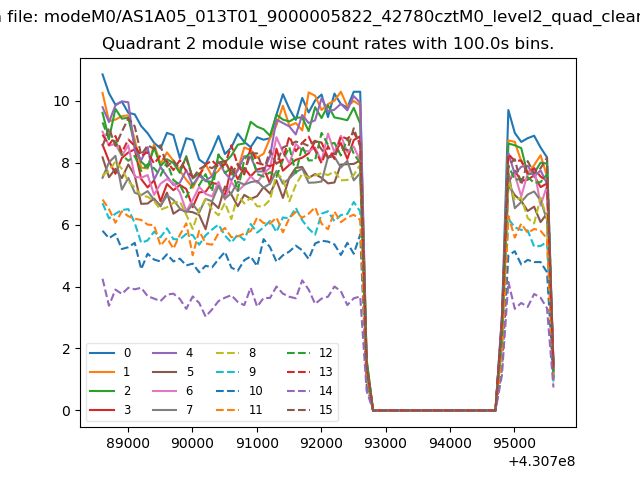
| Module-wise count rates for Quadrant B Data is divided into 100 sec bins |
 |
 |
| Module-wise count rates for Quadrant C Data is divided into 100 sec bins |
 |
 |
| Module-wise count rates for Quadrant D Data is divided into 100 sec bins |
 |
 |
| Parameter | Plot |
|---|---|
| CZT HV Monitor | 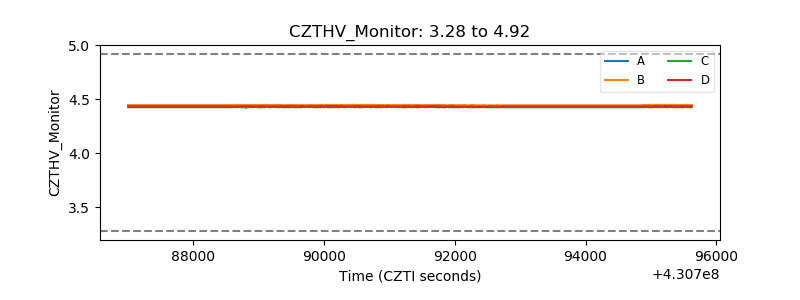 |
| D_VDD | 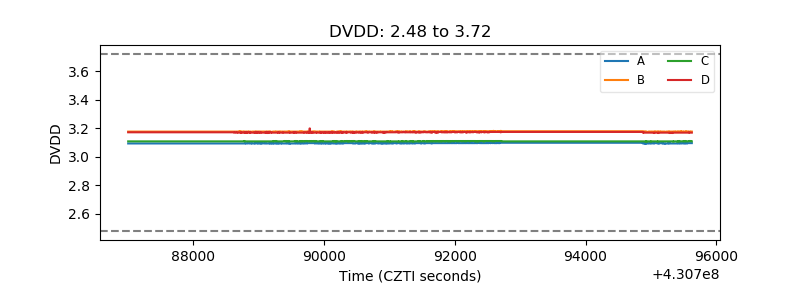 |
| Temperature 1 | 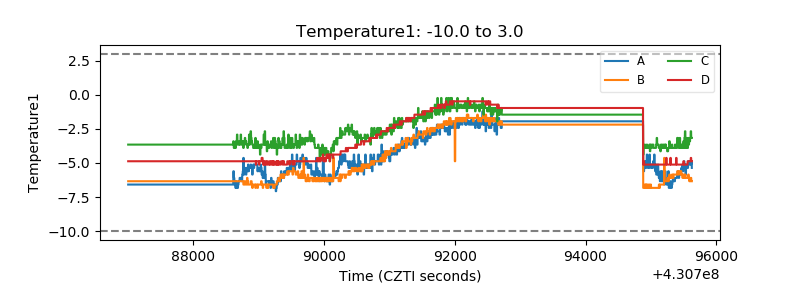 |
| Veto HV Monitor | 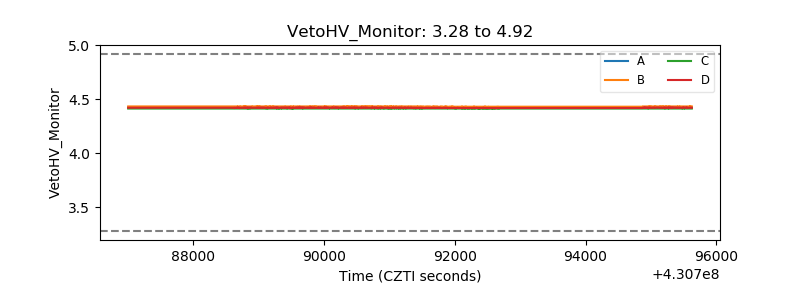 |
| Veto LLD | 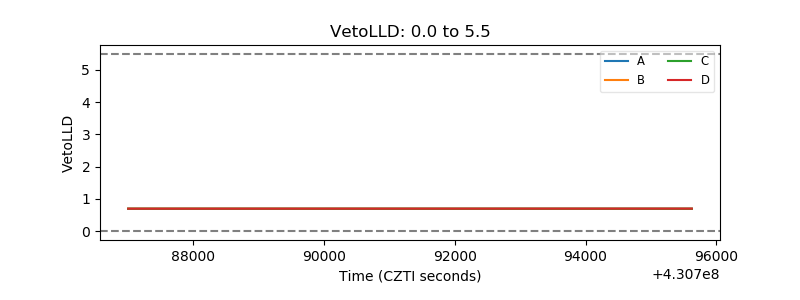 |
| Alpha Counter | 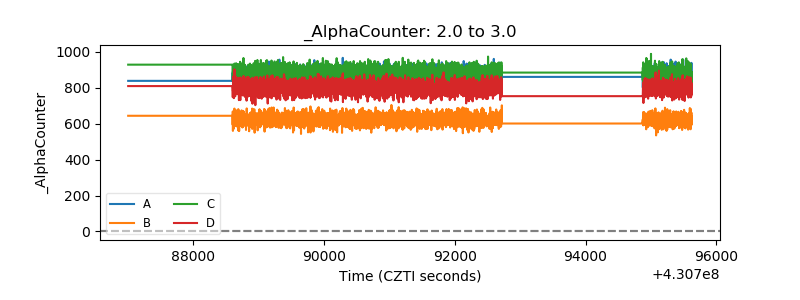 |
| _CPM_Rate | 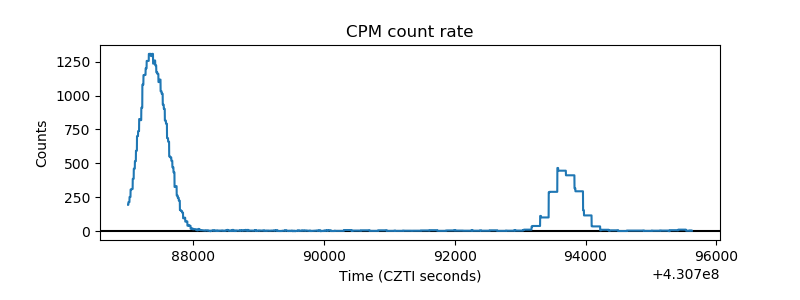 |
| CZT Counter | 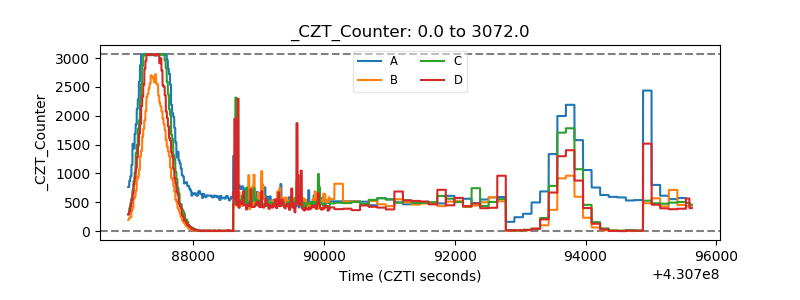 |
| +2.5 Volts monitor | 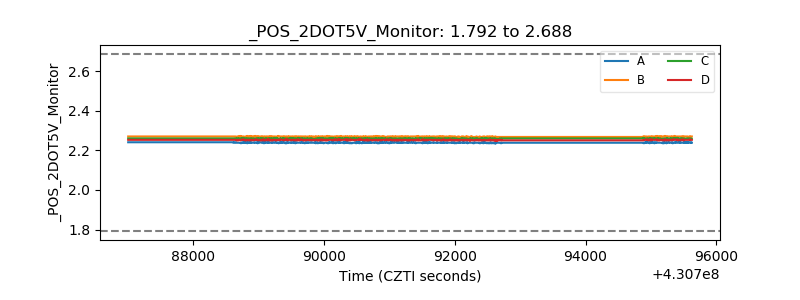 |
| +5 Volts monitor | 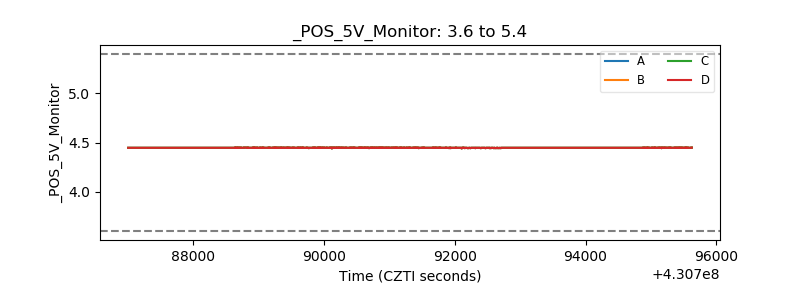 |
| _ROLL_ROT | 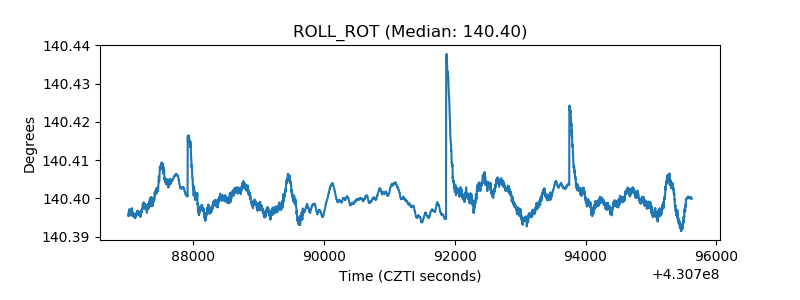 |
| _Roll_DEC | 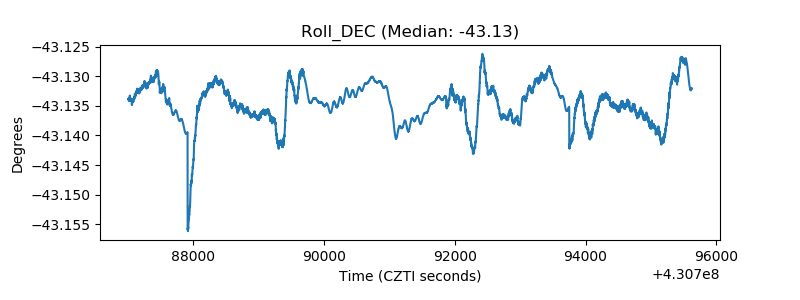 |
| _Roll_RA | 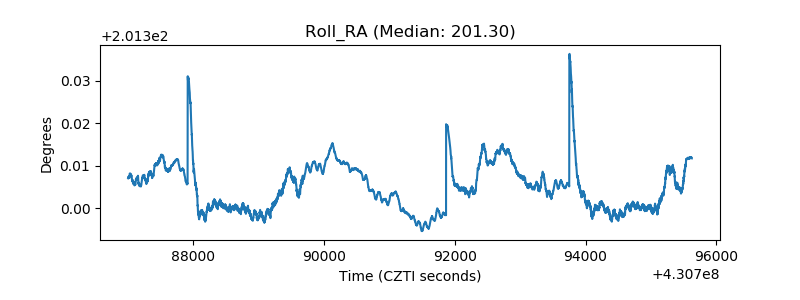 |
| Veto Counter | 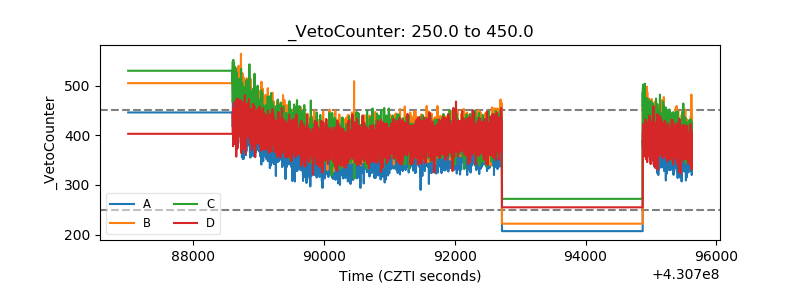 |