| Param | Original file | Final file |
|---|---|---|
| Filename | modeM0/AS1A05_013T01_9000005822_42781cztM0_level2.fits | modeM0/AS1A05_013T01_9000005822_42781cztM0_level2_quad_clean.evt |
| Size (bytes) | 280,128,960 | 86,817,600 |
| Size | 267.2 MB | 82.8 MB |
| Events in quadrant A | 2,816,299 | 584,886 |
| Events in quadrant B | 2,339,475 | 594,464 |
| Events in quadrant C | 2,468,287 | 568,993 |
| Events in quadrant D | 2,350,325 | 525,483 |
| Mode M0 | |||
|---|---|---|---|
| Quadrant | BADHDUFLAG | Total packets | Discarded packets |
| A | 0 | 11204 | 2 |
| B | 0 | 10306 | 2 |
| C | 0 | 10361 | 2 |
| D | 0 | 10678 | 2 |
| Mode M9 | |||
|---|---|---|---|
| Quadrant | BADHDUFLAG | Total packets | Discarded packets |
| A | 0 | 37 | 0 |
| B | 0 | 38 | 0 |
| C | 0 | 38 | 0 |
| D | 0 | 38 | 0 |
| Mode SS | |||
|---|---|---|---|
| Quadrant | BADHDUFLAG | Total packets | Discarded packets |
| A | 0 | 104 | 0 |
| B | 0 | 104 | 0 |
| C | 0 | 104 | 0 |
| D | 0 | 104 | 0 |
| Quadrant | Total seconds | Saturated seconds | Saturation percentage |
|---|---|---|---|
| A | 5063 | 18 | 0.355520% |
| B | 5063 | 6 | 0.118507% |
| C | 5063 | 10 | 0.197511% |
| D | 5063 | 24 | 0.474027% |
Noise dominated data is calculated using 1-second bins in cleaned event files. If a bin has >2000 counts, and if more than 50% of those come from <1% of pixels, then it is considered to be noise-dominated and hence unusable.
| Quadrant | # 1 sec bins | Bins with >0 counts | Bins with >2000 counts | High rate bins dominated by noise | Noise dominated (total time) | Noise dominated (detector-on time) | Marked lightcurve |
|---|---|---|---|---|---|---|---|
| A | 7036 | 5064 | 7 | 7 | 0.10% | 0.14% | 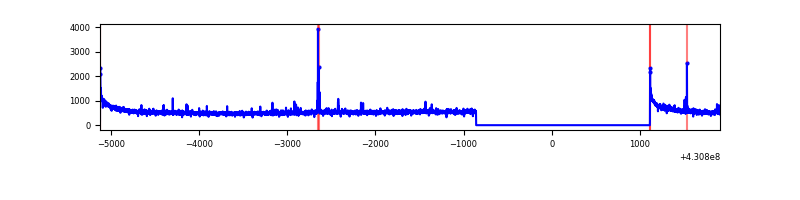 |
| B | 7036 | 5064 | 1 | 1 | 0.01% | 0.02% | 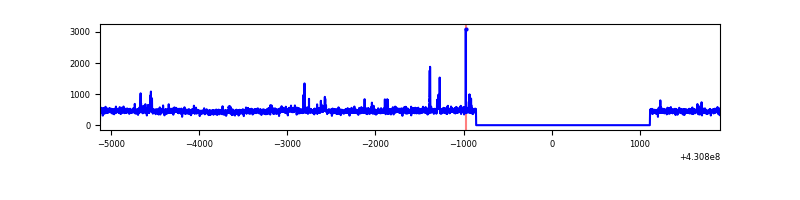 |
| C | 7036 | 5064 | 6 | 6 | 0.09% | 0.12% | 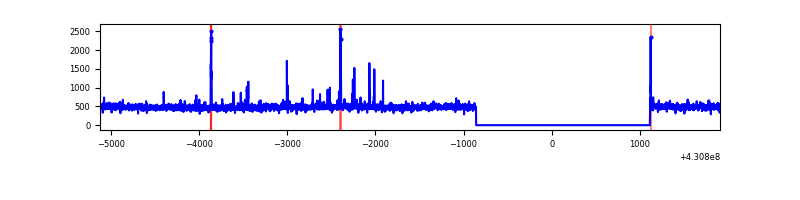 |
| D | 7036 | 5064 | 19 | 19 | 0.27% | 0.38% | 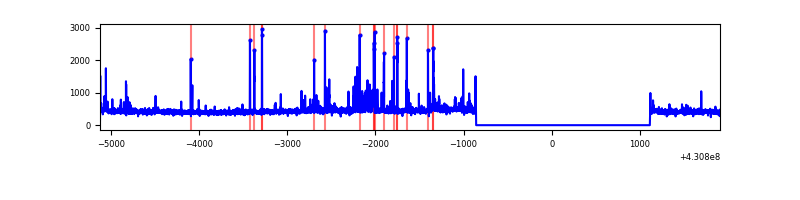 |
Top three noisy pixels from each quadrant. If the there are fewer than three noisy pixels in the level2.evt file, extra rows are filled as -1
| Pixel properties | Quadrant properties | ||||||
|---|---|---|---|---|---|---|---|
| Quadrant | DetID | PixID | Counts | Sigma | Mean | Median | Sigma |
| A | 10 | 83 | 544352 | 4599.58 | 573 | 560 | 118.2 |
| A | 9 | 254 | 35915 | 299.05 | 573 | 560 | 118.2 |
| A | 13 | 254 | 7575 | 59.34 | 573 | 560 | 118.2 |
| B | 3 | 112 | 30958 | 275.97 | 566 | 551 | 110.2 |
| B | 0 | 245 | 27703 | 246.43 | 566 | 551 | 110.2 |
| B | 5 | 172 | 20753 | 183.35 | 566 | 551 | 110.2 |
| C | 15 | 214 | 205497 | 1564.93 | 560 | 563 | 131.0 |
| C | 14 | 254 | 69010 | 522.68 | 560 | 563 | 131.0 |
| C | 15 | 208 | 6918 | 48.53 | 560 | 563 | 131.0 |
| D | 5 | 171 | 56400 | 406.37 | 558 | 541 | 137.5 |
| D | 12 | 233 | 47246 | 339.77 | 558 | 541 | 137.5 |
| D | 2 | 249 | 38629 | 277.09 | 558 | 541 | 137.5 |
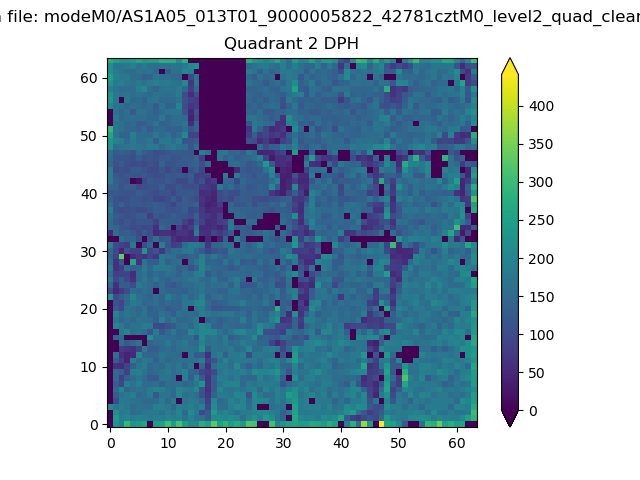
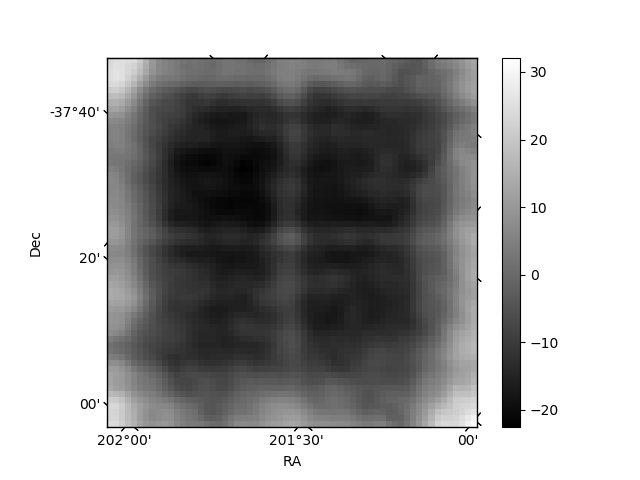
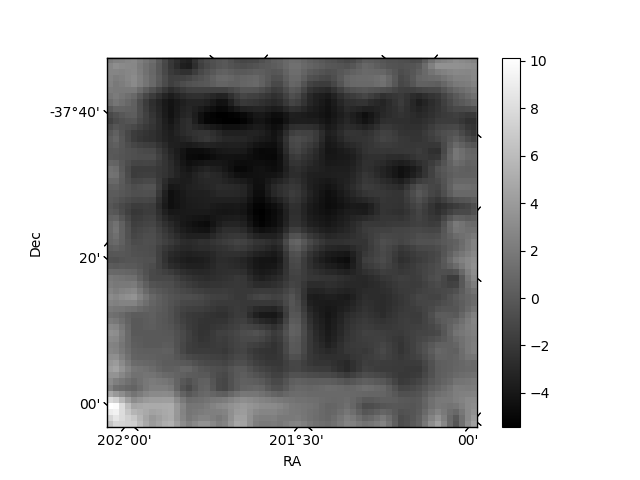
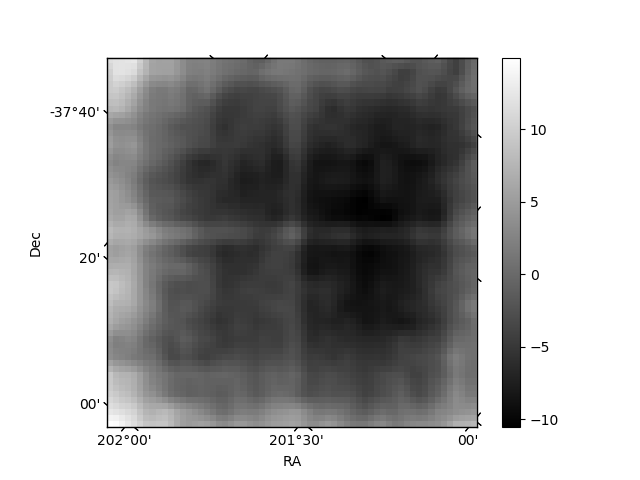
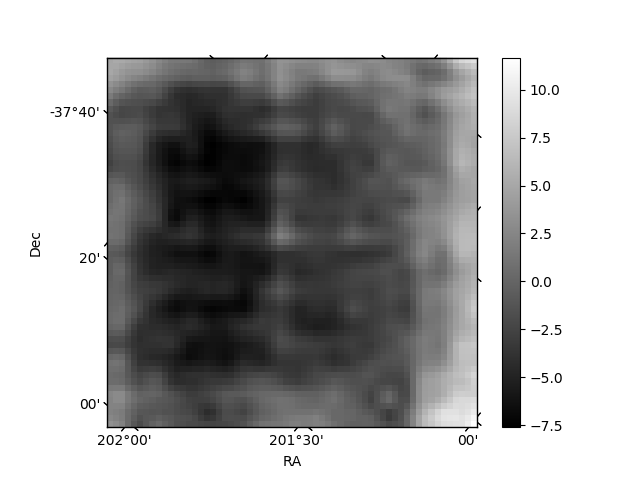
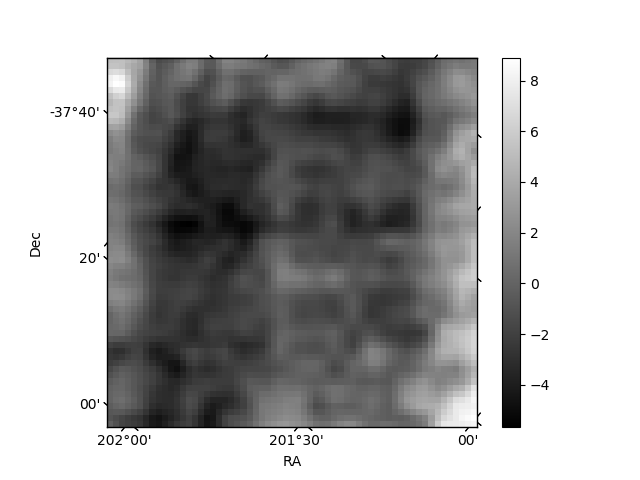
Histogram calculated using DETX and DETY for each event in the final _common_clean file
| Quadrant A | 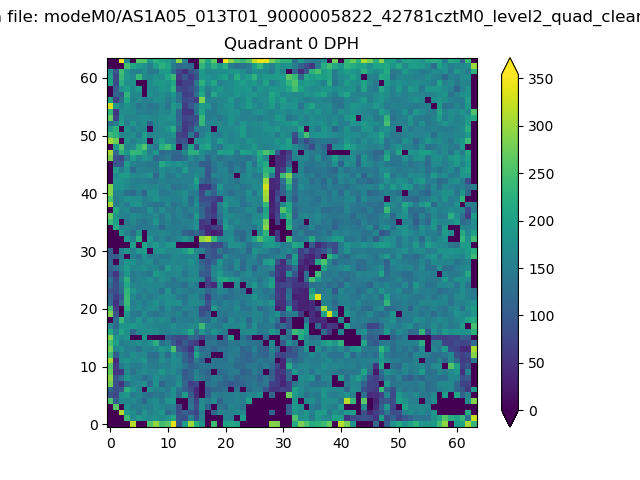 |
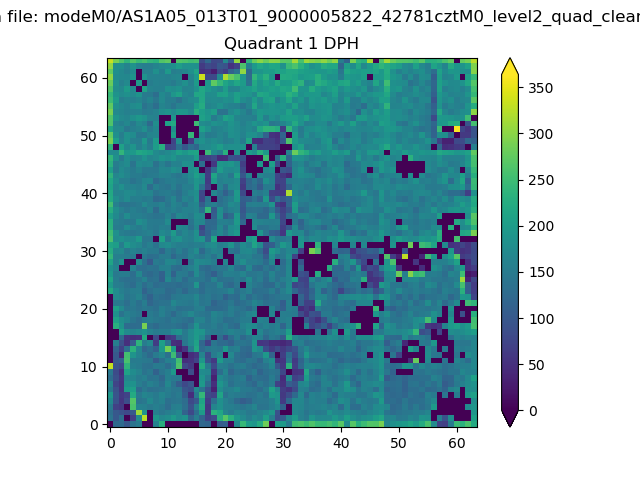 |
Quadrant B |
|---|---|---|---|
| Quadrant D | 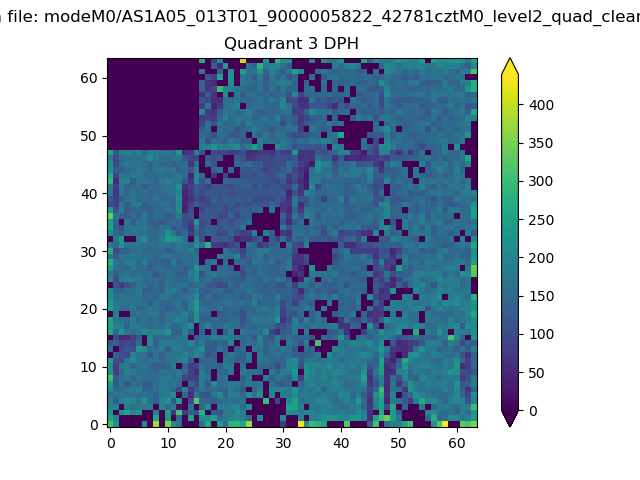 |
 |
Quadrant C |
| Plot type | Count rate plots | Images |
|---|---|---|
| Comparison with Poisson distribution Blue bars denote a histogram of data divided into 1 sec bins. Red curve is a Poisson curve with rate = median count rate of data. |
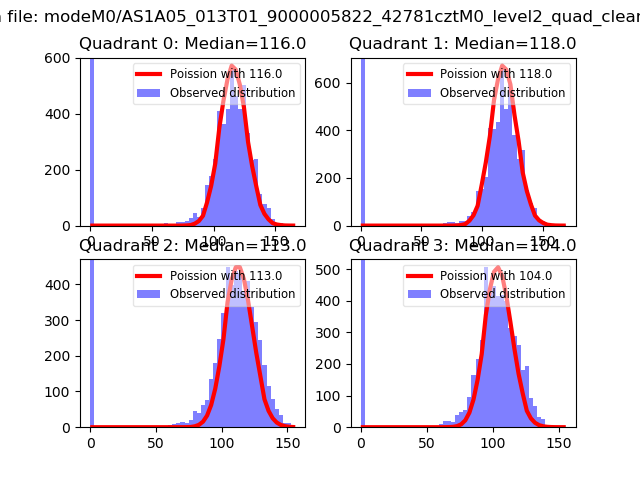 |
 |
| Quadrant-wise count rates Data is divided into 100 sec bins |
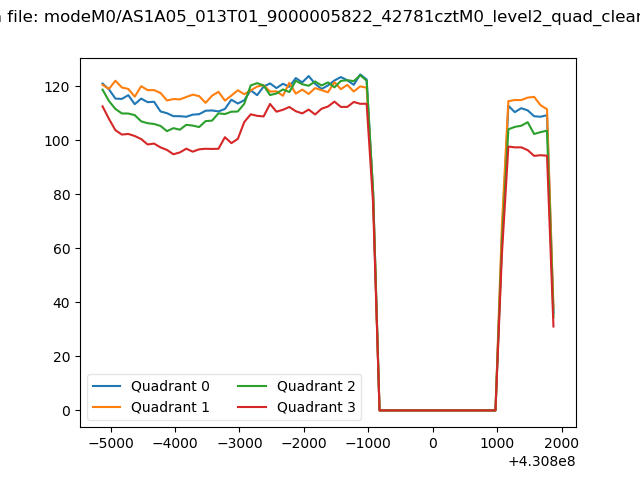 |
|
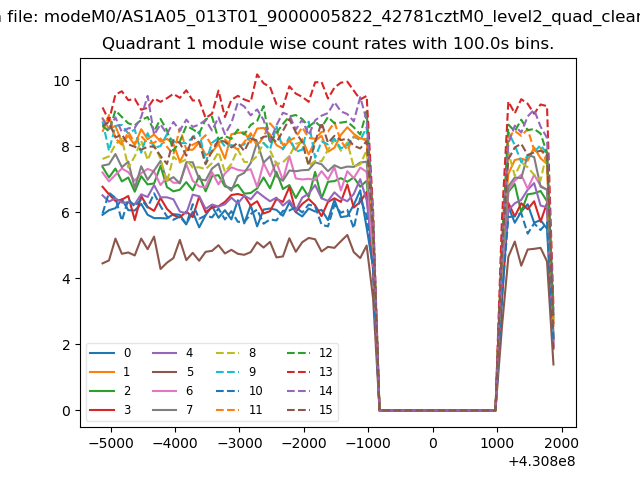
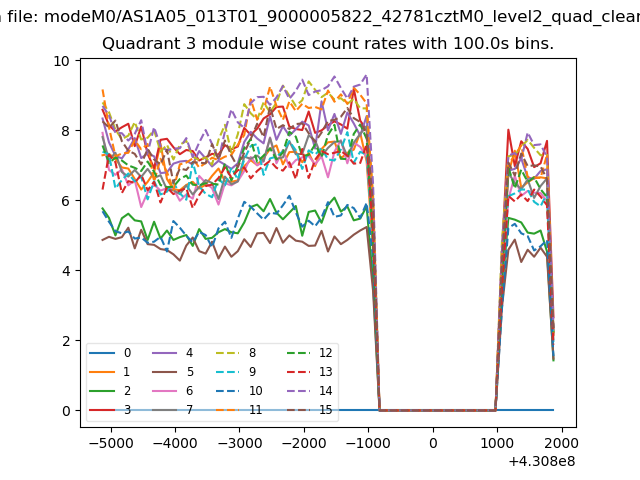
| Module-wise count rates for Quadrant A Data is divided into 100 sec bins |
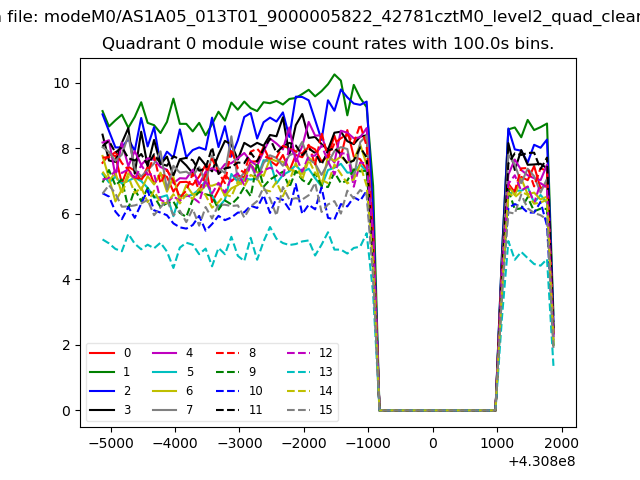 |
 |
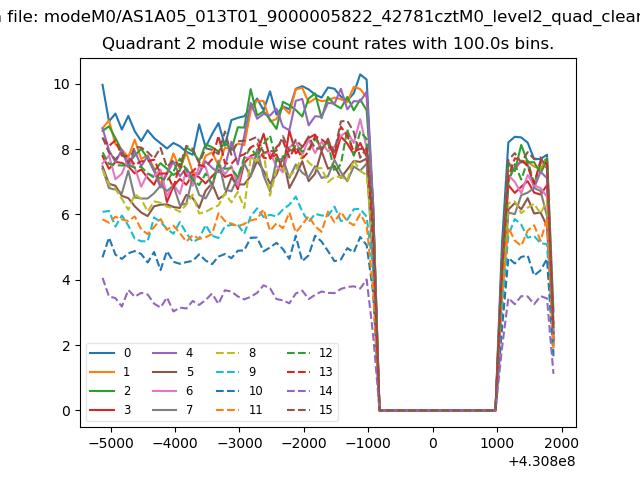
| Module-wise count rates for Quadrant B Data is divided into 100 sec bins |
 |
 |
| Module-wise count rates for Quadrant C Data is divided into 100 sec bins |
 |
 |
| Module-wise count rates for Quadrant D Data is divided into 100 sec bins |
 |
 |
| Parameter | Plot |
|---|---|
| CZT HV Monitor | 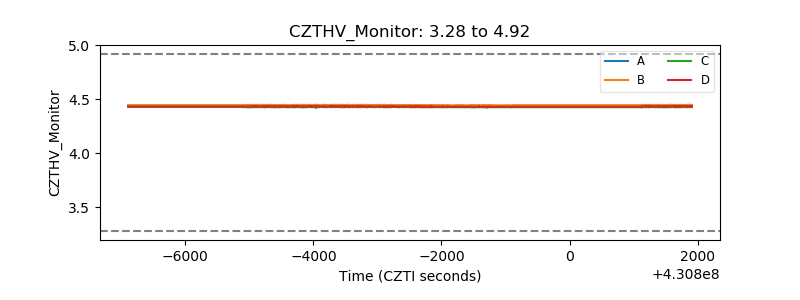 |
| D_VDD | 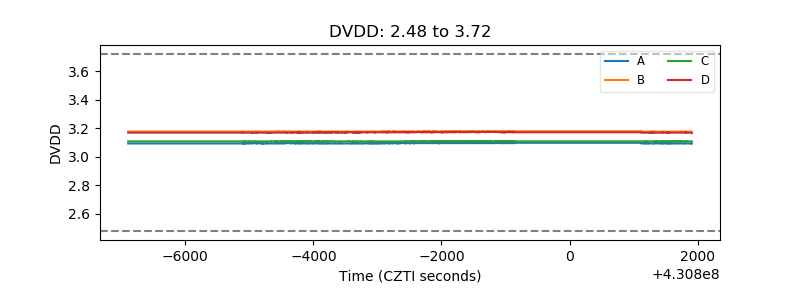 |
| Temperature 1 |  |
| Veto HV Monitor | 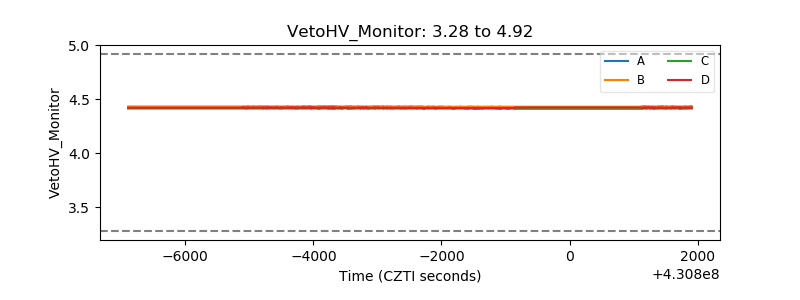 |
| Veto LLD | 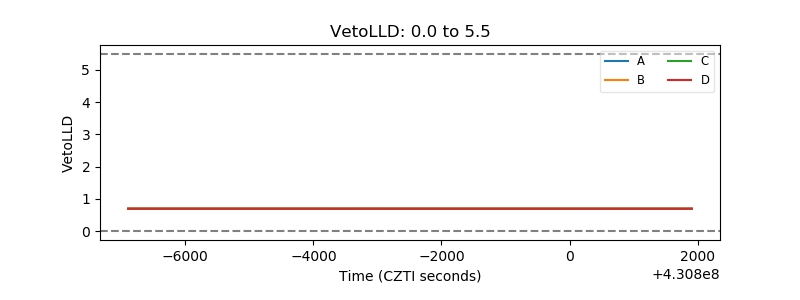 |
| Alpha Counter | 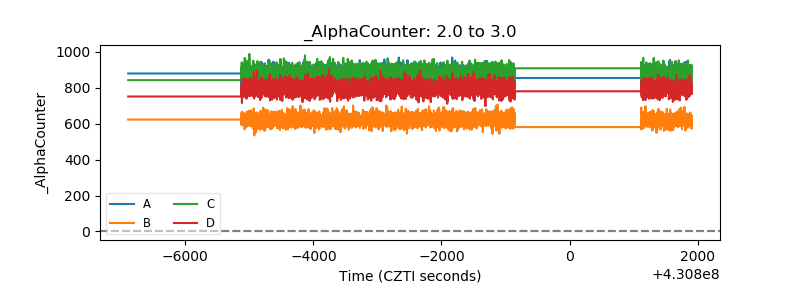 |
| _CPM_Rate | 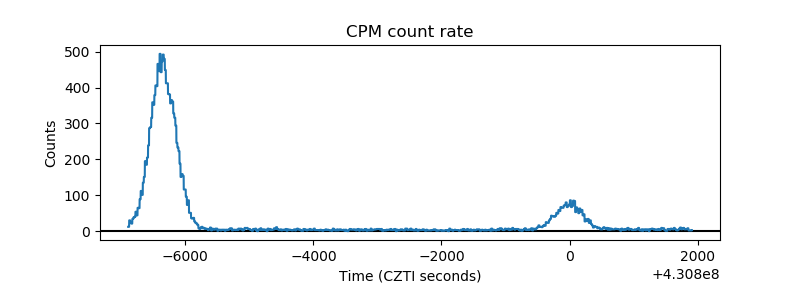 |
| CZT Counter | 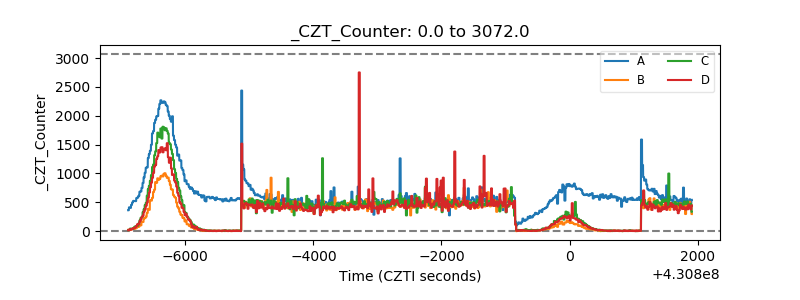 |
| +2.5 Volts monitor | 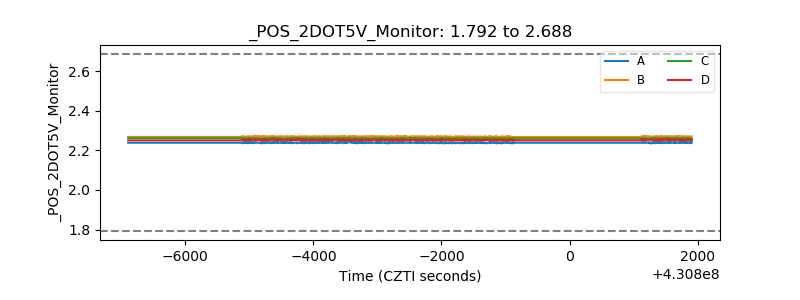 |
| +5 Volts monitor | 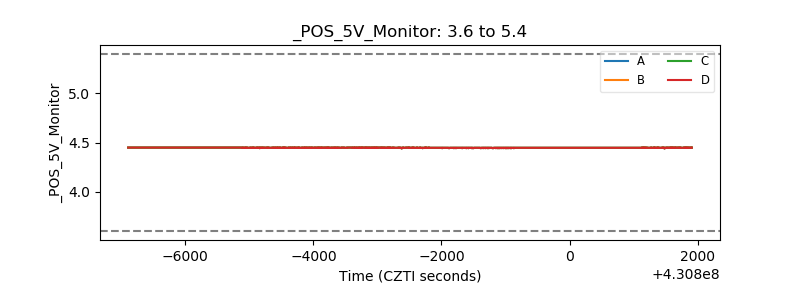 |
| _ROLL_ROT | 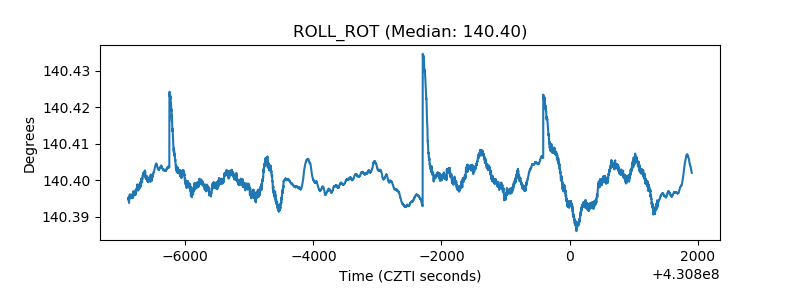 |
| _Roll_DEC | 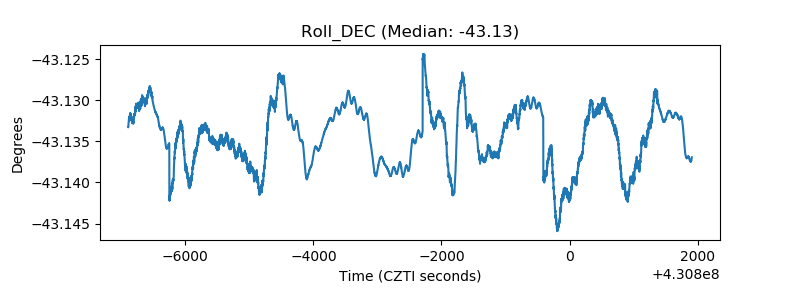 |
| _Roll_RA | 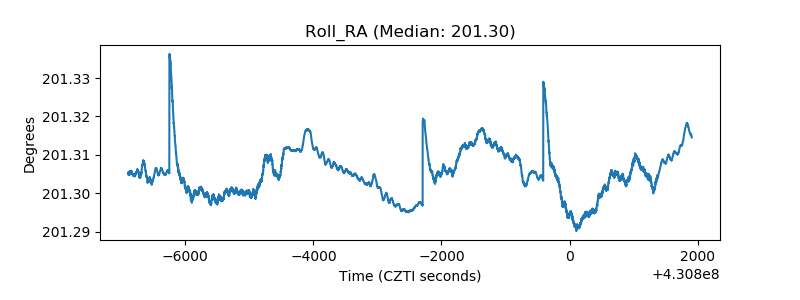 |
| Veto Counter | 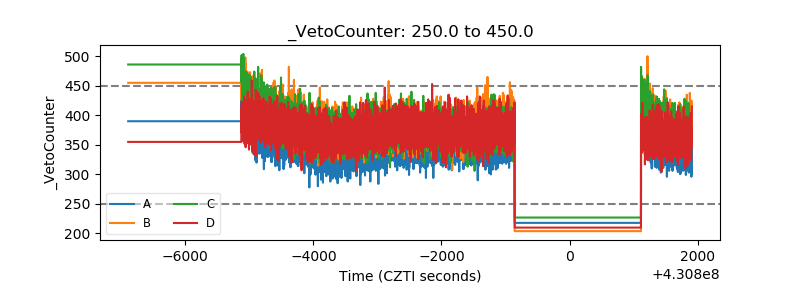 |