| Param | Original file | Final file |
|---|---|---|
| Filename | modeM0/AS1A05_013T01_9000005822_42782cztM0_level2.fits | modeM0/AS1A05_013T01_9000005822_42782cztM0_level2_quad_clean.evt |
| Size (bytes) | 299,851,200 | 90,777,600 |
| Size | 286.0 MB | 86.6 MB |
| Events in quadrant A | 3,039,826 | 609,245 |
| Events in quadrant B | 2,533,004 | 613,645 |
| Events in quadrant C | 2,583,294 | 596,565 |
| Events in quadrant D | 2,522,158 | 551,281 |
| Mode M0 | |||
|---|---|---|---|
| Quadrant | BADHDUFLAG | Total packets | Discarded packets |
| A | 0 | 12085 | 2 |
| B | 0 | 11303 | 2 |
| C | 0 | 10985 | 2 |
| D | 0 | 11465 | 2 |
| Mode M9 | |||
|---|---|---|---|
| Quadrant | BADHDUFLAG | Total packets | Discarded packets |
| A | 0 | 36 | 0 |
| B | 0 | 36 | 0 |
| C | 0 | 36 | 0 |
| D | 0 | 36 | 0 |
| Mode SS | |||
|---|---|---|---|
| Quadrant | BADHDUFLAG | Total packets | Discarded packets |
| A | 0 | 112 | 0 |
| B | 0 | 112 | 0 |
| C | 0 | 112 | 0 |
| D | 0 | 112 | 0 |
| Quadrant | Total seconds | Saturated seconds | Saturation percentage |
|---|---|---|---|
| A | 5402 | 15 | 0.277675% |
| B | 5402 | 45 | 0.833025% |
| C | 5402 | 5 | 0.092558% |
| D | 5402 | 38 | 0.703443% |
Noise dominated data is calculated using 1-second bins in cleaned event files. If a bin has >2000 counts, and if more than 50% of those come from <1% of pixels, then it is considered to be noise-dominated and hence unusable.
| Quadrant | # 1 sec bins | Bins with >0 counts | Bins with >2000 counts | High rate bins dominated by noise | Noise dominated (total time) | Noise dominated (detector-on time) | Marked lightcurve |
|---|---|---|---|---|---|---|---|
| A | 9049 | 5404 | 8 | 8 | 0.09% | 0.15% | 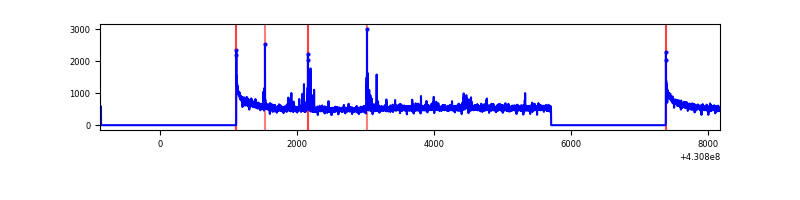 |
| B | 9049 | 5404 | 37 | 37 | 0.41% | 0.68% | 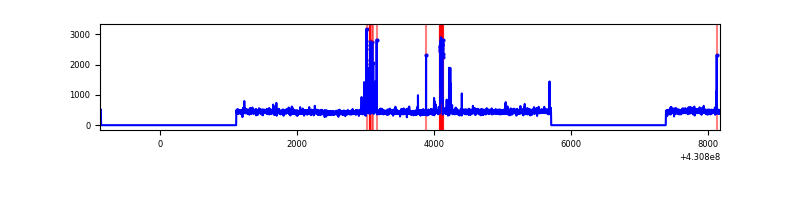 |
| C | 9049 | 5404 | 1 | 1 | 0.01% | 0.02% | 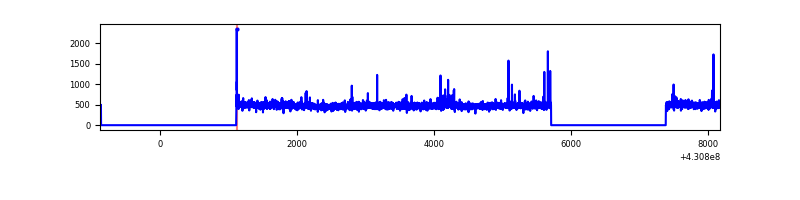 |
| D | 9049 | 5404 | 37 | 37 | 0.41% | 0.68% | 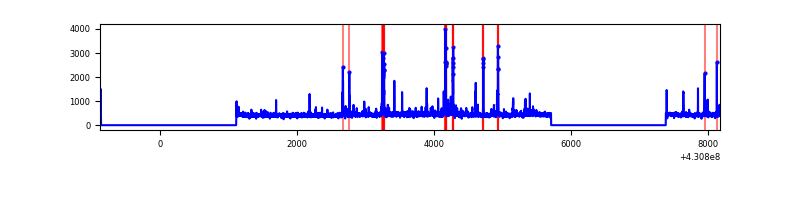 |
Top three noisy pixels from each quadrant. If the there are fewer than three noisy pixels in the level2.evt file, extra rows are filled as -1
| Pixel properties | Quadrant properties | ||||||
|---|---|---|---|---|---|---|---|
| Quadrant | DetID | PixID | Counts | Sigma | Mean | Median | Sigma |
| A | 10 | 83 | 602187 | 4833.6 | 602 | 589 | 124.5 |
| A | 13 | 248 | 61416 | 488.72 | 602 | 589 | 124.5 |
| A | 12 | 189 | 30337 | 239.01 | 602 | 589 | 124.5 |
| B | 5 | 172 | 167605 | 1456.03 | 592 | 576 | 114.7 |
| B | 12 | 111 | 14343 | 120.01 | 592 | 576 | 114.7 |
| B | 11 | 111 | 13418 | 111.95 | 592 | 576 | 114.7 |
| C | 15 | 214 | 225116 | 1626.57 | 588 | 591 | 138.0 |
| C | 14 | 254 | 52834 | 378.47 | 588 | 591 | 138.0 |
| C | 15 | 208 | 7691 | 51.44 | 588 | 591 | 138.0 |
| D | 12 | 233 | 69374 | 478.08 | 588 | 572 | 143.9 |
| D | 5 | 171 | 62597 | 430.99 | 588 | 572 | 143.9 |
| D | 2 | 249 | 53830 | 370.07 | 588 | 572 | 143.9 |
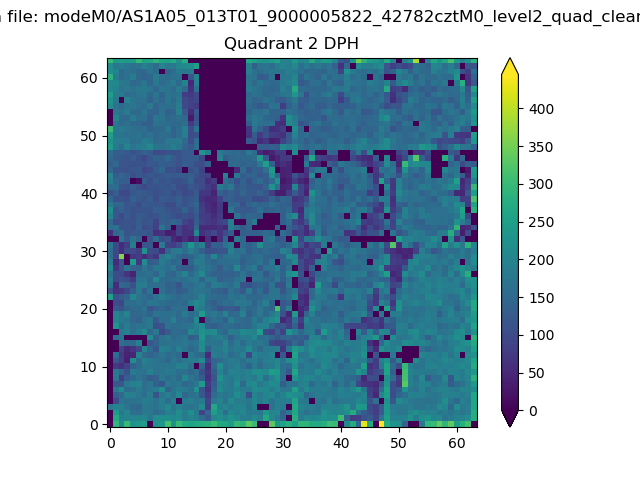
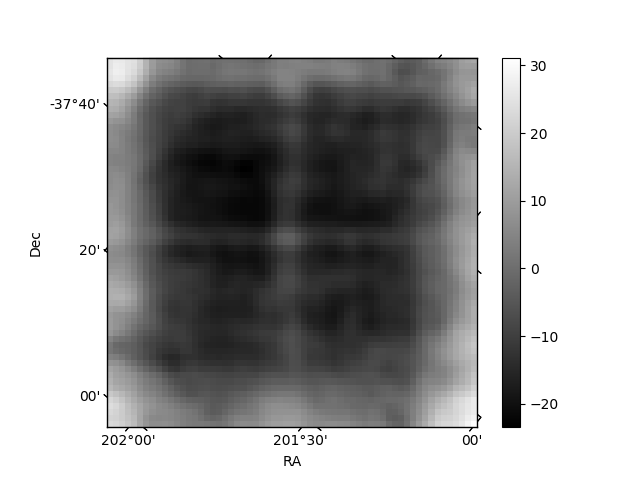
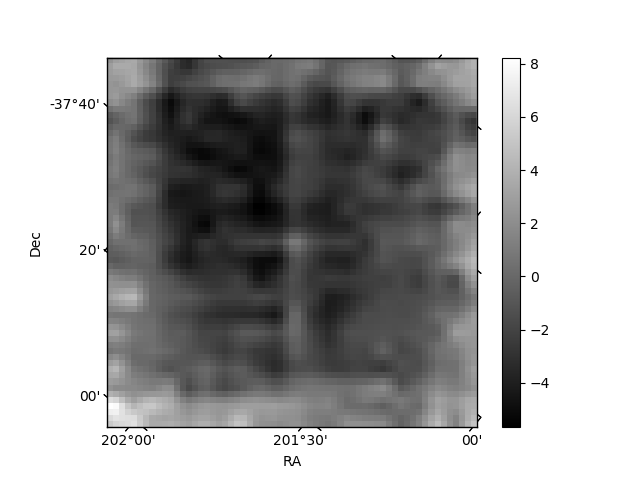
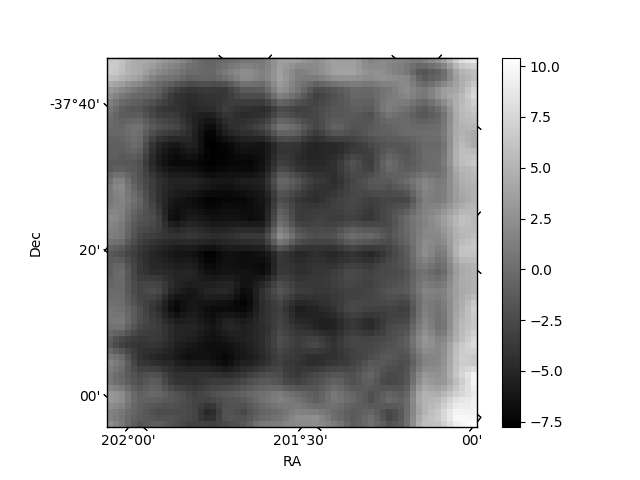
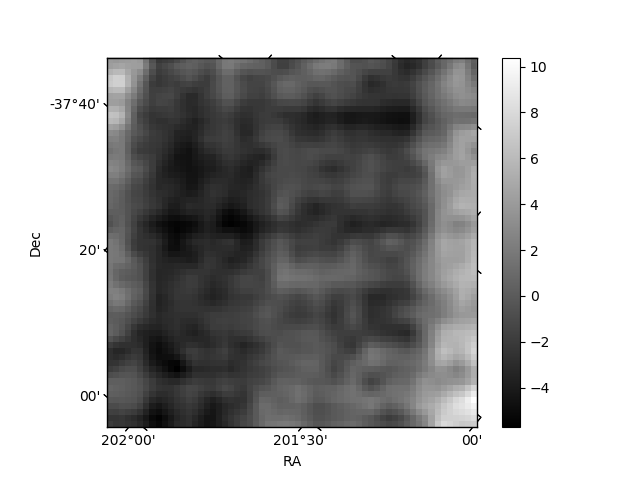
Histogram calculated using DETX and DETY for each event in the final _common_clean file
| Quadrant A | 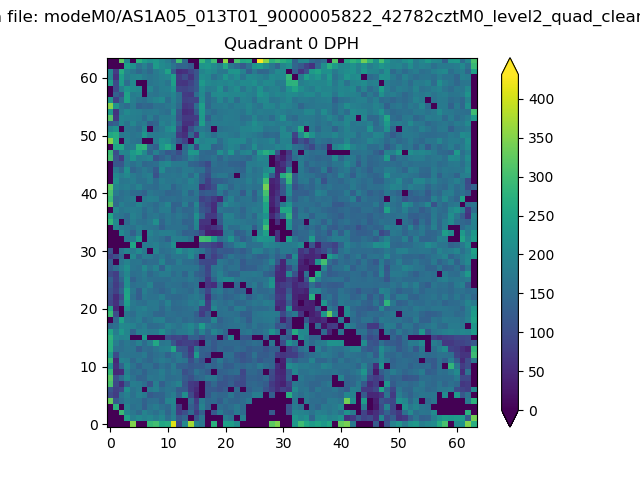 |
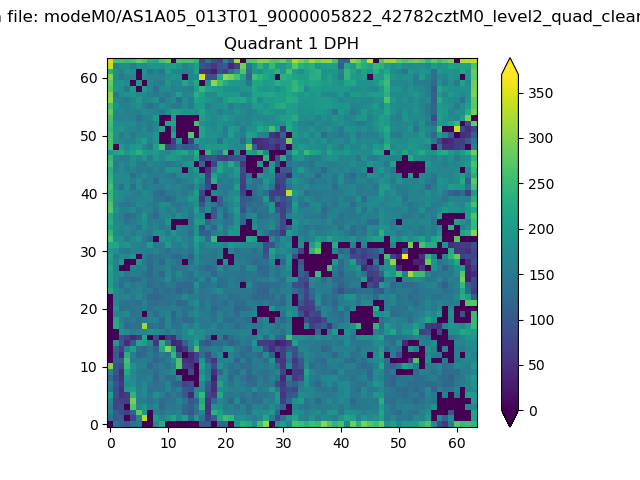 |
Quadrant B |
|---|---|---|---|
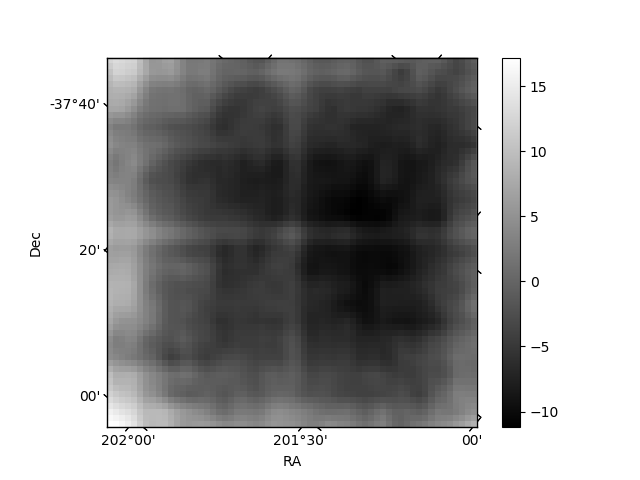
| Quadrant D | 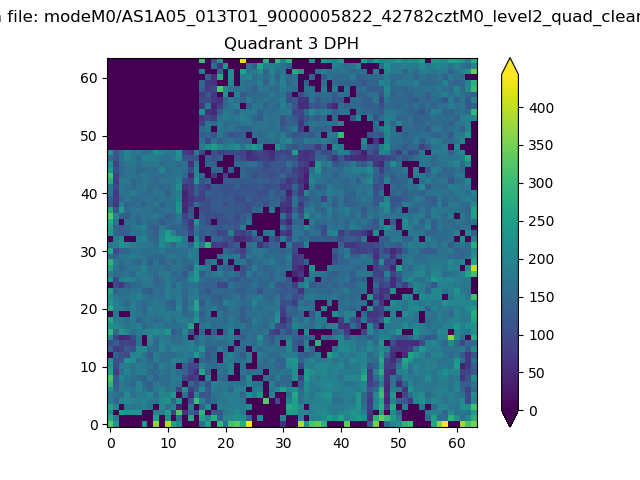 |
 |
Quadrant C |
| Plot type | Count rate plots | Images |
|---|---|---|
| Comparison with Poisson distribution Blue bars denote a histogram of data divided into 1 sec bins. Red curve is a Poisson curve with rate = median count rate of data. |
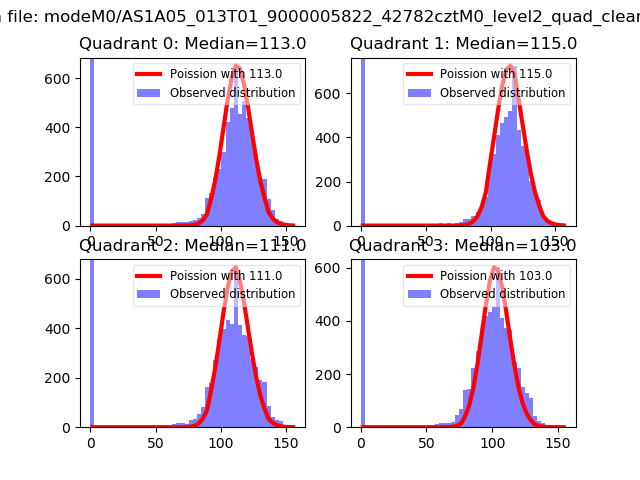 |
 |
| Quadrant-wise count rates Data is divided into 100 sec bins |
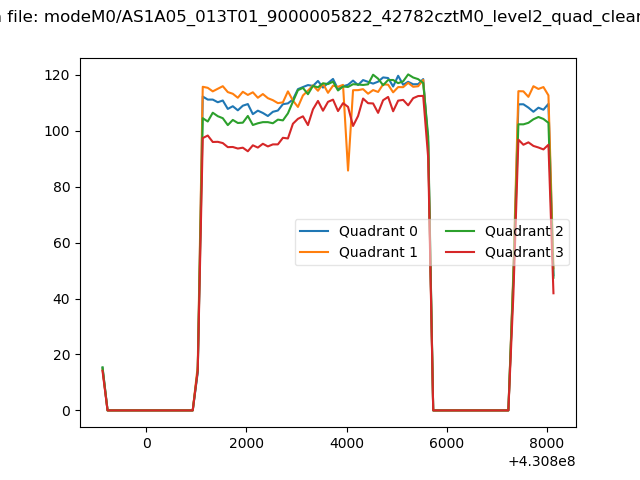 |
|
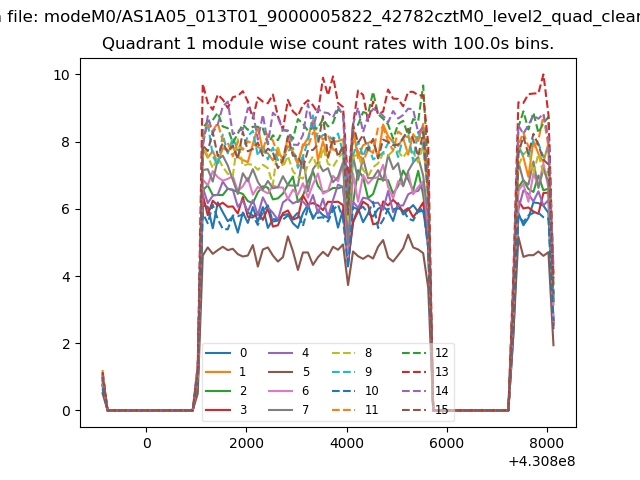
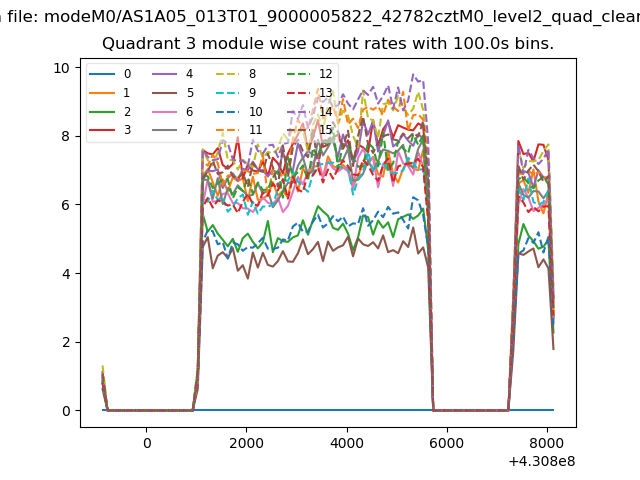
| Module-wise count rates for Quadrant A Data is divided into 100 sec bins |
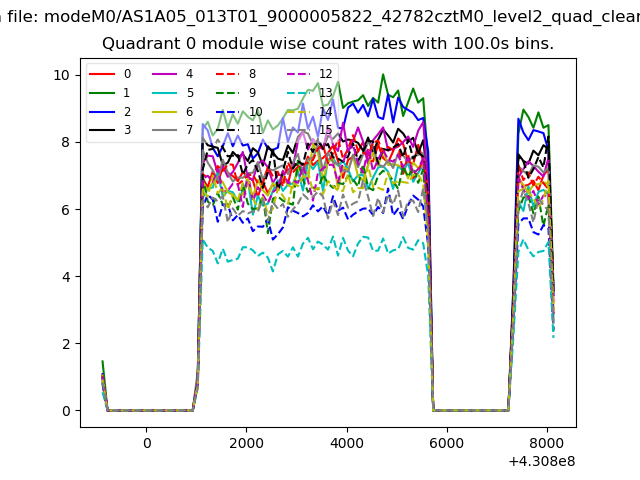 |
 |
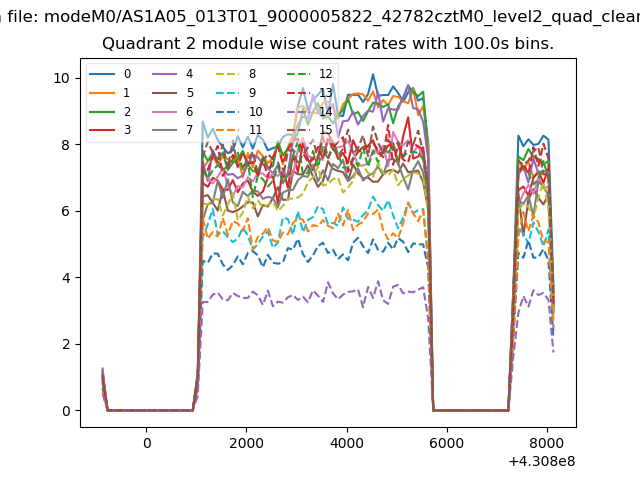
| Module-wise count rates for Quadrant B Data is divided into 100 sec bins |
 |
 |
| Module-wise count rates for Quadrant C Data is divided into 100 sec bins |
 |
 |
| Module-wise count rates for Quadrant D Data is divided into 100 sec bins |
 |
 |
| Parameter | Plot |
|---|---|
| CZT HV Monitor | 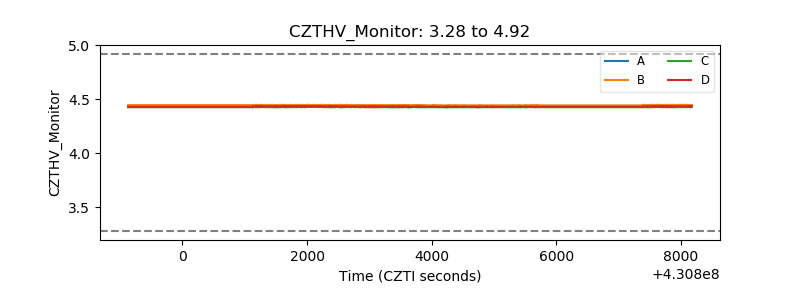 |
| D_VDD | 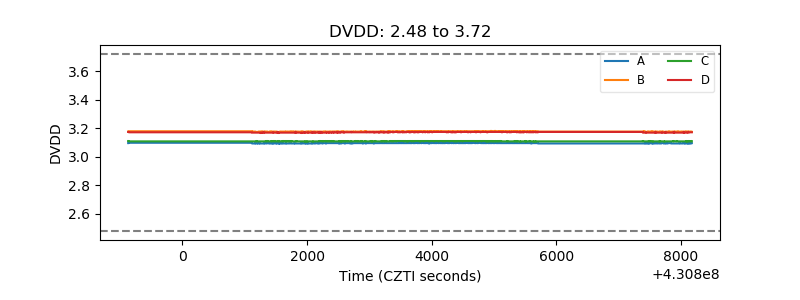 |
| Temperature 1 | 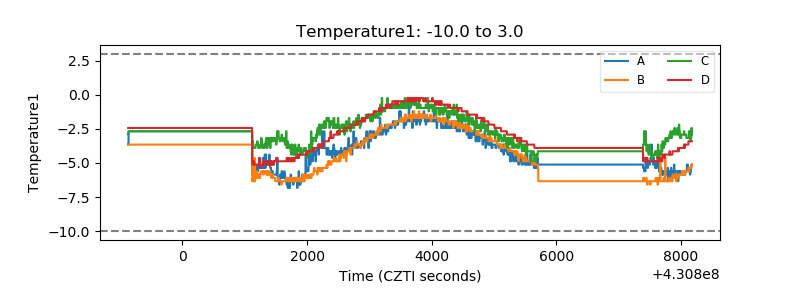 |
| Veto HV Monitor | 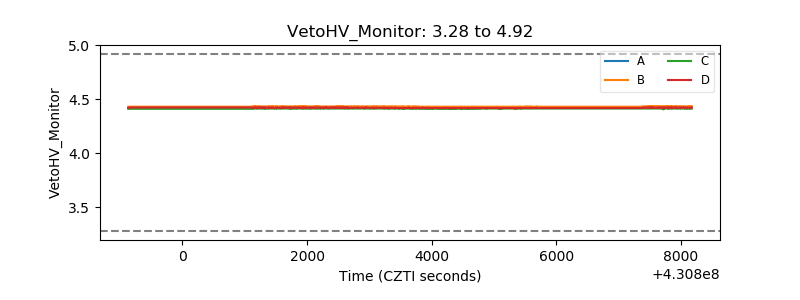 |
| Veto LLD | 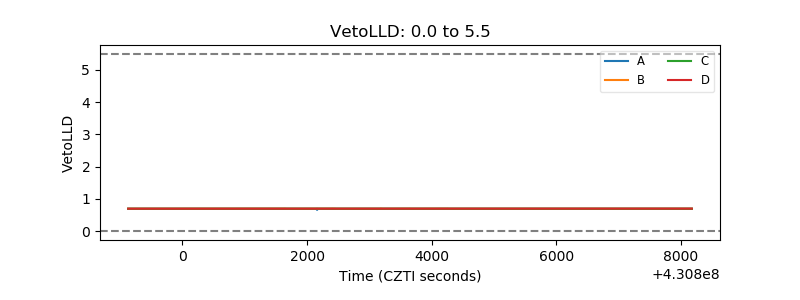 |
| Alpha Counter | 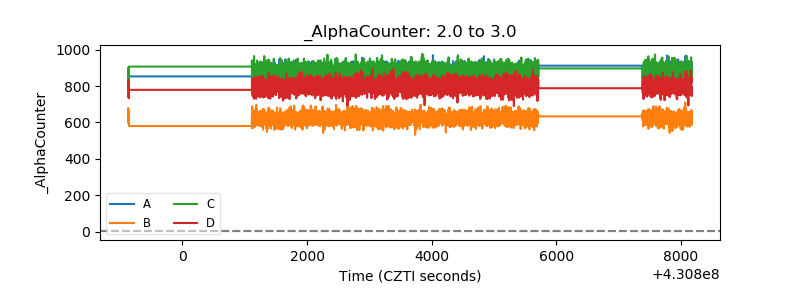 |
| _CPM_Rate | 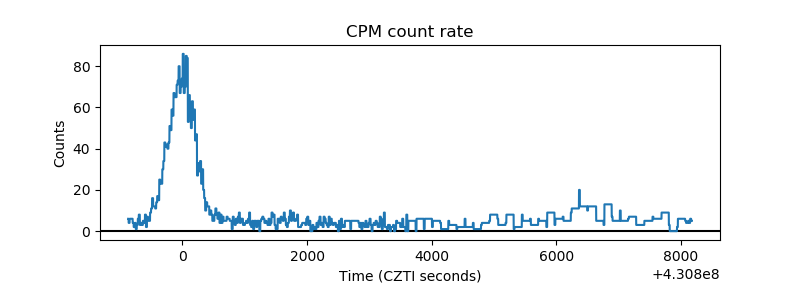 |
| CZT Counter | 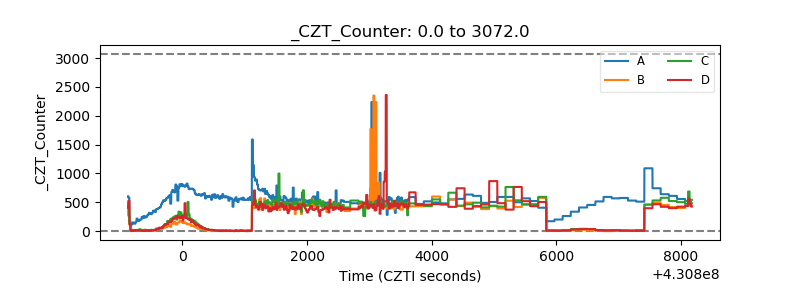 |
| +2.5 Volts monitor | 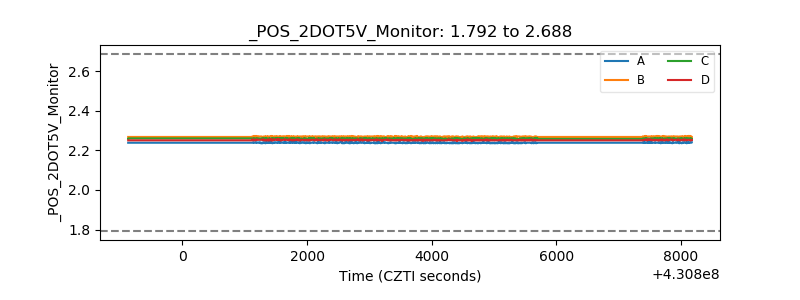 |
| +5 Volts monitor |  |
| _ROLL_ROT | 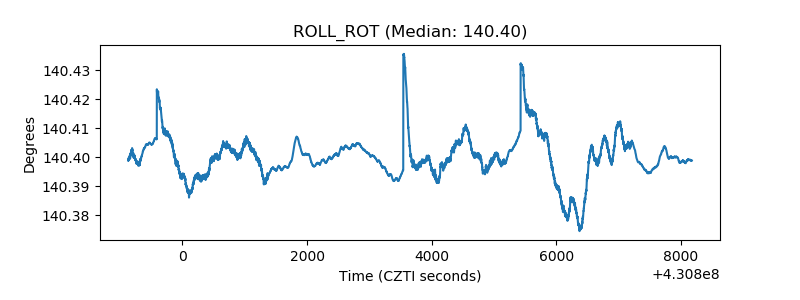 |
| _Roll_DEC | 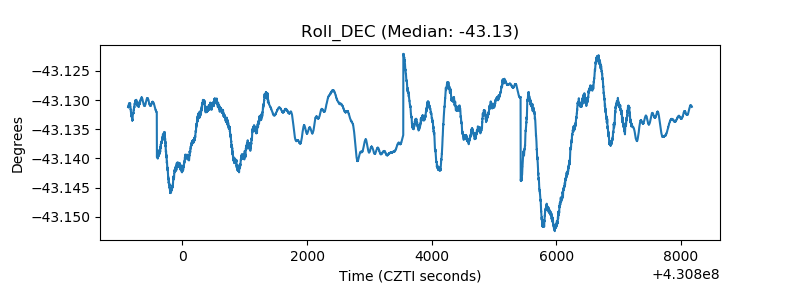 |
| _Roll_RA | 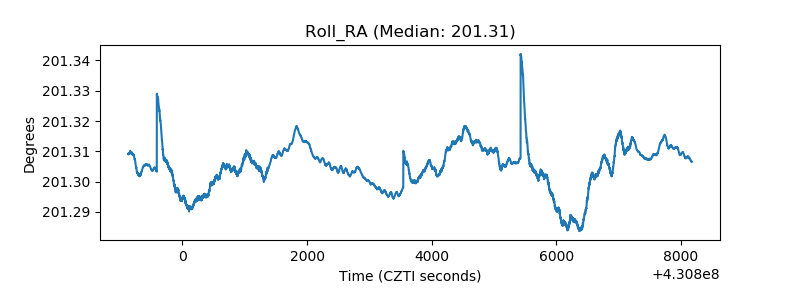 |
| Veto Counter | 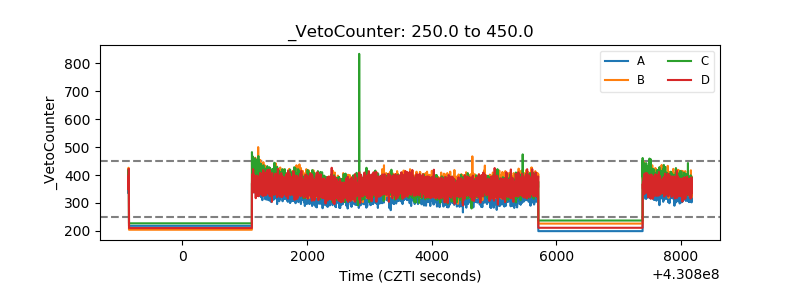 |