| Param | Original file | Final file |
|---|---|---|
| Filename | modeM0/AS1A05_013T01_9000005822_42783cztM0_level2.fits | modeM0/AS1A05_013T01_9000005822_42783cztM0_level2_quad_clean.evt |
| Size (bytes) | 328,089,600 | 98,141,760 |
| Size | 312.9 MB | 93.6 MB |
| Events in quadrant A | 3,185,593 | 658,617 |
| Events in quadrant B | 2,613,393 | 660,409 |
| Events in quadrant C | 2,818,779 | 648,160 |
| Events in quadrant D | 3,070,113 | 594,103 |
| Mode M0 | |||
|---|---|---|---|
| Quadrant | BADHDUFLAG | Total packets | Discarded packets |
| A | 0 | 12754 | 2 |
| B | 0 | 11941 | 2 |
| C | 0 | 11987 | 2 |
| D | 0 | 13275 | 2 |
| Mode M9 | |||
|---|---|---|---|
| Quadrant | BADHDUFLAG | Total packets | Discarded packets |
| A | 0 | 30 | 0 |
| B | 0 | 30 | 0 |
| C | 0 | 30 | 0 |
| D | 0 | 30 | 0 |
| Mode SS | |||
|---|---|---|---|
| Quadrant | BADHDUFLAG | Total packets | Discarded packets |
| A | 0 | 124 | 0 |
| B | 0 | 124 | 0 |
| C | 0 | 124 | 0 |
| D | 0 | 124 | 0 |
| Quadrant | Total seconds | Saturated seconds | Saturation percentage |
|---|---|---|---|
| A | 5863 | 12 | 0.204673% |
| B | 5864 | 15 | 0.255798% |
| C | 5864 | 5 | 0.085266% |
| D | 5864 | 69 | 1.176671% |
Noise dominated data is calculated using 1-second bins in cleaned event files. If a bin has >2000 counts, and if more than 50% of those come from <1% of pixels, then it is considered to be noise-dominated and hence unusable.
| Quadrant | # 1 sec bins | Bins with >0 counts | Bins with >2000 counts | High rate bins dominated by noise | Noise dominated (total time) | Noise dominated (detector-on time) | Marked lightcurve |
|---|---|---|---|---|---|---|---|
| A | 8939 | 5865 | 4 | 4 | 0.04% | 0.07% | 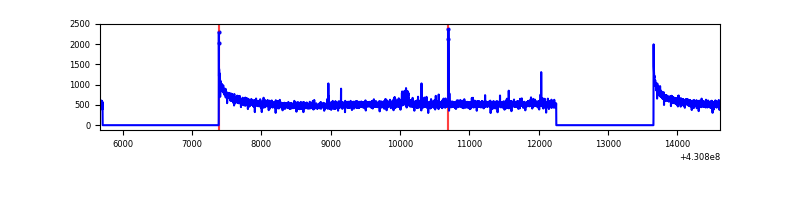 |
| B | 8940 | 5866 | 8 | 8 | 0.09% | 0.14% | 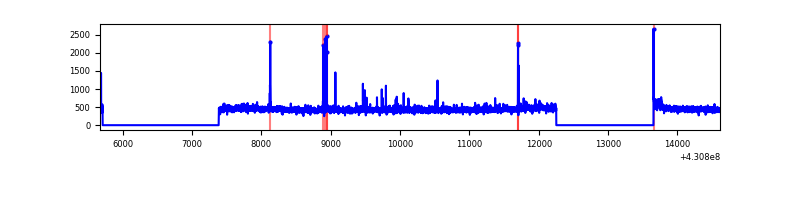 |
| C | 8940 | 5866 | 1 | 1 | 0.01% | 0.02% | 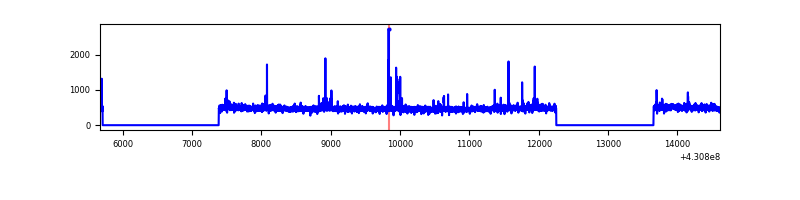 |
| D | 8940 | 5866 | 73 | 73 | 0.82% | 1.24% | 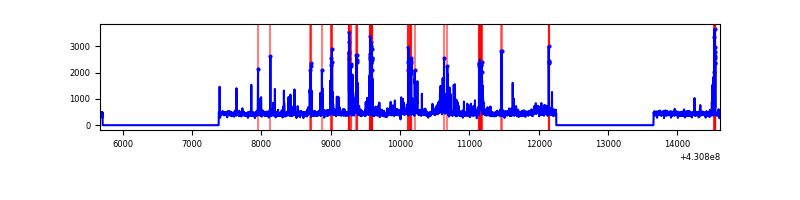 |
Top three noisy pixels from each quadrant. If the there are fewer than three noisy pixels in the level2.evt file, extra rows are filled as -1
| Pixel properties | Quadrant properties | ||||||
|---|---|---|---|---|---|---|---|
| Quadrant | DetID | PixID | Counts | Sigma | Mean | Median | Sigma |
| A | 10 | 83 | 619404 | 4656.03 | 651 | 638 | 132.9 |
| A | 12 | 189 | 22329 | 163.22 | 651 | 638 | 132.9 |
| A | 13 | 6 | 12049 | 85.86 | 651 | 638 | 132.9 |
| B | 5 | 172 | 26269 | 204.86 | 642 | 624 | 125.2 |
| B | 0 | 229 | 25291 | 197.05 | 642 | 624 | 125.2 |
| B | 12 | 111 | 15761 | 120.92 | 642 | 624 | 125.2 |
| C | 15 | 214 | 237833 | 1587.15 | 637 | 640 | 149.4 |
| C | 14 | 254 | 84666 | 562.25 | 637 | 640 | 149.4 |
| C | 7 | 220 | 4243 | 24.11 | 637 | 640 | 149.4 |
| D | 12 | 233 | 203287 | 1301.05 | 636 | 617 | 155.8 |
| D | 2 | 249 | 192019 | 1228.72 | 636 | 617 | 155.8 |
| D | 5 | 171 | 147212 | 941.07 | 636 | 617 | 155.8 |
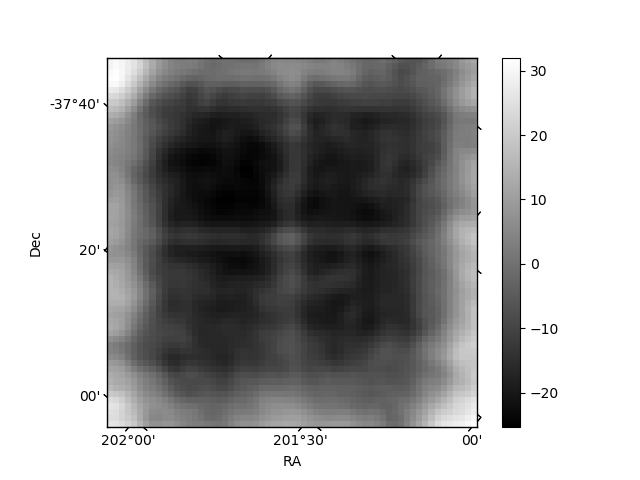
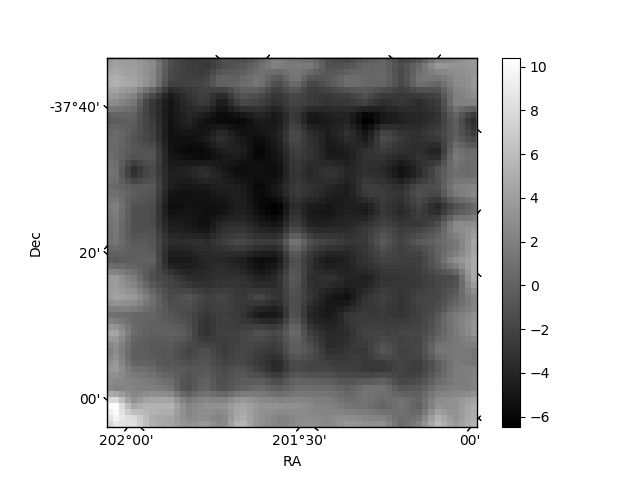
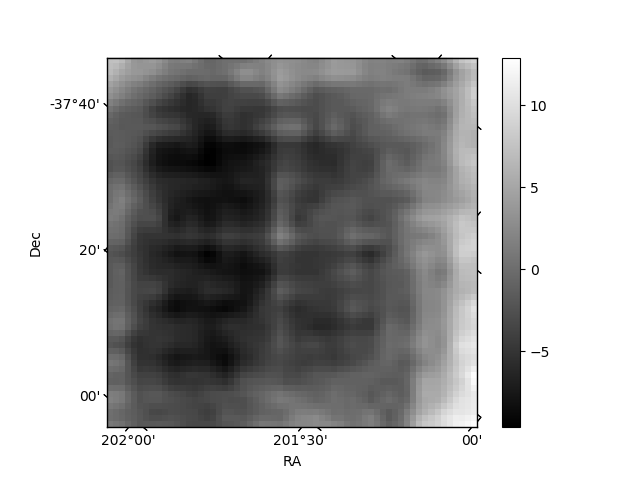
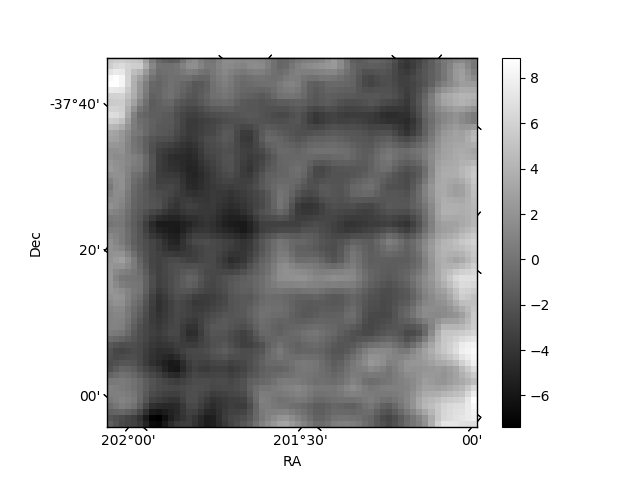
Histogram calculated using DETX and DETY for each event in the final _common_clean file
| Quadrant A | 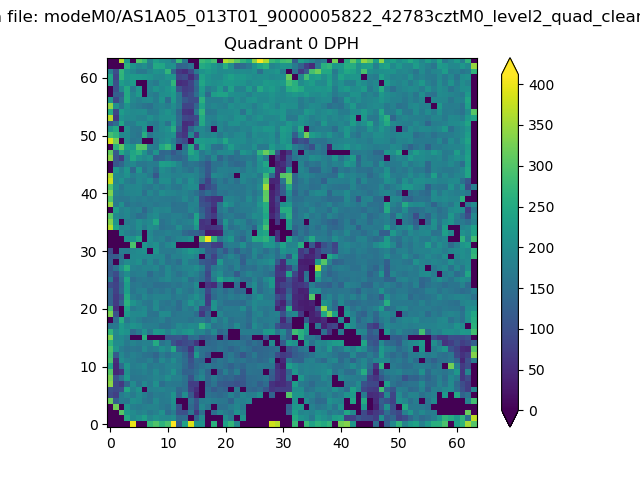 |
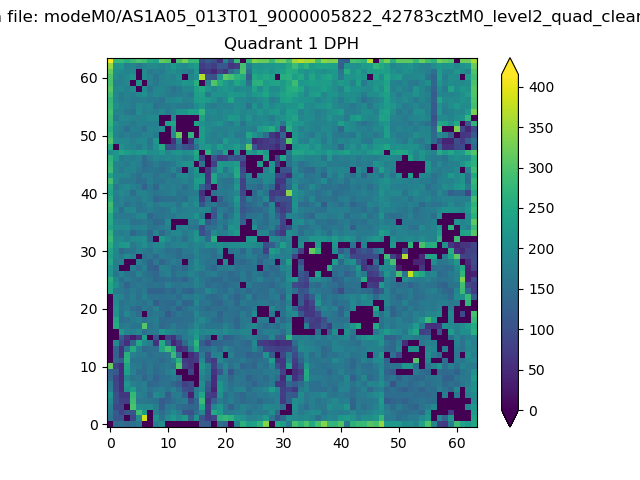 |
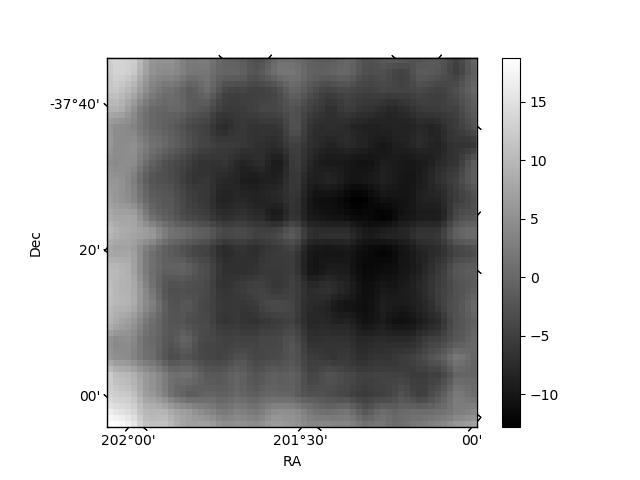
Quadrant B |
|---|---|---|---|
| Quadrant D | 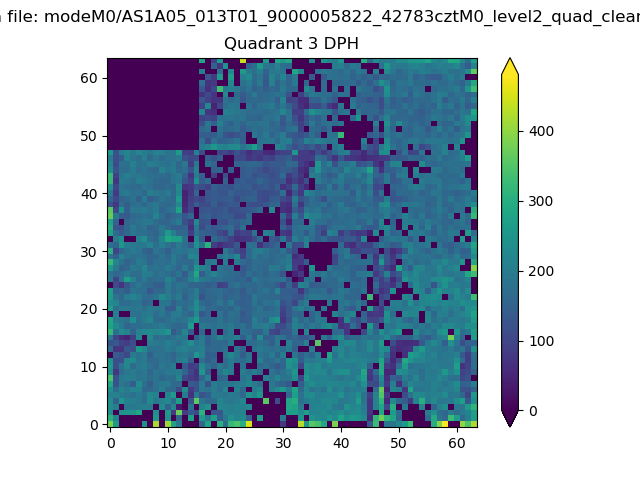 |
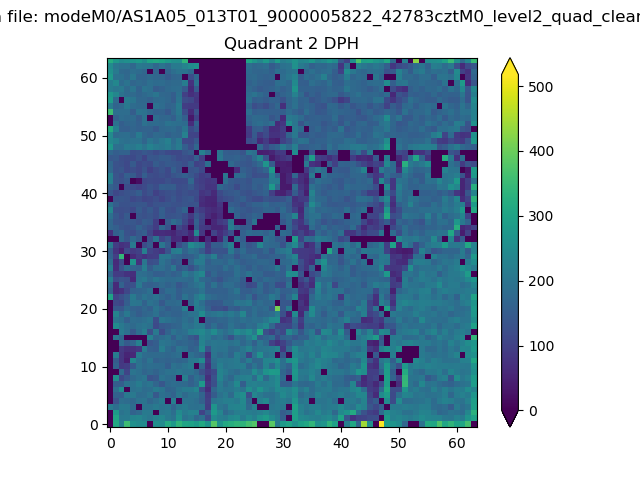 |
Quadrant C |
| Plot type | Count rate plots | Images |
|---|---|---|
| Comparison with Poisson distribution Blue bars denote a histogram of data divided into 1 sec bins. Red curve is a Poisson curve with rate = median count rate of data. |
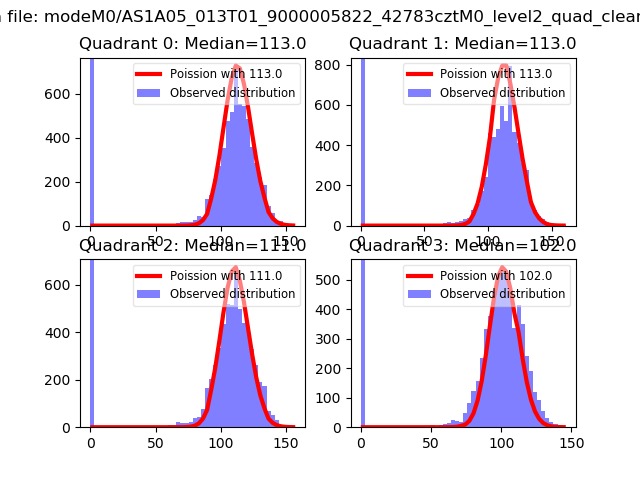 |
 |
| Quadrant-wise count rates Data is divided into 100 sec bins |
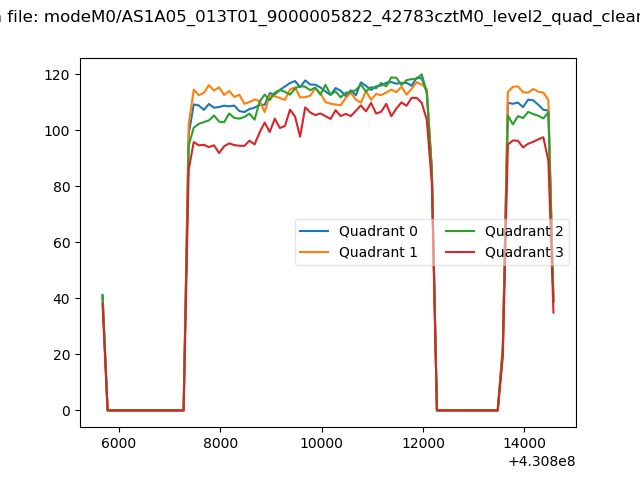 |
|
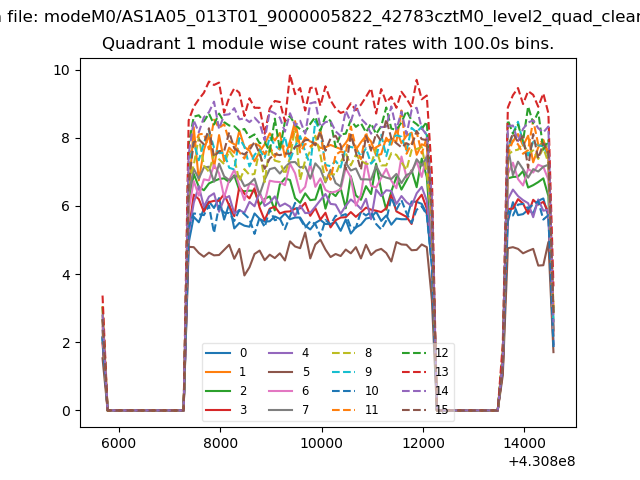
| Module-wise count rates for Quadrant A Data is divided into 100 sec bins |
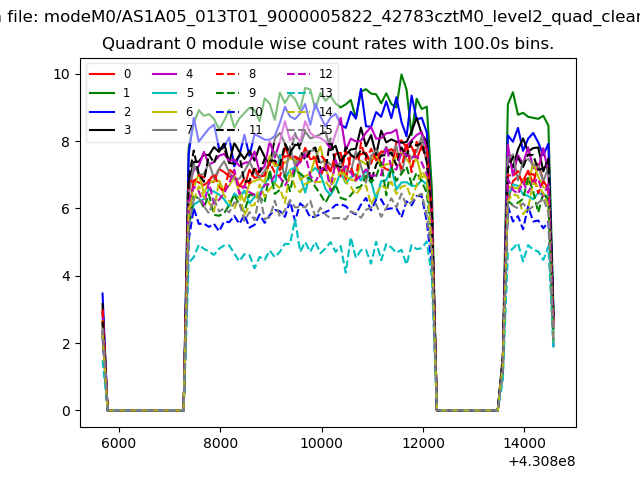 |
 |
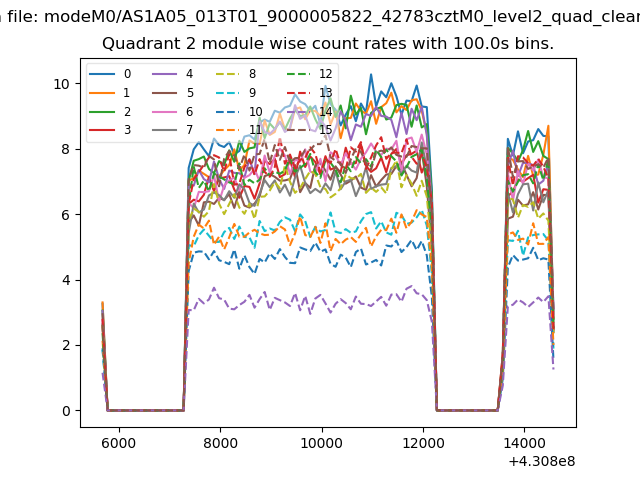
| Module-wise count rates for Quadrant B Data is divided into 100 sec bins |
 |
 |
| Module-wise count rates for Quadrant C Data is divided into 100 sec bins |
 |
 |
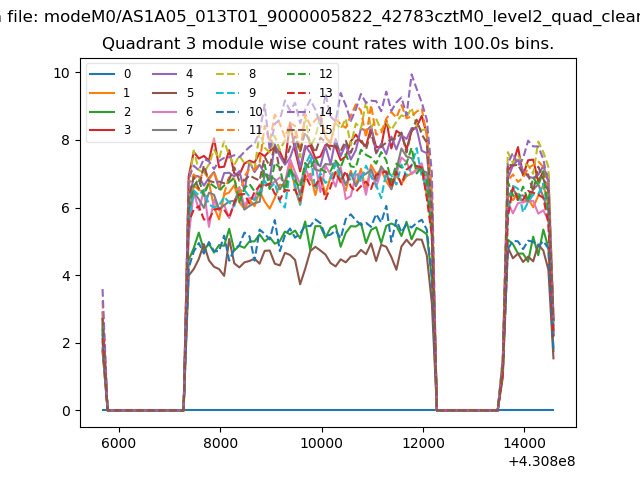
| Module-wise count rates for Quadrant D Data is divided into 100 sec bins |
 |
 |
| Parameter | Plot |
|---|---|
| CZT HV Monitor | 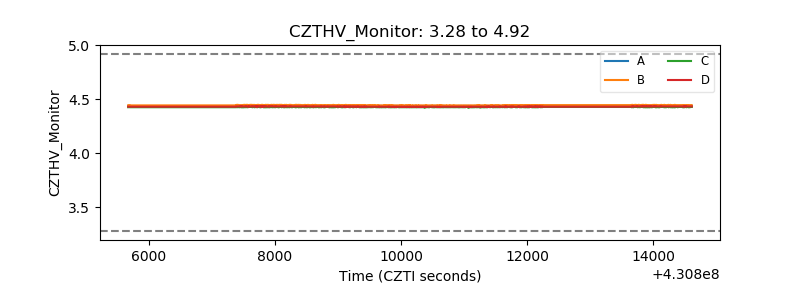 |
| D_VDD | 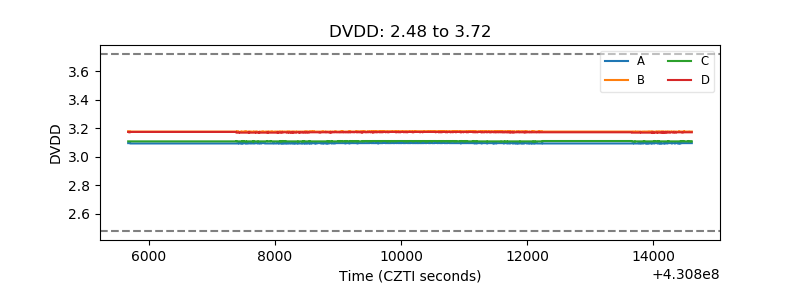 |
| Temperature 1 | 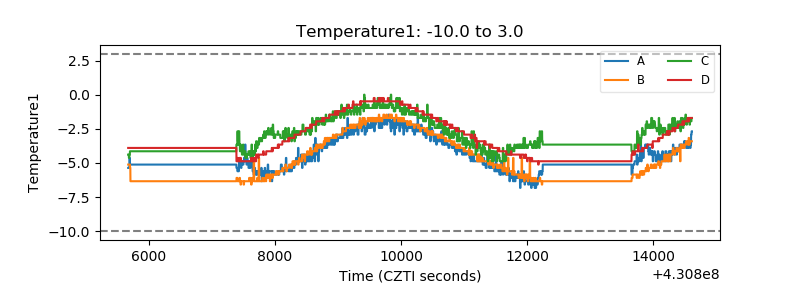 |
| Veto HV Monitor | 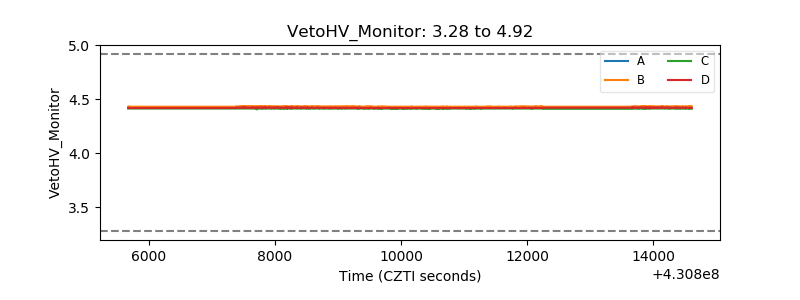 |
| Veto LLD | 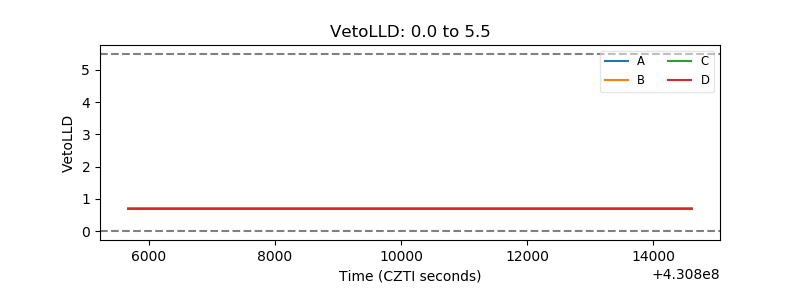 |
| Alpha Counter | 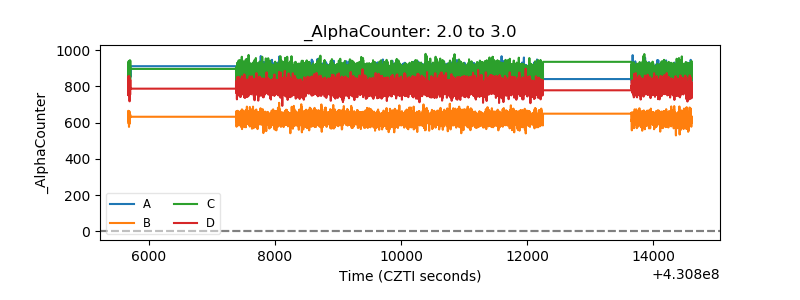 |
| _CPM_Rate | 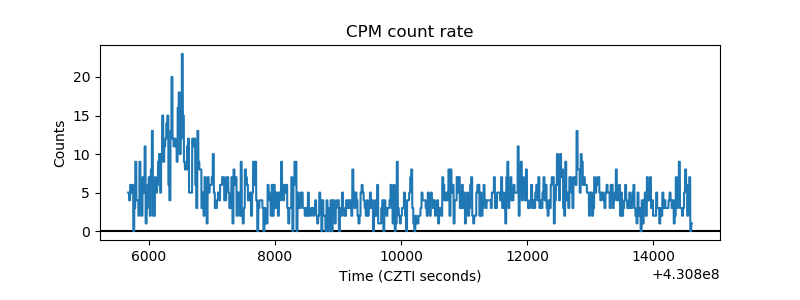 |
| CZT Counter | 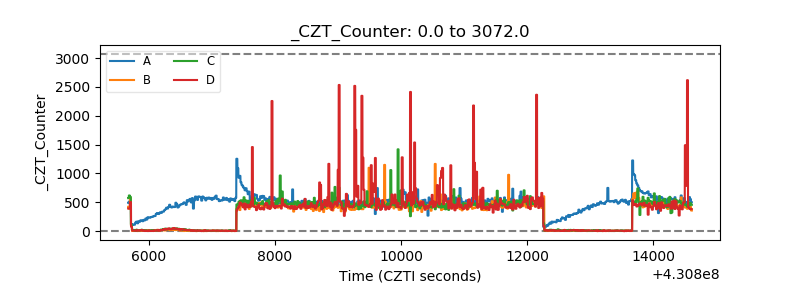 |
| +2.5 Volts monitor | 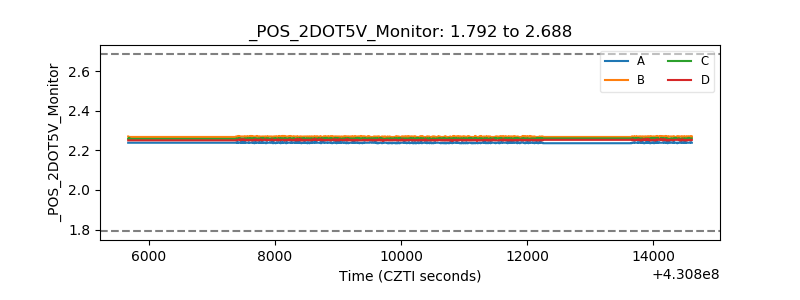 |
| +5 Volts monitor | 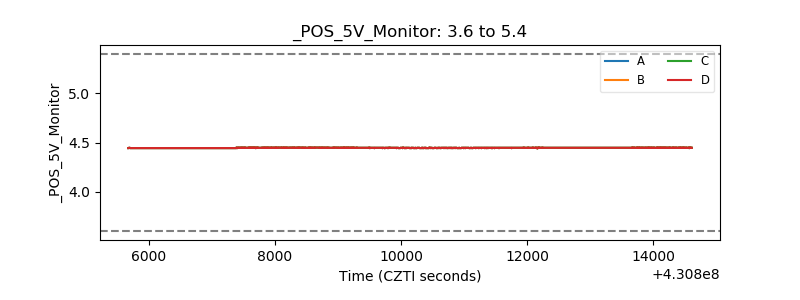 |
| _ROLL_ROT | 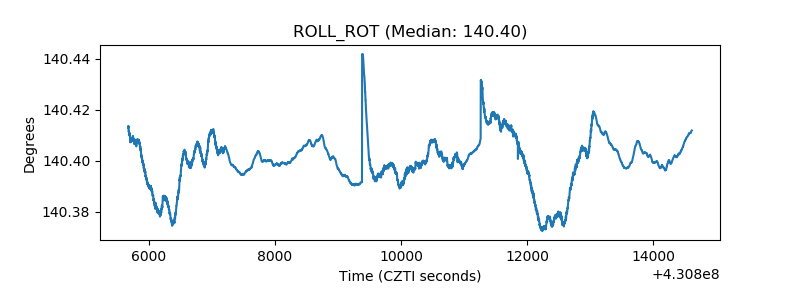 |
| _Roll_DEC |  |
| _Roll_RA | 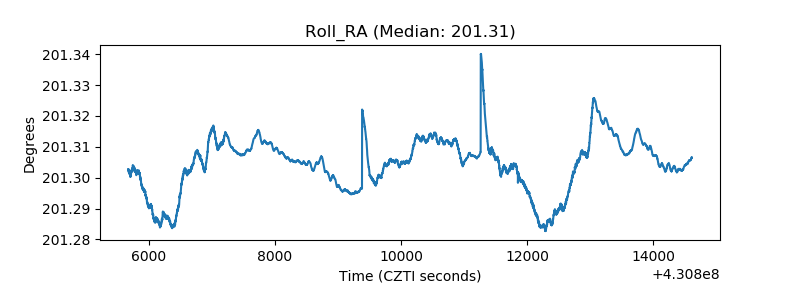 |
| Veto Counter | 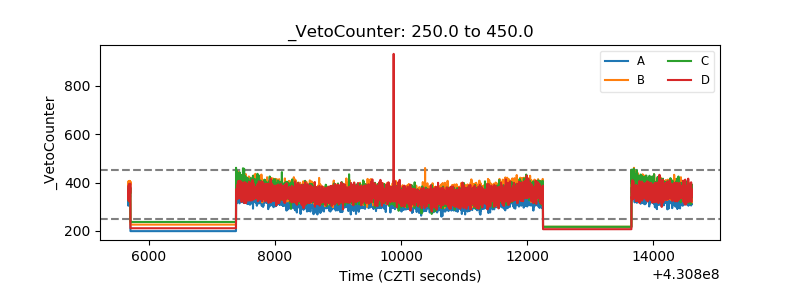 |