| Param | Original file | Final file |
|---|---|---|
| Filename | modeM0/AS1A05_013T01_9000005822_42784cztM0_level2.fits | modeM0/AS1A05_013T01_9000005822_42784cztM0_level2_quad_clean.evt |
| Size (bytes) | 527,947,200 | 94,656,960 |
| Size | 503.5 MB | 90.3 MB |
| Events in quadrant A | 3,528,507 | 665,648 |
| Events in quadrant B | 5,032,390 | 564,750 |
| Events in quadrant C | 3,307,947 | 643,274 |
| Events in quadrant D | 7,212,800 | 576,368 |
| Mode M0 | |||
|---|---|---|---|
| Quadrant | BADHDUFLAG | Total packets | Discarded packets |
| A | 0 | 13855 | 2 |
| B | 0 | 19097 | 2 |
| C | 0 | 13494 | 2 |
| D | 0 | 25527 | 2 |
| Mode M9 | |||
|---|---|---|---|
| Quadrant | BADHDUFLAG | Total packets | Discarded packets |
| A | 0 | 13 | 0 |
| B | 0 | 13 | 0 |
| C | 0 | 13 | 0 |
| D | 0 | 13 | 0 |
| Mode SS | |||
|---|---|---|---|
| Quadrant | BADHDUFLAG | Total packets | Discarded packets |
| A | 0 | 122 | 0 |
| B | 0 | 122 | 0 |
| C | 0 | 122 | 0 |
| D | 0 | 122 | 0 |
| Quadrant | Total seconds | Saturated seconds | Saturation percentage |
|---|---|---|---|
| A | 5948 | 61 | 1.025555% |
| B | 5949 | 982 | 16.506976% |
| C | 5949 | 176 | 2.958480% |
| D | 5949 | 650 | 10.926206% |
Noise dominated data is calculated using 1-second bins in cleaned event files. If a bin has >2000 counts, and if more than 50% of those come from <1% of pixels, then it is considered to be noise-dominated and hence unusable.
| Quadrant | # 1 sec bins | Bins with >0 counts | Bins with >2000 counts | High rate bins dominated by noise | Noise dominated (total time) | Noise dominated (detector-on time) | Marked lightcurve |
|---|---|---|---|---|---|---|---|
| A | 7261 | 5949 | 47 | 47 | 0.65% | 0.79% | 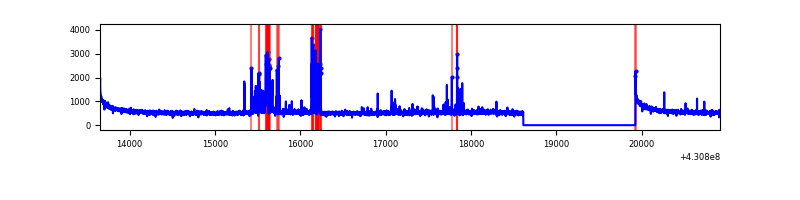 |
| B | 7262 | 5950 | 906 | 906 | 12.48% | 15.23% | 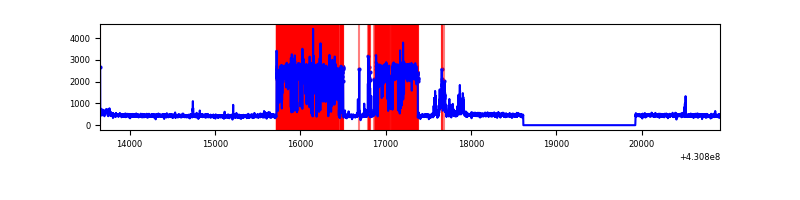 |
| C | 7262 | 5950 | 179 | 179 | 2.46% | 3.01% | 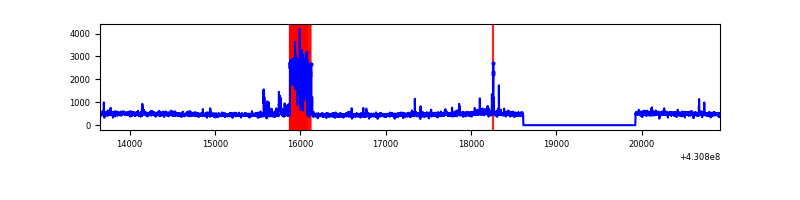 |
| D | 7262 | 5950 | 869 | 869 | 11.97% | 14.61% | 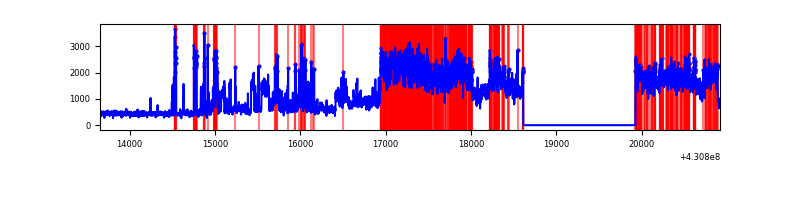 |
Top three noisy pixels from each quadrant. If the there are fewer than three noisy pixels in the level2.evt file, extra rows are filled as -1
| Pixel properties | Quadrant properties | ||||||
|---|---|---|---|---|---|---|---|
| Quadrant | DetID | PixID | Counts | Sigma | Mean | Median | Sigma |
| A | 10 | 83 | 637500 | 4694.07 | 664 | 649 | 135.7 |
| A | 13 | 248 | 290767 | 2138.39 | 664 | 649 | 135.7 |
| A | 13 | 6 | 16924 | 119.96 | 664 | 649 | 135.7 |
| B | 0 | 229 | 2556283 | 22197.71 | 587 | 570 | 115.1 |
| B | 10 | 247 | 131398 | 1136.31 | 587 | 570 | 115.1 |
| B | 12 | 111 | 14468 | 120.71 | 587 | 570 | 115.1 |
| C | 14 | 254 | 541927 | 3585.2 | 641 | 643 | 151.0 |
| C | 15 | 214 | 239383 | 1581.3 | 641 | 643 | 151.0 |
| C | 5 | 250 | 16525 | 105.19 | 641 | 643 | 151.0 |
| D | 13 | 169 | 4283855 | 27013.23 | 638 | 621 | 158.6 |
| D | 12 | 233 | 251103 | 1579.72 | 638 | 621 | 158.6 |
| D | 5 | 171 | 109188 | 684.7 | 638 | 621 | 158.6 |
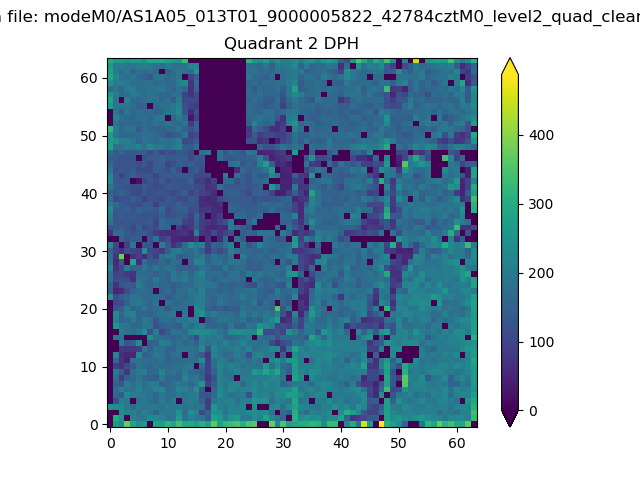
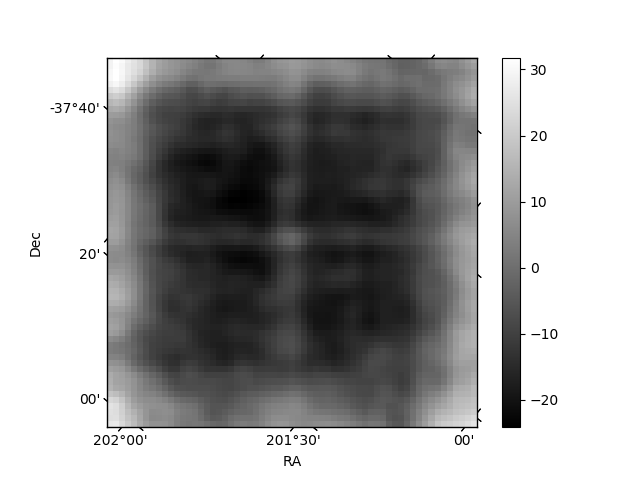
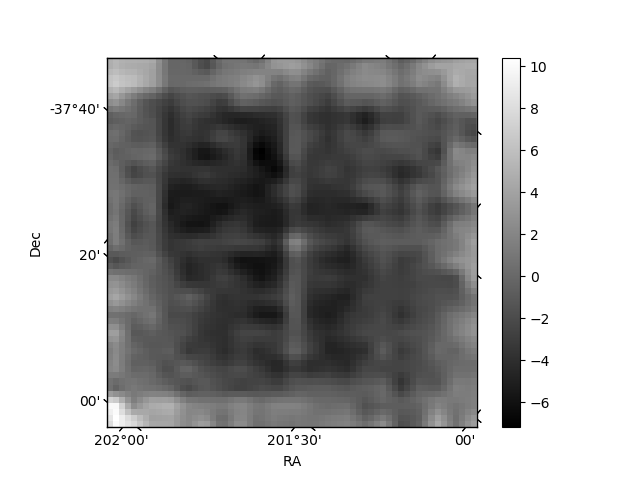
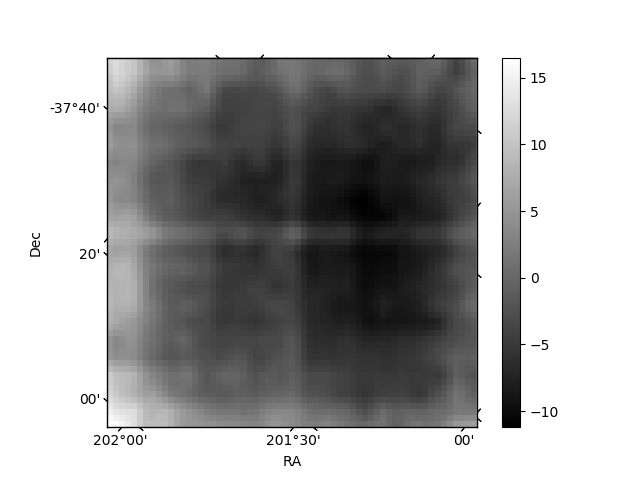
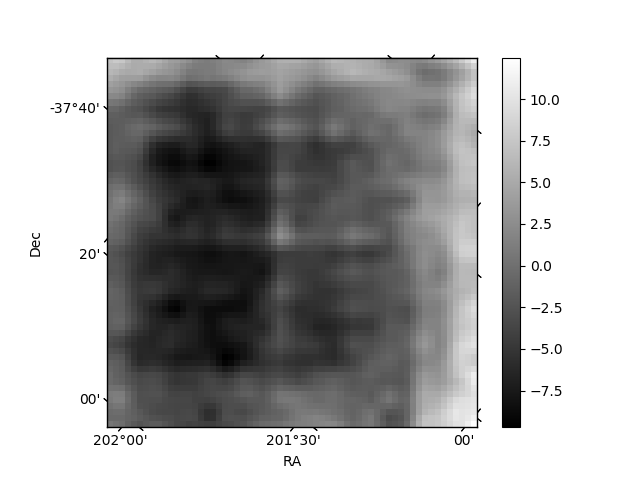
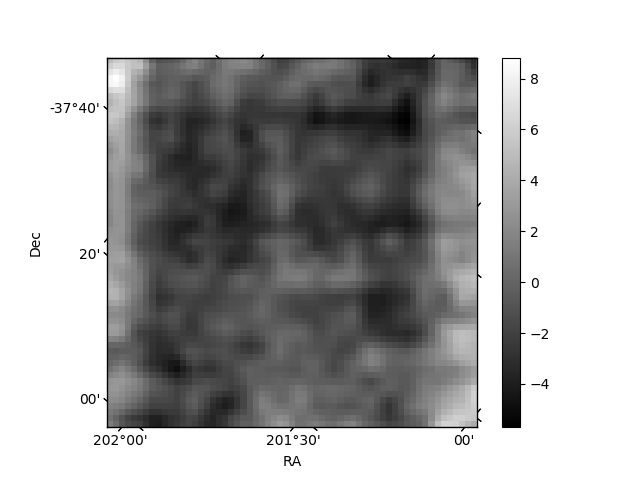
Histogram calculated using DETX and DETY for each event in the final _common_clean file
| Quadrant A | 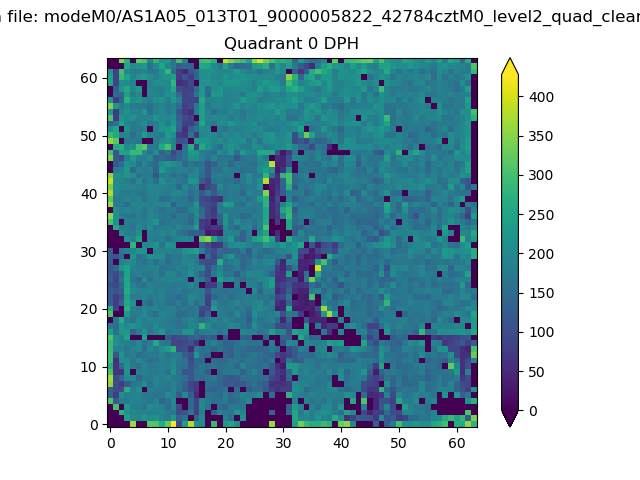 |
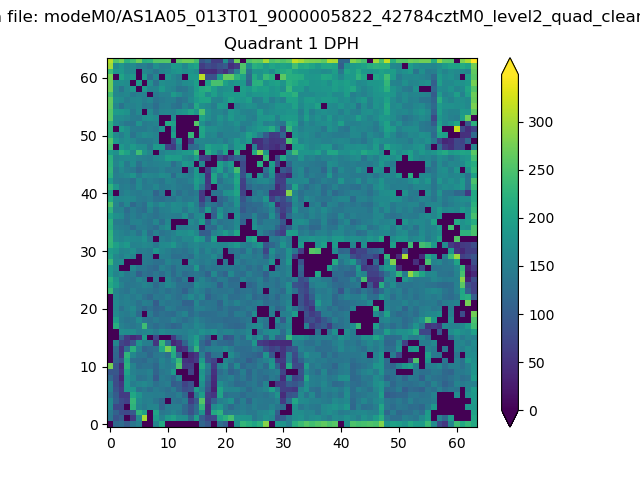 |
Quadrant B |
|---|---|---|---|
| Quadrant D | 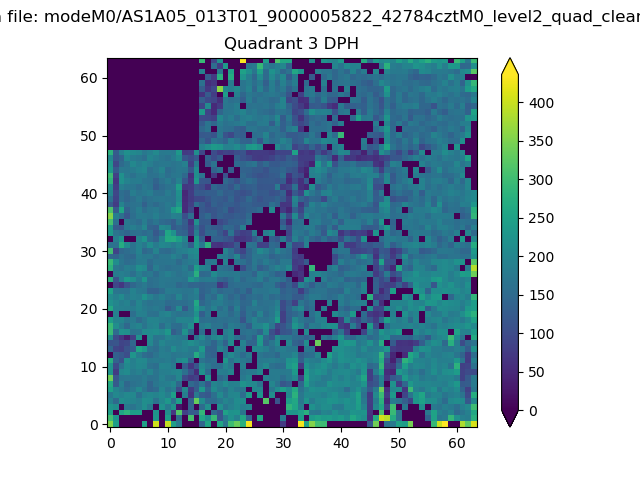 |
 |
Quadrant C |
| Plot type | Count rate plots | Images |
|---|---|---|
| Comparison with Poisson distribution Blue bars denote a histogram of data divided into 1 sec bins. Red curve is a Poisson curve with rate = median count rate of data. |
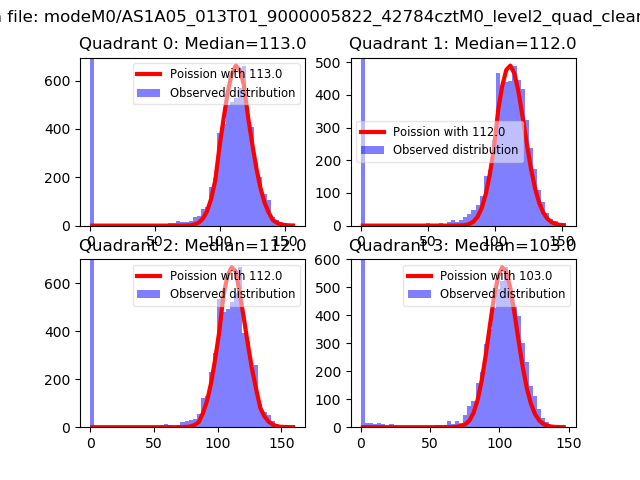 |
 |
| Quadrant-wise count rates Data is divided into 100 sec bins |
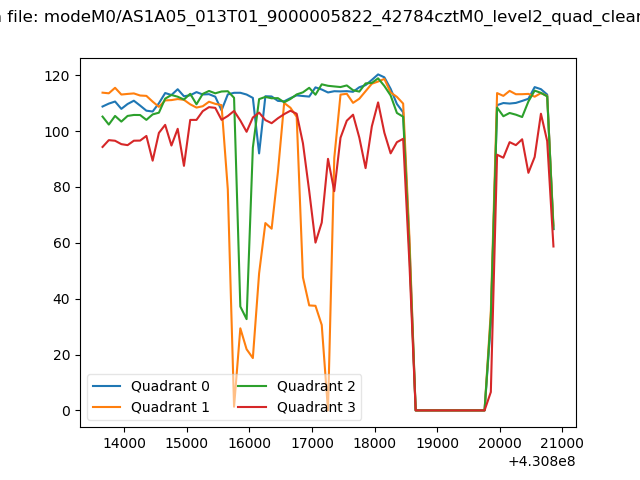 |
|
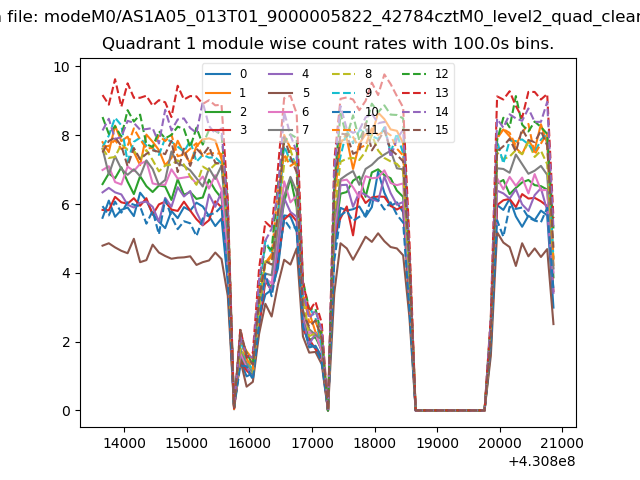
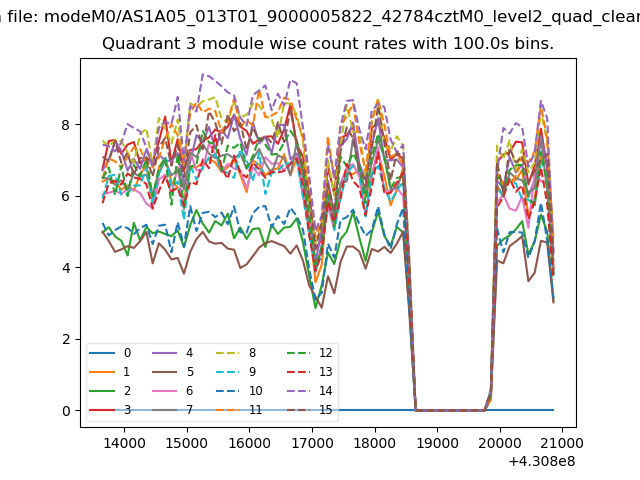
| Module-wise count rates for Quadrant A Data is divided into 100 sec bins |
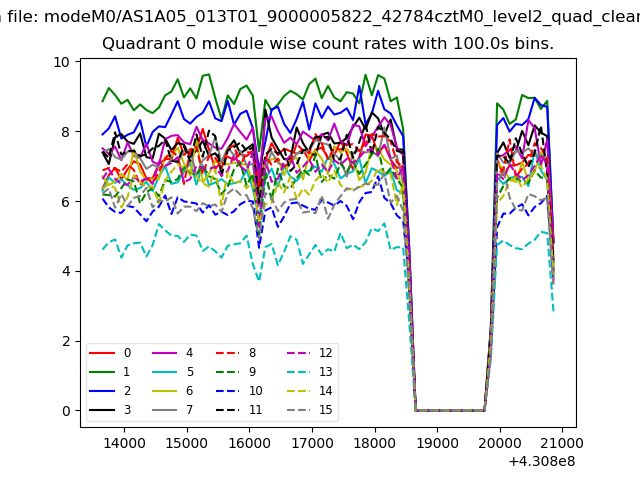 |
 |
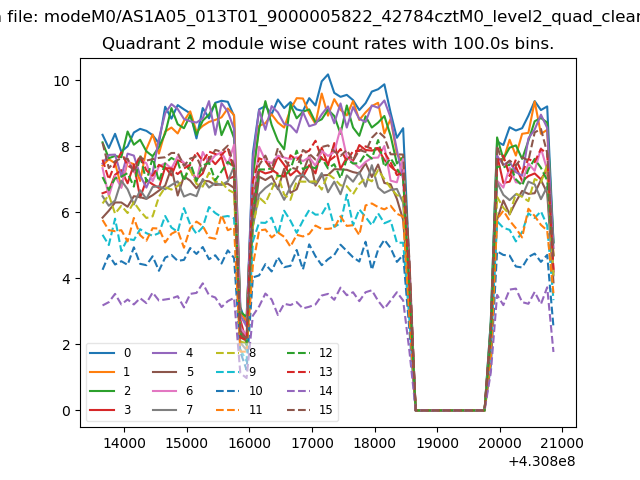
| Module-wise count rates for Quadrant B Data is divided into 100 sec bins |
 |
 |
| Module-wise count rates for Quadrant C Data is divided into 100 sec bins |
 |
 |
| Module-wise count rates for Quadrant D Data is divided into 100 sec bins |
 |
 |
| Parameter | Plot |
|---|---|
| CZT HV Monitor | 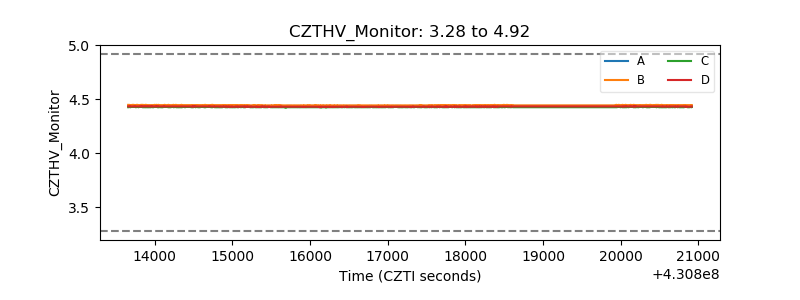 |
| D_VDD | 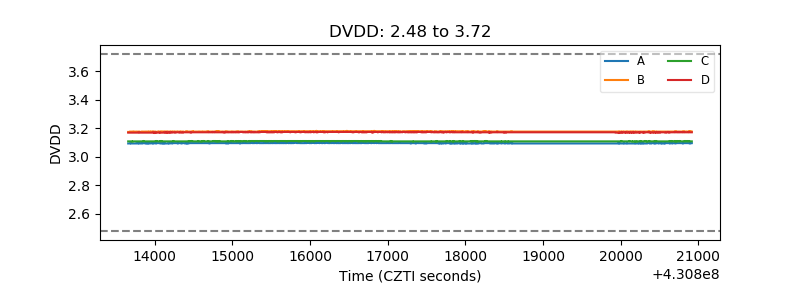 |
| Temperature 1 | 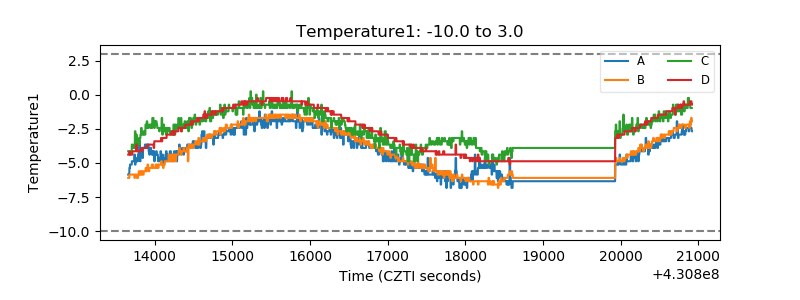 |
| Veto HV Monitor | 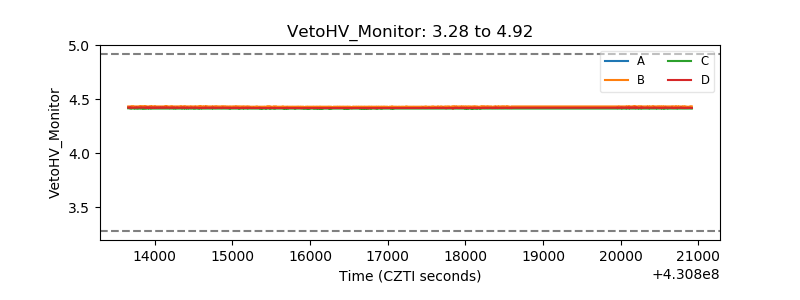 |
| Veto LLD | 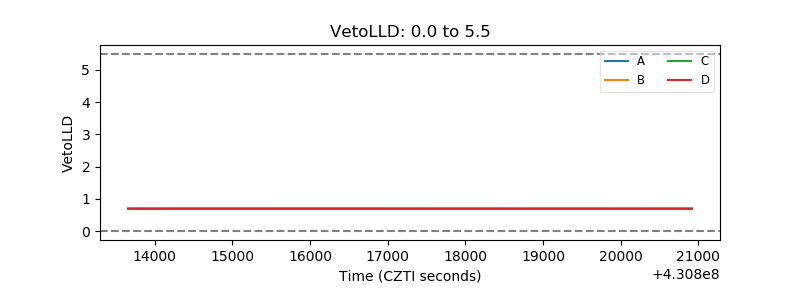 |
| Alpha Counter | 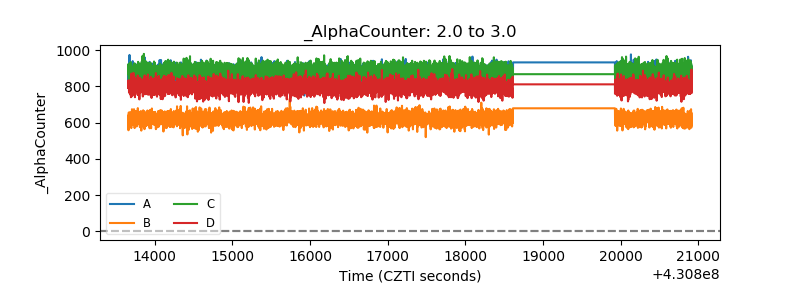 |
| _CPM_Rate | 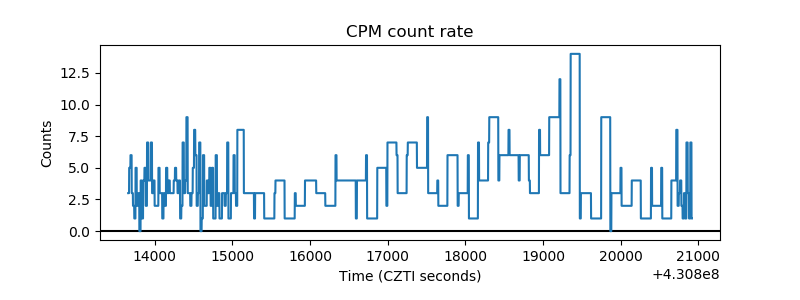 |
| CZT Counter | 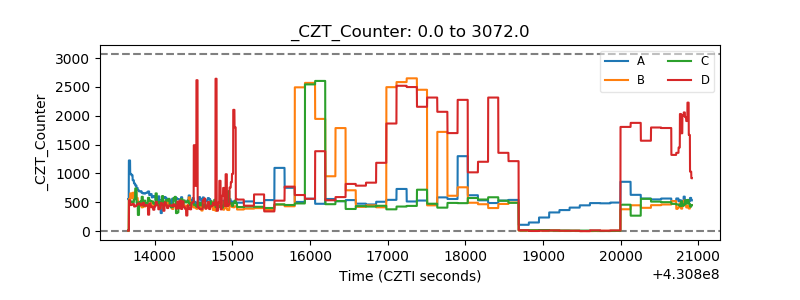 |
| +2.5 Volts monitor | 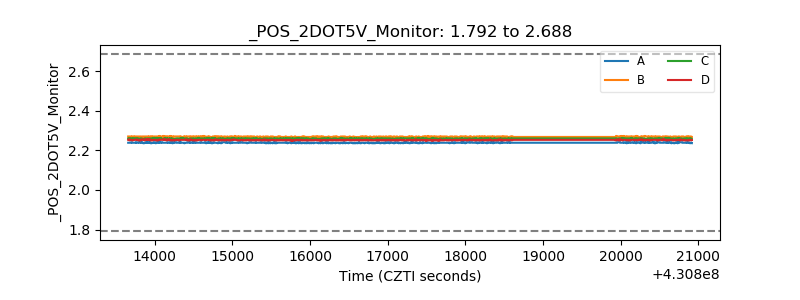 |
| +5 Volts monitor |  |
| _ROLL_ROT | 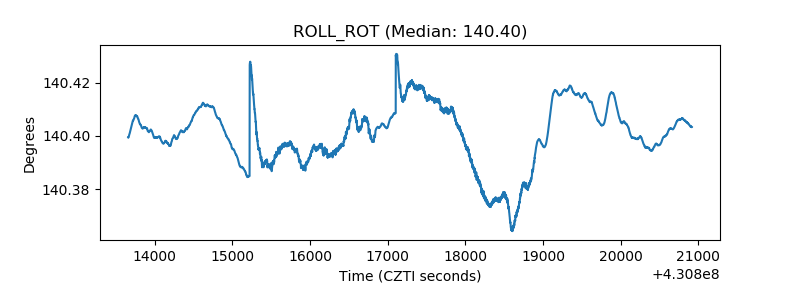 |
| _Roll_DEC | 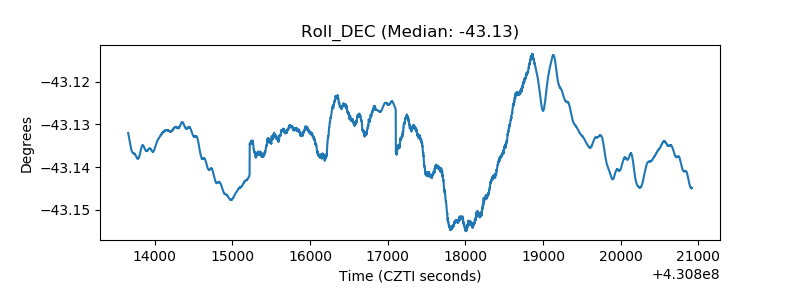 |
| _Roll_RA | 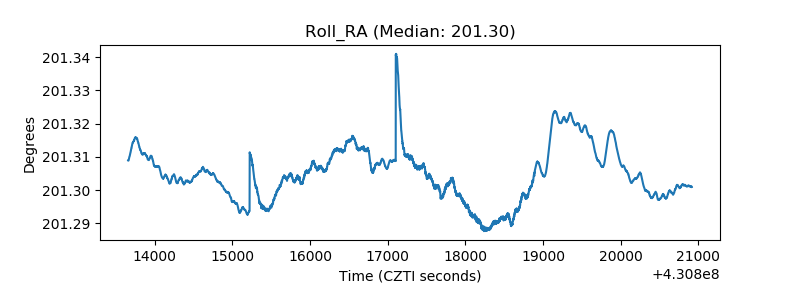 |
| Veto Counter | 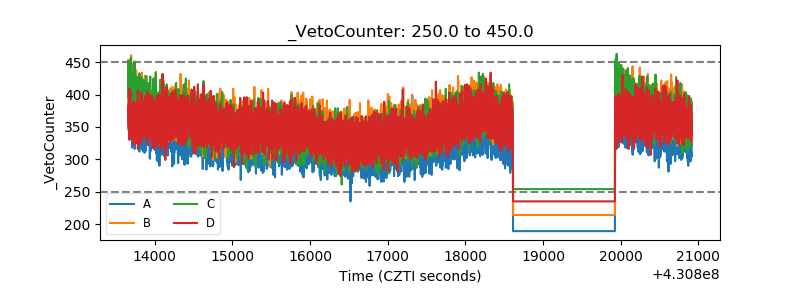 |