| Param | Original file | Final file |
|---|---|---|
| Filename | modeM0/AS1A05_013T01_9000005822_42788cztM0_level2.fits | modeM0/AS1A05_013T01_9000005822_42788cztM0_level2_quad_clean.evt |
| Size (bytes) | 345,591,360 | 89,925,120 |
| Size | 329.6 MB | 85.8 MB |
| Events in quadrant A | 2,921,323 | 607,447 |
| Events in quadrant B | 2,783,484 | 600,348 |
| Events in quadrant C | 2,511,282 | 599,085 |
| Events in quadrant D | 4,155,912 | 537,308 |
| Mode M0 | |||
|---|---|---|---|
| Quadrant | BADHDUFLAG | Total packets | Discarded packets |
| A | 0 | 11881 | 1 |
| B | 0 | 12053 | 1 |
| C | 0 | 10922 | 1 |
| D | 0 | 16082 | 1 |
| Mode M9 | |||
|---|---|---|---|
| Quadrant | BADHDUFLAG | Total packets | Discarded packets |
| A | 0 | 16 | 0 |
| B | 0 | 16 | 0 |
| C | 0 | 16 | 0 |
| D | 0 | 16 | 0 |
| Mode SS | |||
|---|---|---|---|
| Quadrant | BADHDUFLAG | Total packets | Discarded packets |
| A | 0 | 112 | 0 |
| B | 0 | 112 | 0 |
| C | 0 | 112 | 0 |
| D | 0 | 112 | 0 |
| Quadrant | Total seconds | Saturated seconds | Saturation percentage |
|---|---|---|---|
| A | 5401 | 10 | 0.185151% |
| B | 5402 | 43 | 0.796001% |
| C | 5402 | 2 | 0.037023% |
| D | 5402 | 274 | 5.072195% |
Noise dominated data is calculated using 1-second bins in cleaned event files. If a bin has >2000 counts, and if more than 50% of those come from <1% of pixels, then it is considered to be noise-dominated and hence unusable.
| Quadrant | # 1 sec bins | Bins with >0 counts | Bins with >2000 counts | High rate bins dominated by noise | Noise dominated (total time) | Noise dominated (detector-on time) | Marked lightcurve |
|---|---|---|---|---|---|---|---|
| A | 7045 | 5402 | 3 | 3 | 0.04% | 0.06% | 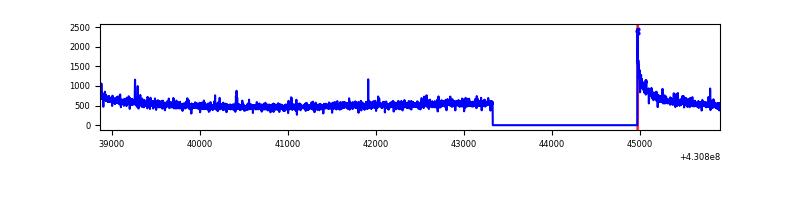 |
| B | 7046 | 5403 | 24 | 24 | 0.34% | 0.44% | 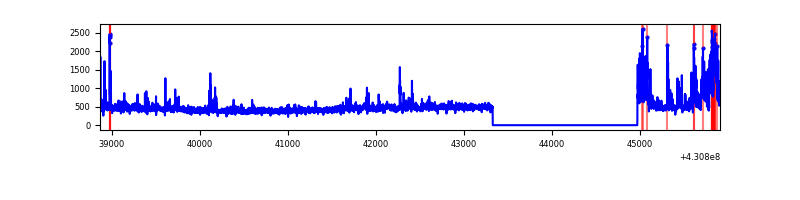 |
| C | 7046 | 5403 | 0 | 0 | 0.00% | 0.00% | 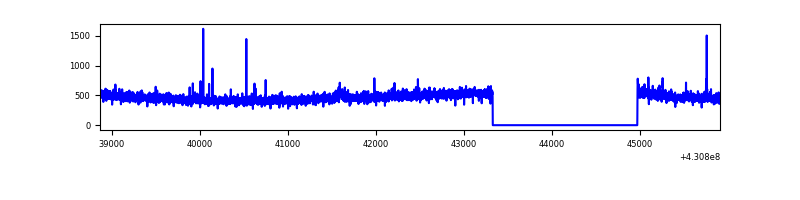 |
| D | 7046 | 5403 | 324 | 324 | 4.60% | 6.00% | 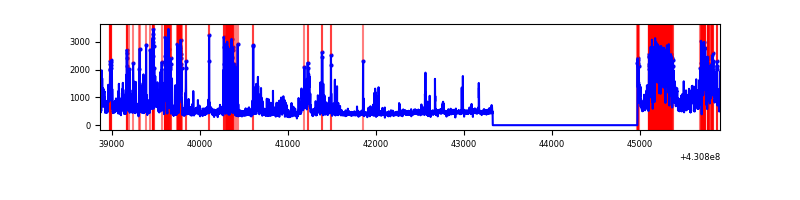 |
Top three noisy pixels from each quadrant. If the there are fewer than three noisy pixels in the level2.evt file, extra rows are filled as -1
| Pixel properties | Quadrant properties | ||||||
|---|---|---|---|---|---|---|---|
| Quadrant | DetID | PixID | Counts | Sigma | Mean | Median | Sigma |
| A | 10 | 83 | 558651 | 4527.11 | 594 | 583 | 123.3 |
| A | 2 | 79 | 21784 | 171.99 | 594 | 583 | 123.3 |
| A | 12 | 189 | 13794 | 107.17 | 594 | 583 | 123.3 |
| B | 10 | 247 | 214666 | 1859.43 | 585 | 569 | 115.1 |
| B | 0 | 229 | 197659 | 1711.72 | 585 | 569 | 115.1 |
| B | 0 | 245 | 34444 | 294.2 | 585 | 569 | 115.1 |
| C | 15 | 214 | 229102 | 1686.94 | 577 | 582 | 135.5 |
| C | 14 | 254 | 16362 | 116.49 | 577 | 582 | 135.5 |
| C | 5 | 250 | 6870 | 46.42 | 577 | 582 | 135.5 |
| D | 1 | 52 | 1663928 | 11683.72 | 571 | 554 | 142.4 |
| D | 5 | 171 | 63230 | 440.24 | 571 | 554 | 142.4 |
| D | 7 | 96 | 61178 | 425.83 | 571 | 554 | 142.4 |
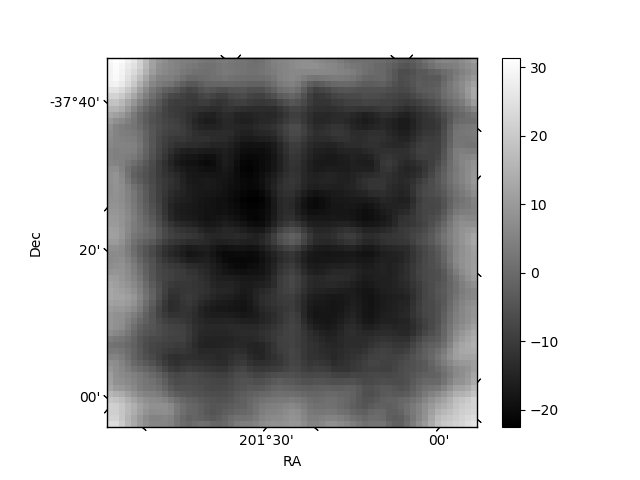
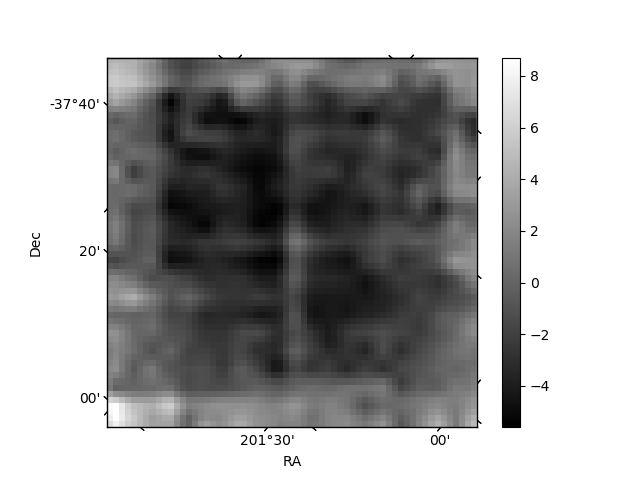
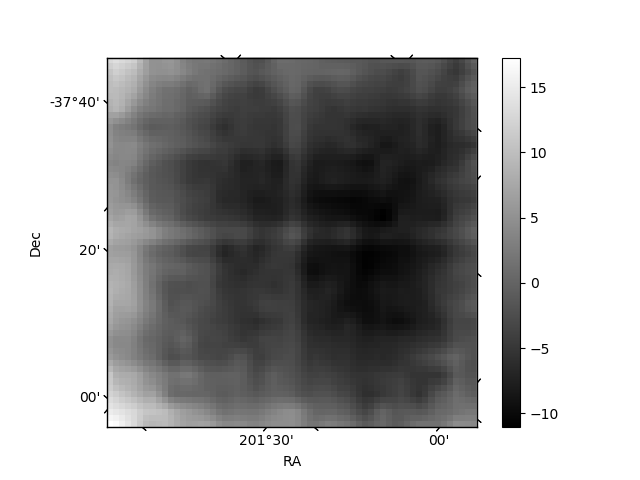
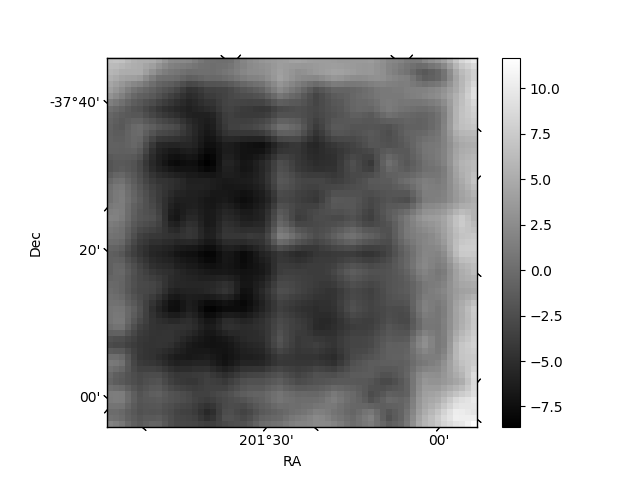
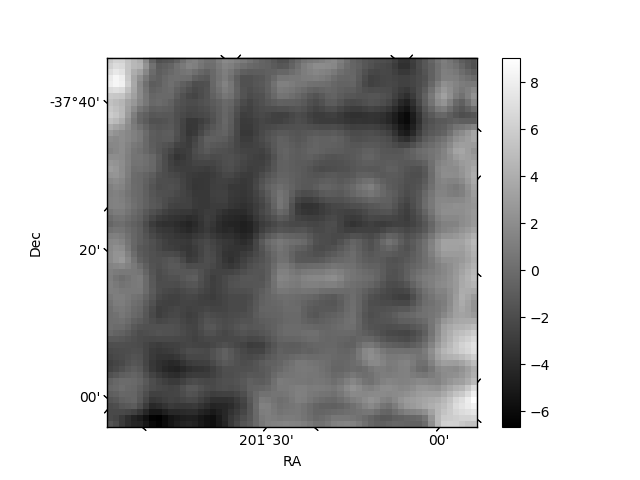
Histogram calculated using DETX and DETY for each event in the final _common_clean file
| Quadrant A | 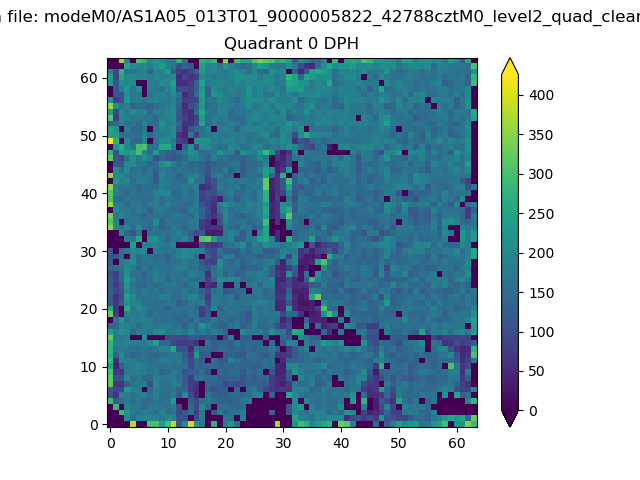 |
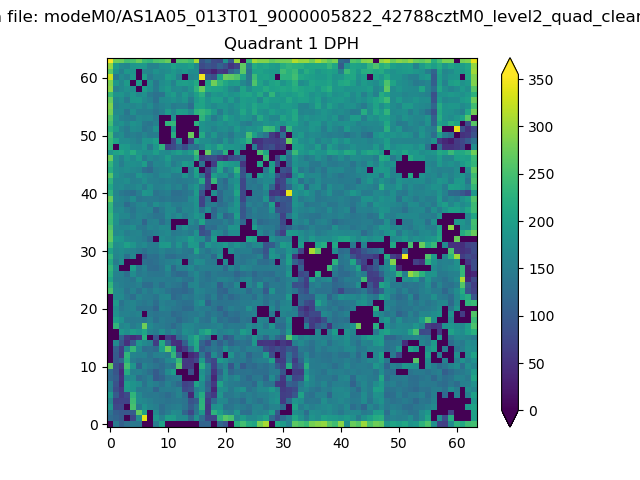 |
Quadrant B |
|---|---|---|---|
| Quadrant D | 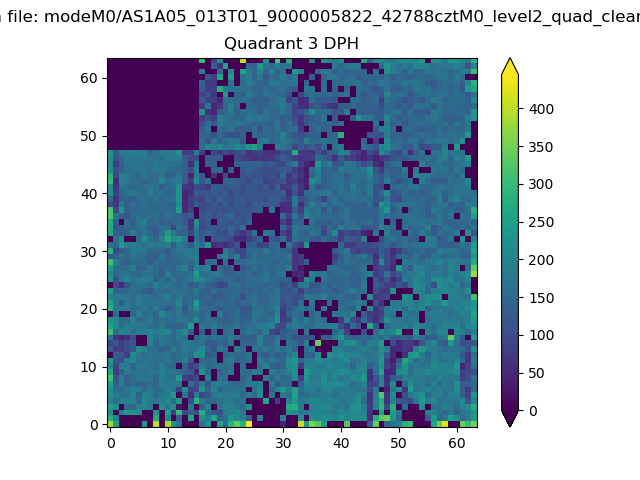 |
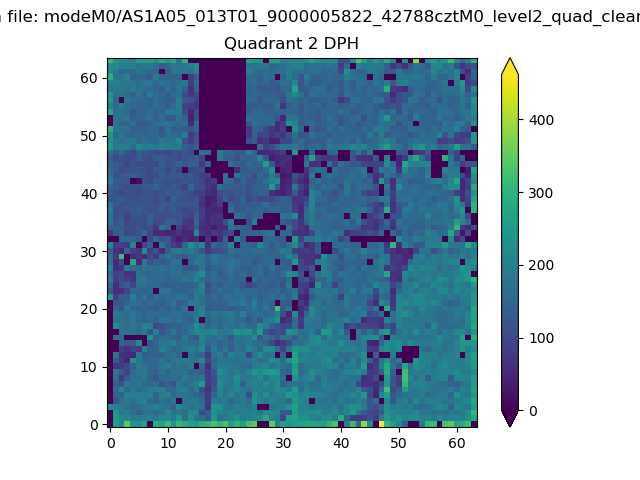 |
Quadrant C |
| Plot type | Count rate plots | Images |
|---|---|---|
| Comparison with Poisson distribution Blue bars denote a histogram of data divided into 1 sec bins. Red curve is a Poisson curve with rate = median count rate of data. |
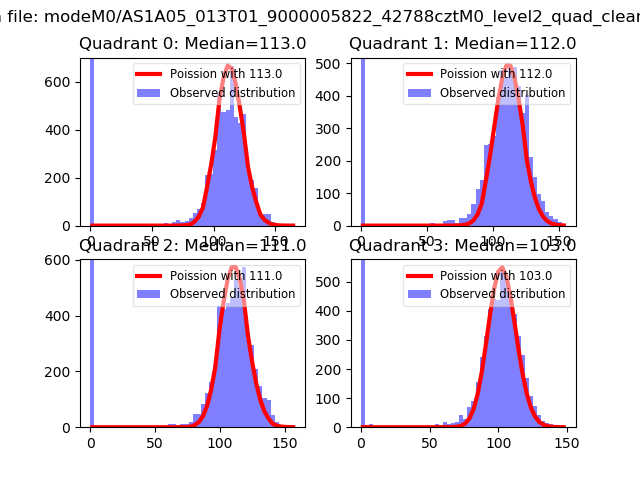 |
 |
| Quadrant-wise count rates Data is divided into 100 sec bins |
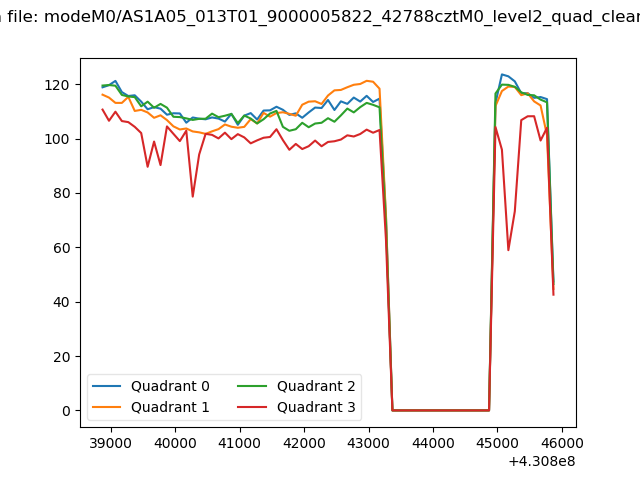 |
|
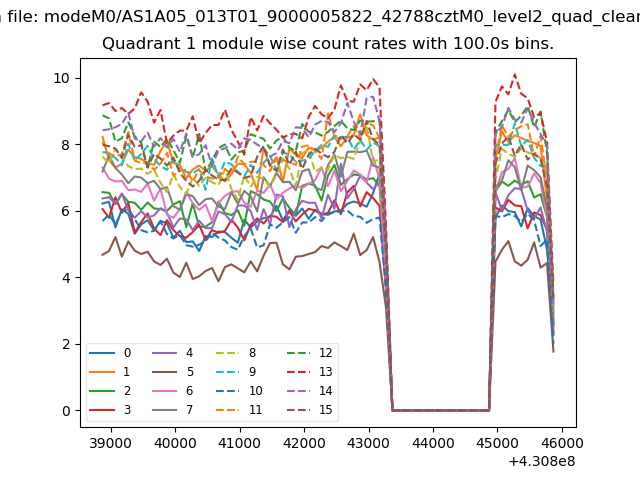
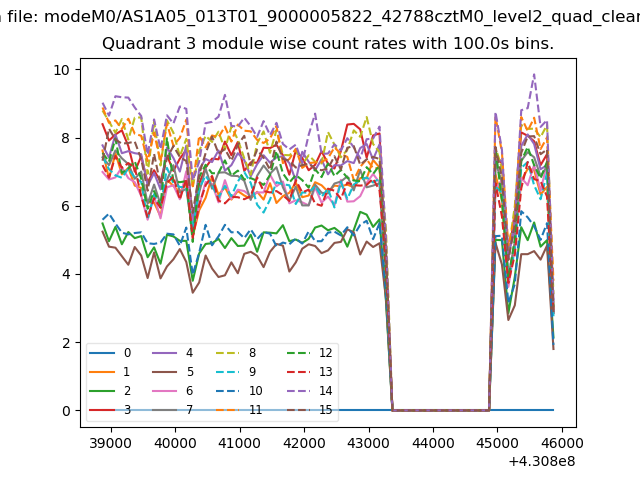
| Module-wise count rates for Quadrant A Data is divided into 100 sec bins |
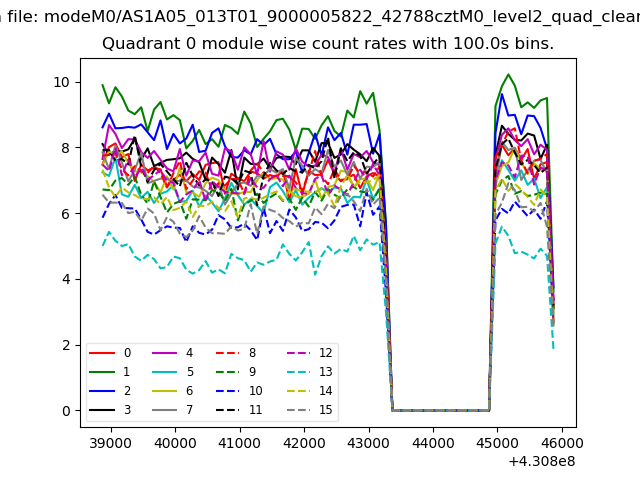 |
 |
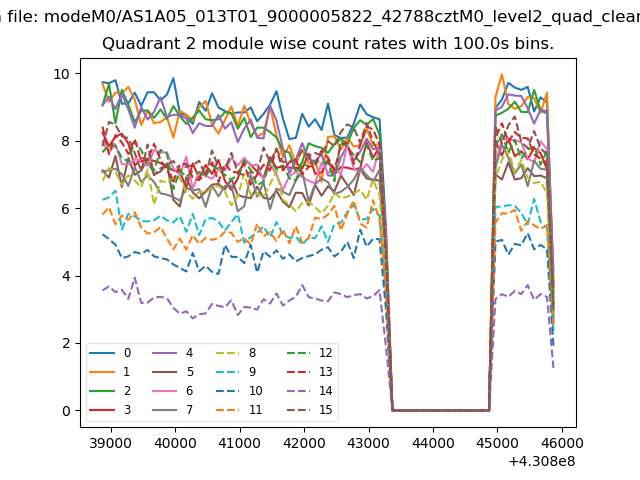
| Module-wise count rates for Quadrant B Data is divided into 100 sec bins |
 |
 |
| Module-wise count rates for Quadrant C Data is divided into 100 sec bins |
 |
 |
| Module-wise count rates for Quadrant D Data is divided into 100 sec bins |
 |
 |
| Parameter | Plot |
|---|---|
| CZT HV Monitor | 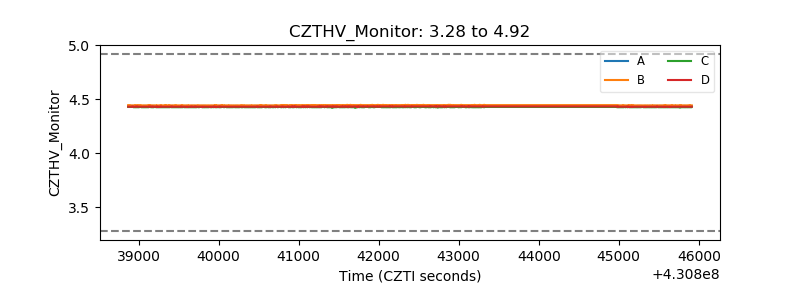 |
| D_VDD | 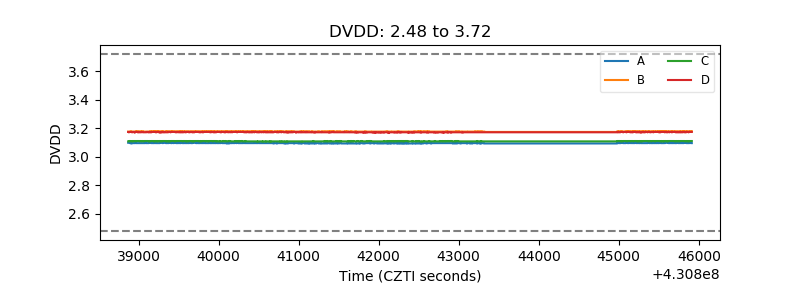 |
| Temperature 1 | 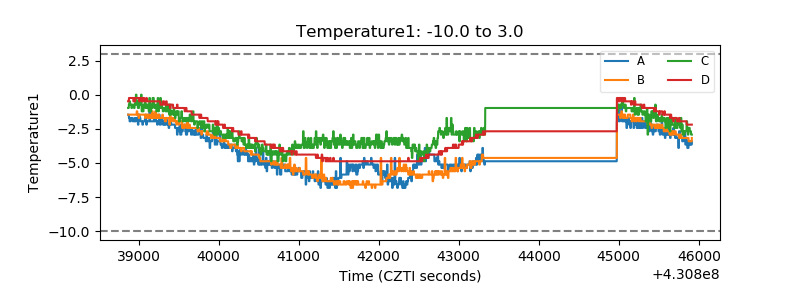 |
| Veto HV Monitor | 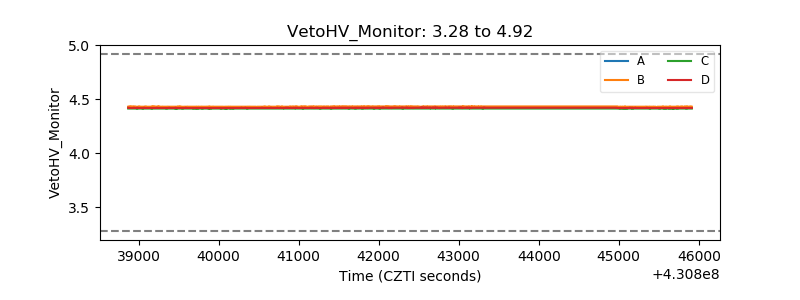 |
| Veto LLD | 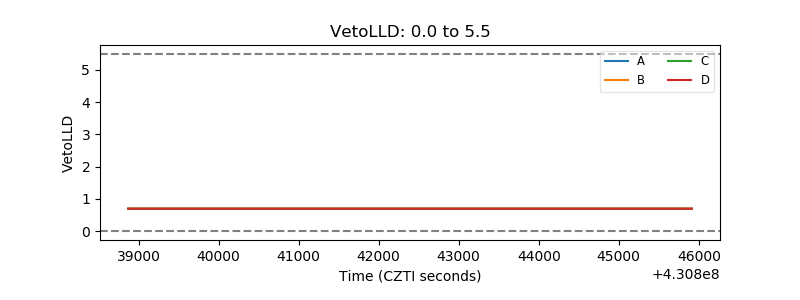 |
| Alpha Counter | 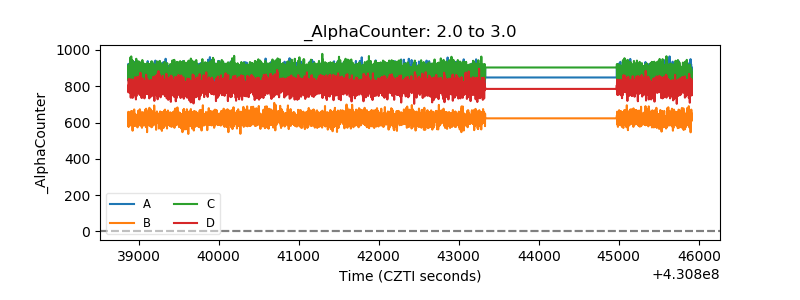 |
| _CPM_Rate | 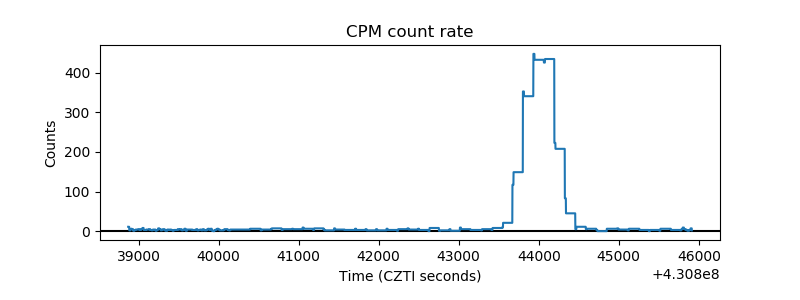 |
| CZT Counter | 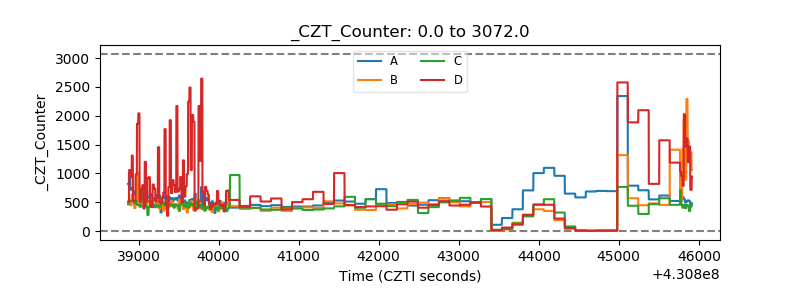 |
| +2.5 Volts monitor | 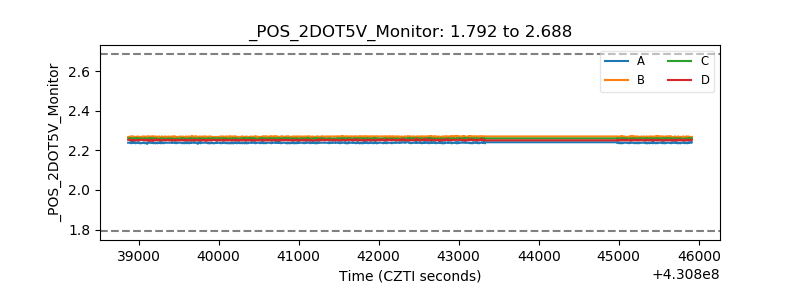 |
| +5 Volts monitor | 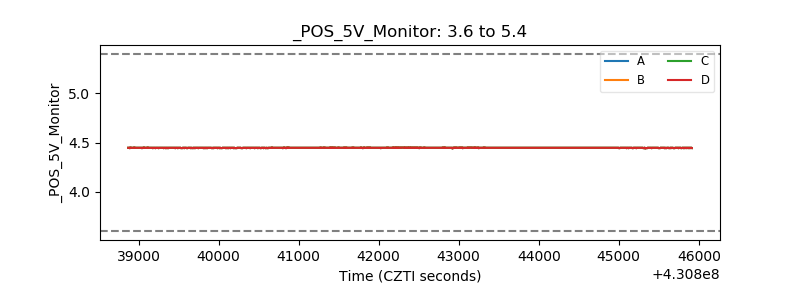 |
| _ROLL_ROT | 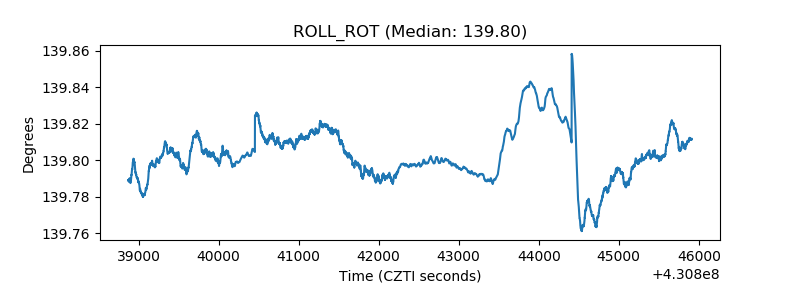 |
| _Roll_DEC | 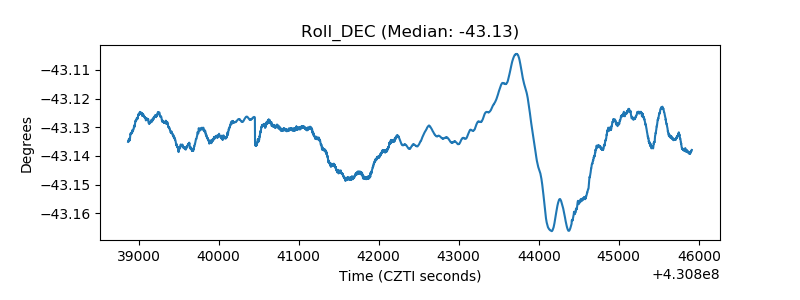 |
| _Roll_RA | 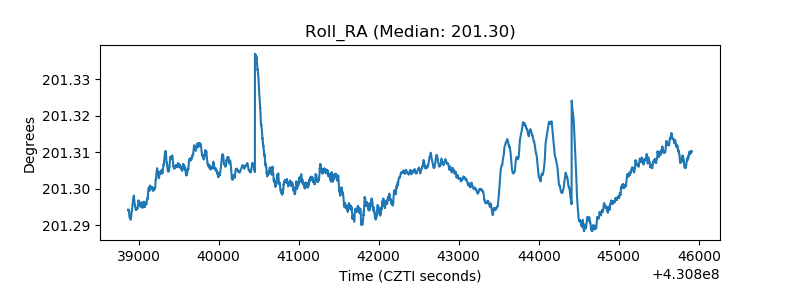 |
| Veto Counter | 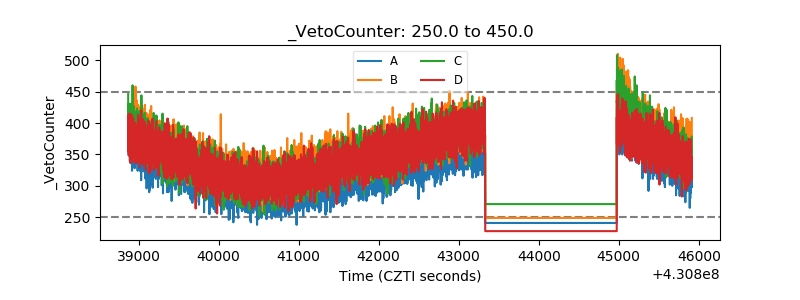 |