| Param | Original file | Final file |
|---|---|---|
| Filename | modeM0/AS1A05_013T01_9000005822_42790cztM0_level2.fits | modeM0/AS1A05_013T01_9000005822_42790cztM0_level2_quad_clean.evt |
| Size (bytes) | 396,000,000 | 88,597,440 |
| Size | 377.7 MB | 84.5 MB |
| Events in quadrant A | 3,259,060 | 606,788 |
| Events in quadrant B | 2,896,909 | 607,028 |
| Events in quadrant C | 2,488,726 | 598,317 |
| Events in quadrant D | 5,598,181 | 496,271 |
| Mode M0 | |||
|---|---|---|---|
| Quadrant | BADHDUFLAG | Total packets | Discarded packets |
| A | 0 | 12978 | 2 |
| B | 0 | 12287 | 2 |
| C | 0 | 10808 | 2 |
| D | 0 | 20352 | 2 |
| Mode M9 | |||
|---|---|---|---|
| Quadrant | BADHDUFLAG | Total packets | Discarded packets |
| A | 0 | 18 | 0 |
| B | 0 | 19 | 0 |
| C | 0 | 19 | 0 |
| D | 0 | 19 | 0 |
| Mode SS | |||
|---|---|---|---|
| Quadrant | BADHDUFLAG | Total packets | Discarded packets |
| A | 0 | 108 | 0 |
| B | 0 | 108 | 0 |
| C | 0 | 108 | 0 |
| D | 0 | 108 | 0 |
| Quadrant | Total seconds | Saturated seconds | Saturation percentage |
|---|---|---|---|
| A | 5348 | 42 | 0.785340% |
| B | 5347 | 46 | 0.860295% |
| C | 5347 | 4 | 0.074808% |
| D | 5347 | 734 | 13.727324% |
Noise dominated data is calculated using 1-second bins in cleaned event files. If a bin has >2000 counts, and if more than 50% of those come from <1% of pixels, then it is considered to be noise-dominated and hence unusable.
| Quadrant | # 1 sec bins | Bins with >0 counts | Bins with >2000 counts | High rate bins dominated by noise | Noise dominated (total time) | Noise dominated (detector-on time) | Marked lightcurve |
|---|---|---|---|---|---|---|---|
| A | 7110 | 5349 | 34 | 34 | 0.48% | 0.64% | 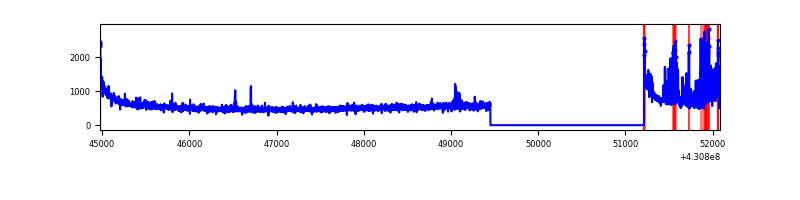 |
| B | 7109 | 5348 | 26 | 26 | 0.37% | 0.49% | 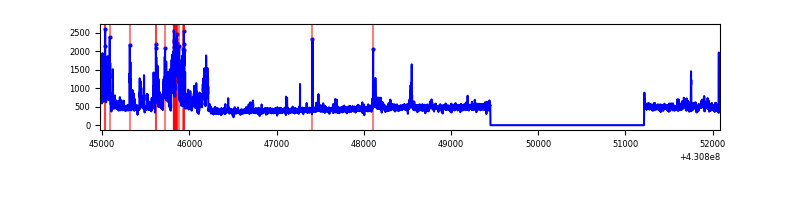 |
| C | 7109 | 5348 | 0 | 0 | 0.00% | 0.00% | 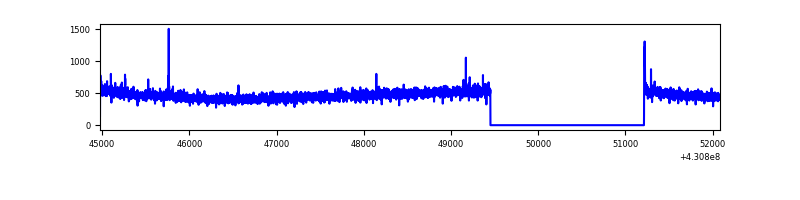 |
| D | 7108 | 5347 | 747 | 747 | 10.51% | 13.97% | 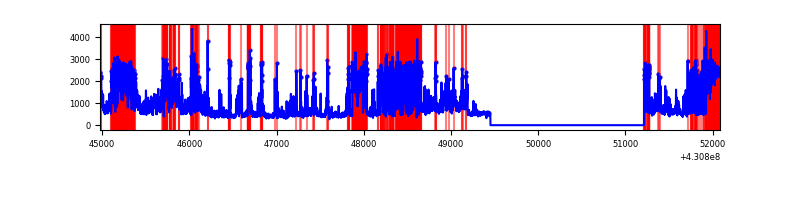 |
Top three noisy pixels from each quadrant. If the there are fewer than three noisy pixels in the level2.evt file, extra rows are filled as -1
| Pixel properties | Quadrant properties | ||||||
|---|---|---|---|---|---|---|---|
| Quadrant | DetID | PixID | Counts | Sigma | Mean | Median | Sigma |
| A | 10 | 83 | 611225 | 5053.32 | 592 | 581 | 120.8 |
| A | 10 | 255 | 284458 | 2349.19 | 592 | 581 | 120.8 |
| A | 2 | 79 | 34875 | 283.8 | 592 | 581 | 120.8 |
| B | 0 | 229 | 326245 | 2852.54 | 585 | 570 | 114.2 |
| B | 10 | 247 | 233742 | 2042.32 | 585 | 570 | 114.2 |
| B | 0 | 245 | 19569 | 166.41 | 585 | 570 | 114.2 |
| C | 15 | 214 | 231100 | 1710.79 | 573 | 576 | 134.7 |
| C | 3 | 233 | 13815 | 98.25 | 573 | 576 | 134.7 |
| C | 14 | 254 | 7163 | 48.88 | 573 | 576 | 134.7 |
| D | 2 | 249 | 1791710 | 13182.83 | 548 | 532 | 135.9 |
| D | 1 | 52 | 1279777 | 9415.07 | 548 | 532 | 135.9 |
| D | 12 | 233 | 93399 | 683.49 | 548 | 532 | 135.9 |
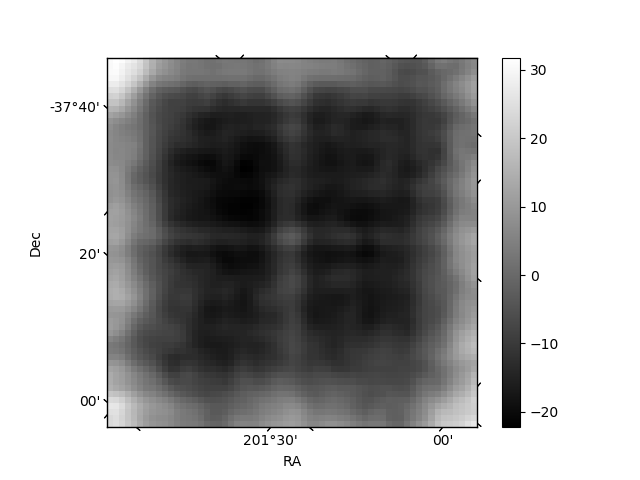
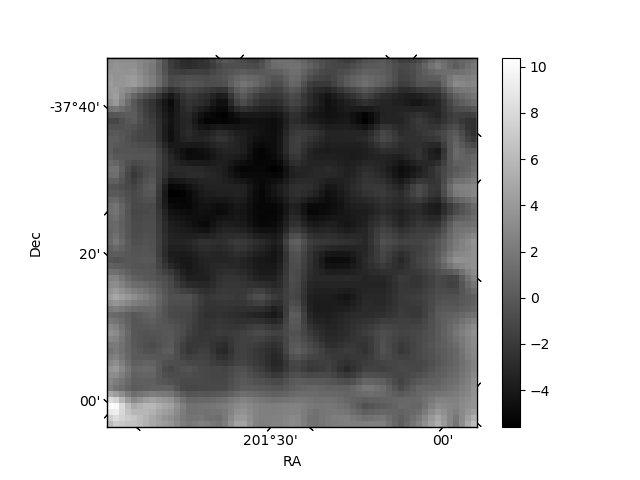
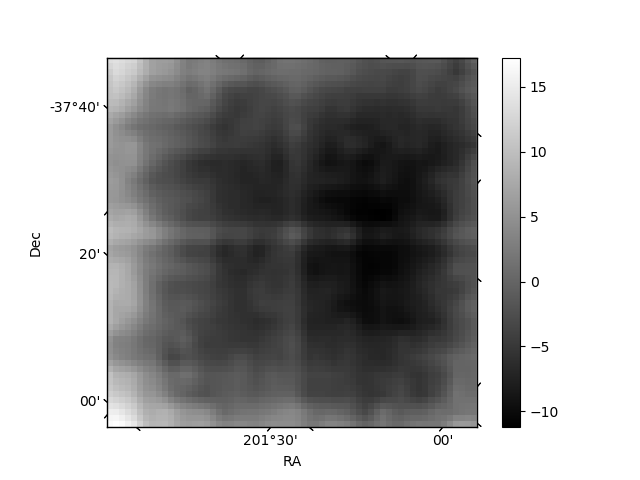
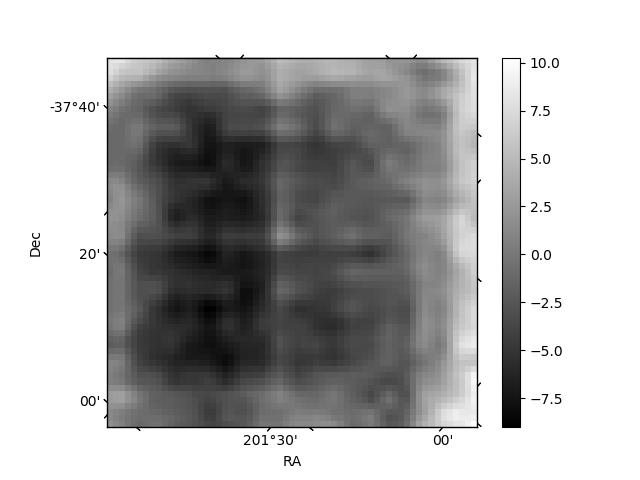
Histogram calculated using DETX and DETY for each event in the final _common_clean file
| Quadrant A | 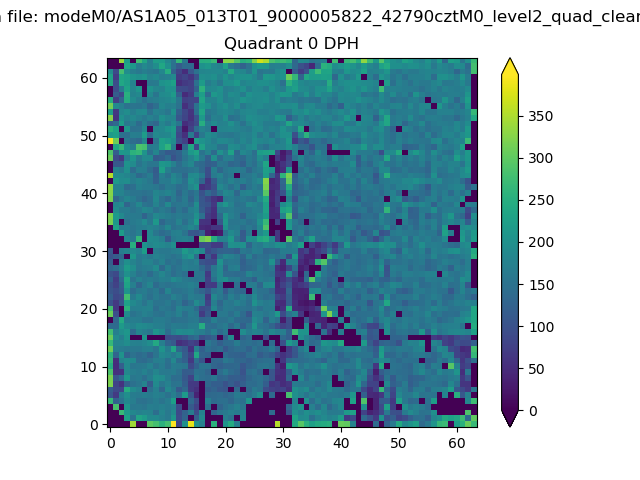 |
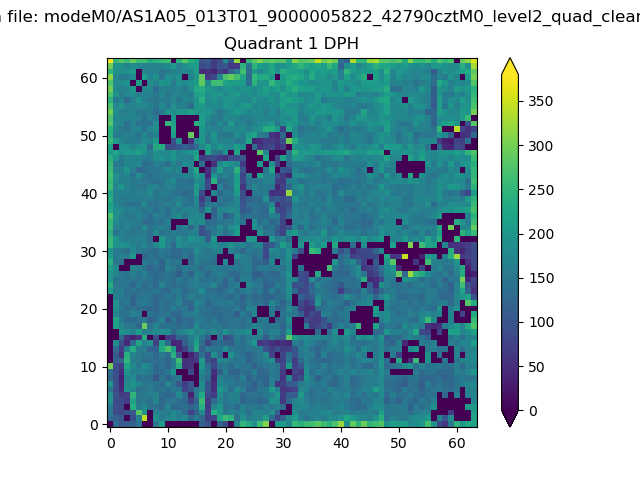 |
Quadrant B |
|---|---|---|---|
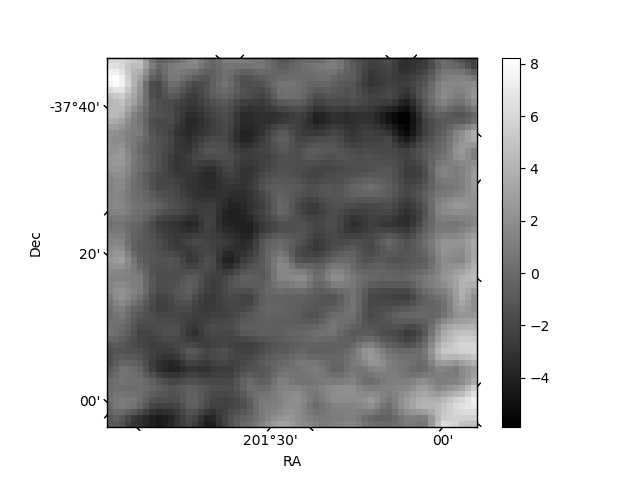
| Quadrant D | 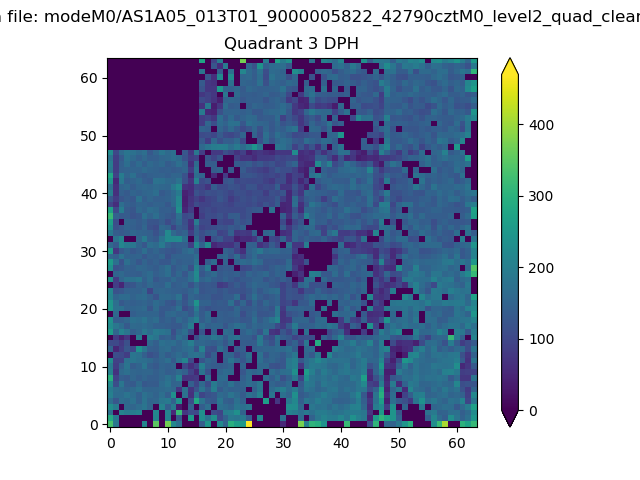 |
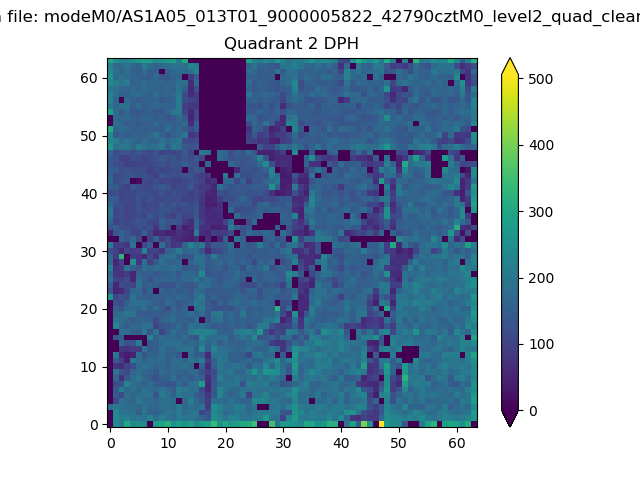 |
Quadrant C |
| Plot type | Count rate plots | Images |
|---|---|---|
| Comparison with Poisson distribution Blue bars denote a histogram of data divided into 1 sec bins. Red curve is a Poisson curve with rate = median count rate of data. |
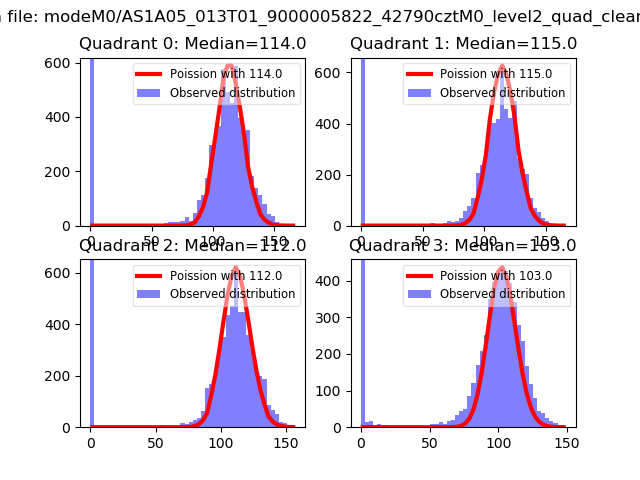 |
 |
| Quadrant-wise count rates Data is divided into 100 sec bins |
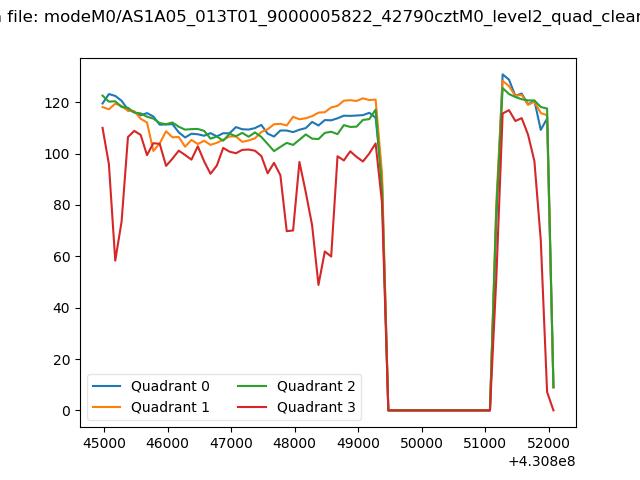 |
|
| Module-wise count rates for Quadrant A Data is divided into 100 sec bins |
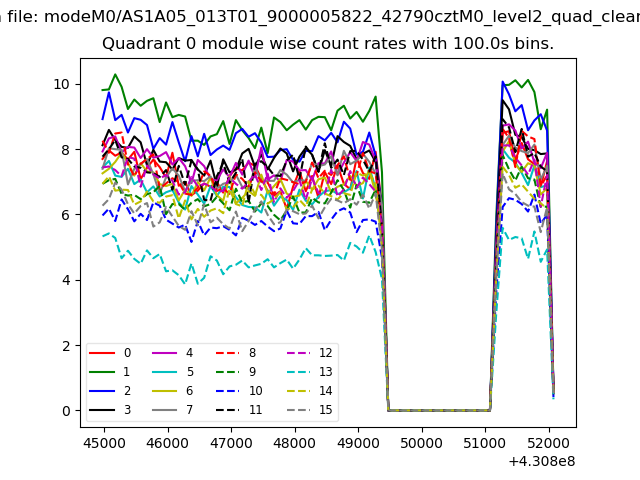 |
 |
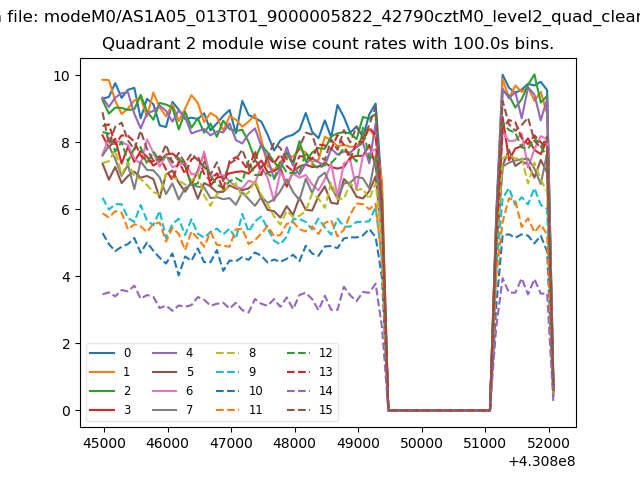
| Module-wise count rates for Quadrant B Data is divided into 100 sec bins |
 |
 |
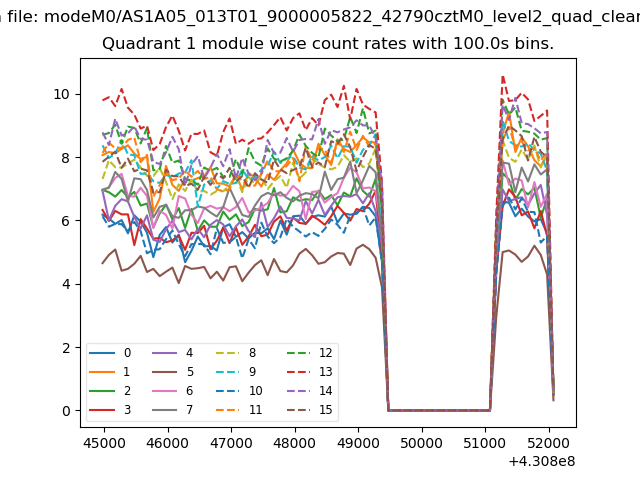
| Module-wise count rates for Quadrant C Data is divided into 100 sec bins |
 |
 |
| Module-wise count rates for Quadrant D Data is divided into 100 sec bins |
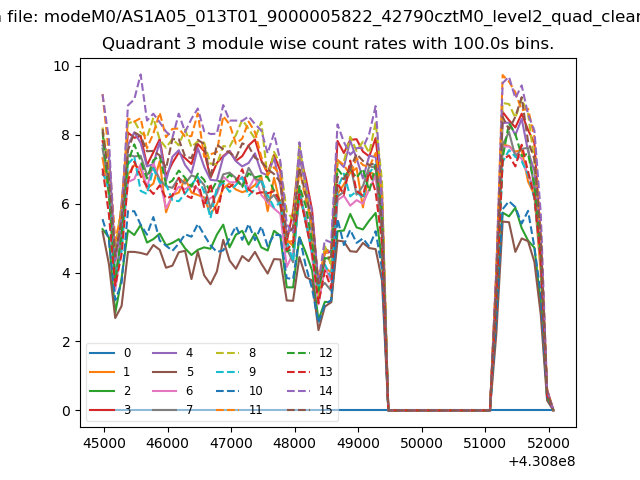 |
 |
| Parameter | Plot |
|---|---|
| CZT HV Monitor | 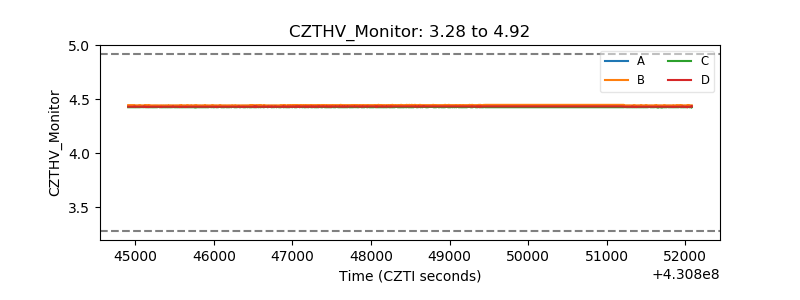 |
| D_VDD | 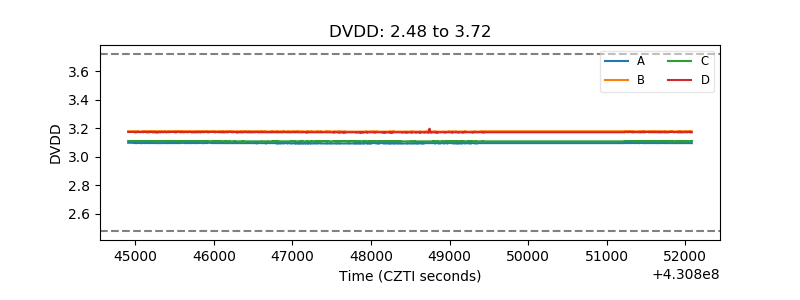 |
| Temperature 1 | 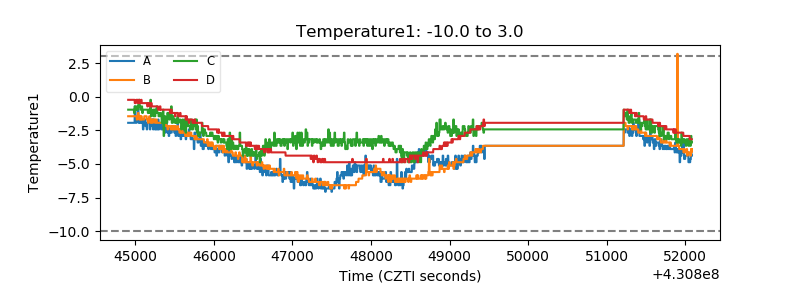 |
| Veto HV Monitor | 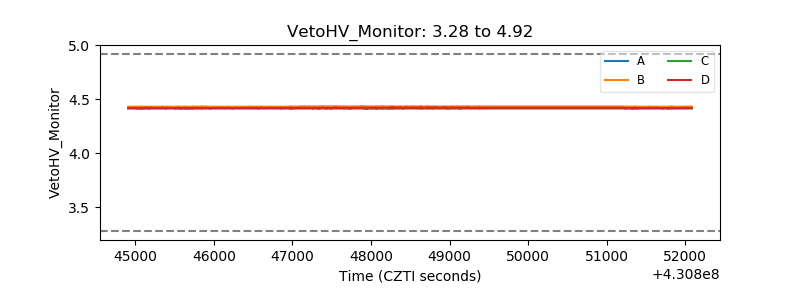 |
| Veto LLD | 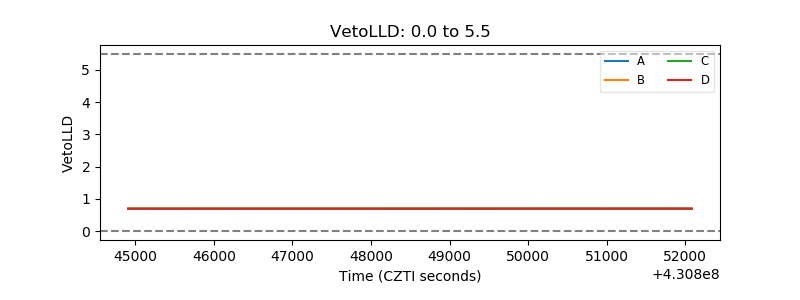 |
| Alpha Counter | 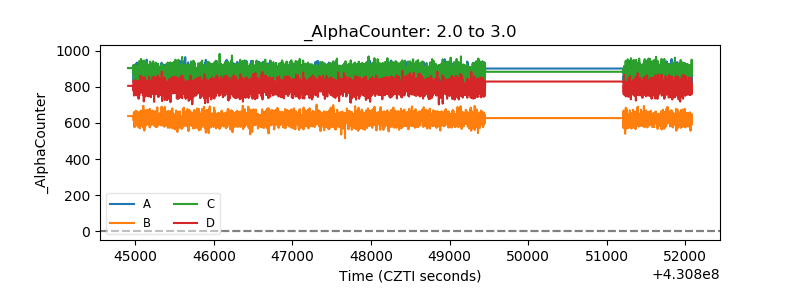 |
| _CPM_Rate | 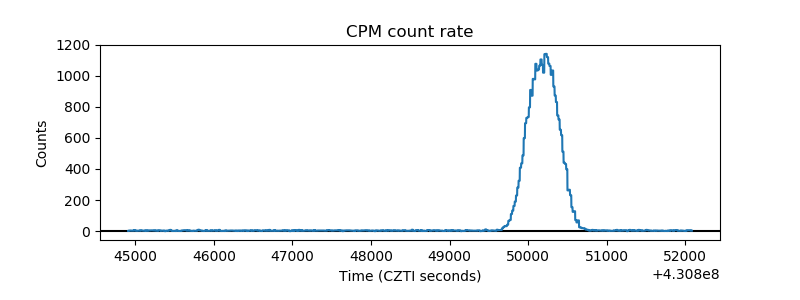 |
| CZT Counter | 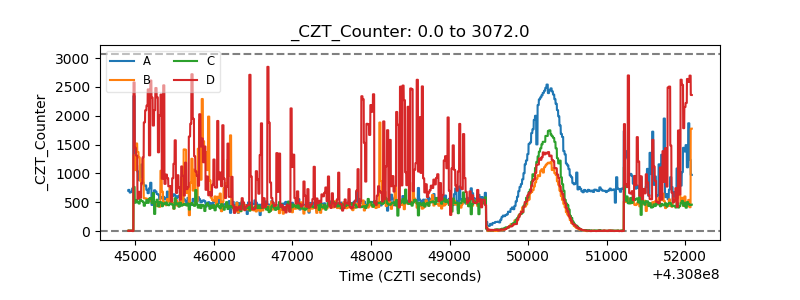 |
| +2.5 Volts monitor |  |
| +5 Volts monitor | 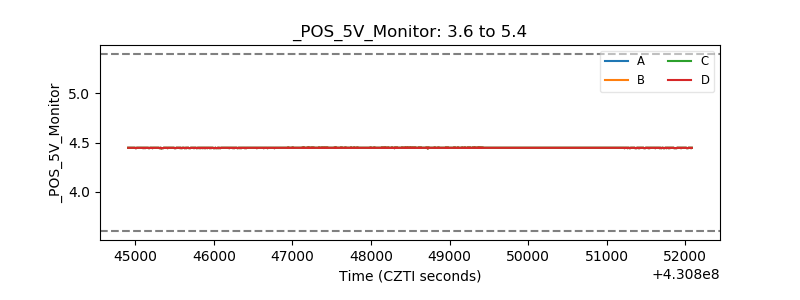 |
| _ROLL_ROT | 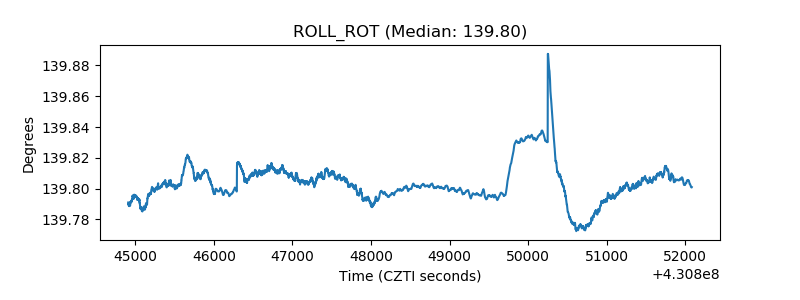 |
| _Roll_DEC | 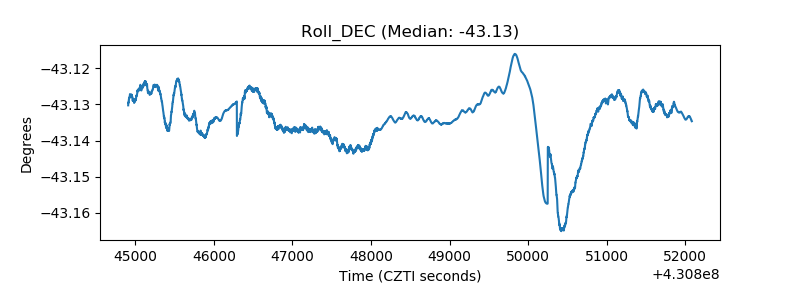 |
| _Roll_RA | 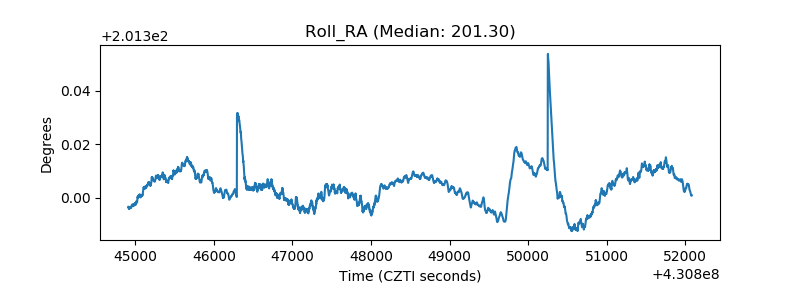 |
| Veto Counter | 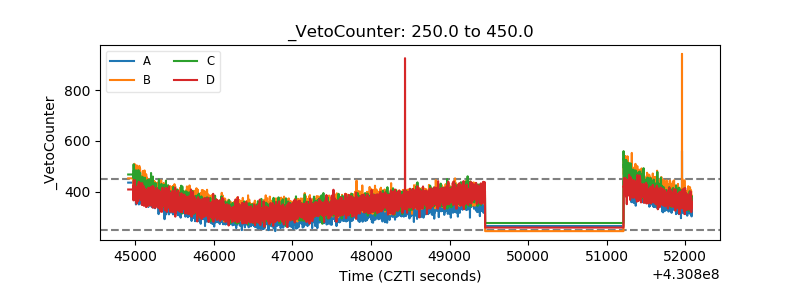 |