| Param | Original file | Final file |
|---|---|---|
| Filename | modeM0/AS1A05_013T01_9000005822_42791cztM0_level2.fits | modeM0/AS1A05_013T01_9000005822_42791cztM0_level2_quad_clean.evt |
| Size (bytes) | 368,233,920 | 87,736,320 |
| Size | 351.2 MB | 83.7 MB |
| Events in quadrant A | 3,417,126 | 606,897 |
| Events in quadrant B | 2,459,440 | 613,372 |
| Events in quadrant C | 2,492,880 | 592,151 |
| Events in quadrant D | 4,857,445 | 480,992 |
| Mode M0 | |||
|---|---|---|---|
| Quadrant | BADHDUFLAG | Total packets | Discarded packets |
| A | 0 | 13306 | 2 |
| B | 0 | 10843 | 2 |
| C | 0 | 10593 | 2 |
| D | 0 | 18031 | 5 |
| Mode M9 | |||
|---|---|---|---|
| Quadrant | BADHDUFLAG | Total packets | Discarded packets |
| A | 0 | 24 | 0 |
| B | 0 | 25 | 0 |
| C | 0 | 25 | 0 |
| D | 0 | 25 | 0 |
| Mode SS | |||
|---|---|---|---|
| Quadrant | BADHDUFLAG | Total packets | Discarded packets |
| A | 0 | 104 | 0 |
| B | 0 | 104 | 0 |
| C | 0 | 104 | 0 |
| D | 0 | 104 | 0 |
| Quadrant | Total seconds | Saturated seconds | Saturation percentage |
|---|---|---|---|
| A | 5188 | 52 | 1.002313% |
| B | 5188 | 13 | 0.250578% |
| C | 5188 | 10 | 0.192753% |
| D | 5187 | 722 | 13.919414% |
Noise dominated data is calculated using 1-second bins in cleaned event files. If a bin has >2000 counts, and if more than 50% of those come from <1% of pixels, then it is considered to be noise-dominated and hence unusable.
| Quadrant | # 1 sec bins | Bins with >0 counts | Bins with >2000 counts | High rate bins dominated by noise | Noise dominated (total time) | Noise dominated (detector-on time) | Marked lightcurve |
|---|---|---|---|---|---|---|---|
| A | 7071 | 5189 | 59 | 59 | 0.83% | 1.14% | 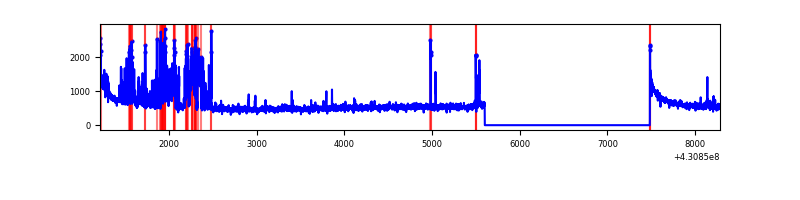 |
| B | 7071 | 5189 | 4 | 4 | 0.06% | 0.08% | 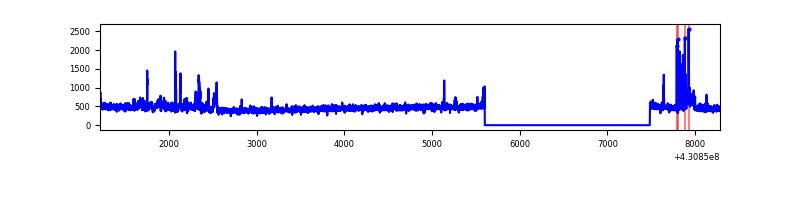 |
| C | 7071 | 5189 | 5 | 5 | 0.07% | 0.10% | 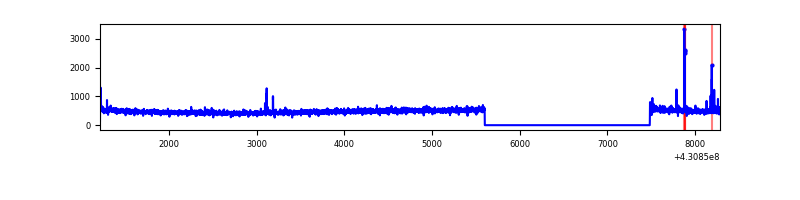 |
| D | 7069 | 5187 | 716 | 716 | 10.13% | 13.80% | 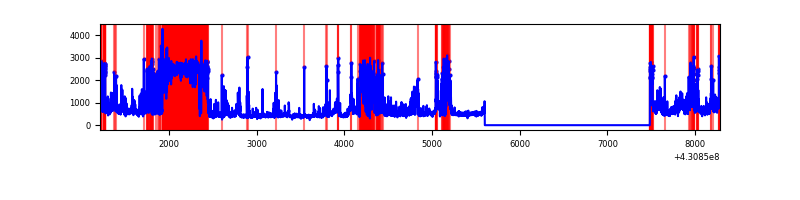 |
Top three noisy pixels from each quadrant. If the there are fewer than three noisy pixels in the level2.evt file, extra rows are filled as -1
| Pixel properties | Quadrant properties | ||||||
|---|---|---|---|---|---|---|---|
| Quadrant | DetID | PixID | Counts | Sigma | Mean | Median | Sigma |
| A | 10 | 83 | 574656 | 4743.94 | 582 | 572 | 121.0 |
| A | 10 | 255 | 467708 | 3860.18 | 582 | 572 | 121.0 |
| A | 2 | 79 | 58092 | 475.32 | 582 | 572 | 121.0 |
| B | 0 | 229 | 169073 | 1492.62 | 580 | 564 | 112.9 |
| B | 12 | 111 | 14212 | 120.89 | 580 | 564 | 112.9 |
| B | 11 | 111 | 12812 | 108.49 | 580 | 564 | 112.9 |
| C | 15 | 214 | 225172 | 1689.97 | 566 | 570 | 132.9 |
| C | 14 | 254 | 34503 | 255.32 | 566 | 570 | 132.9 |
| C | 3 | 233 | 12926 | 92.97 | 566 | 570 | 132.9 |
| D | 2 | 249 | 2174633 | 16626.43 | 534 | 520 | 130.8 |
| D | 1 | 52 | 377440 | 2882.48 | 534 | 520 | 130.8 |
| D | 12 | 233 | 75672 | 574.72 | 534 | 520 | 130.8 |
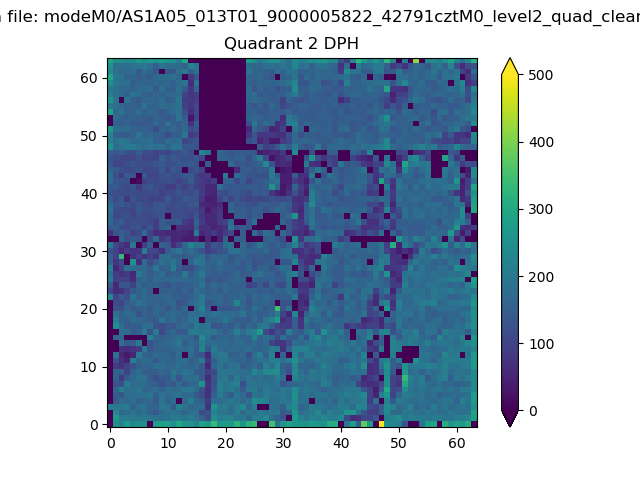
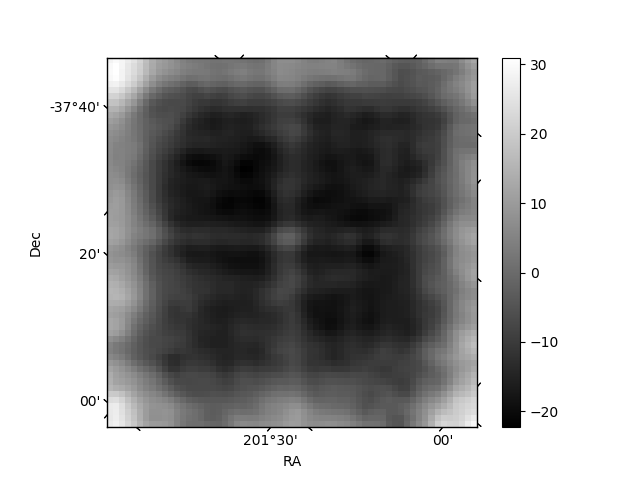
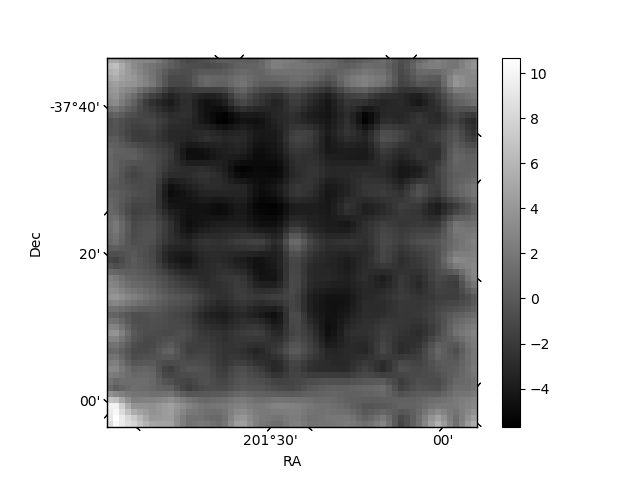
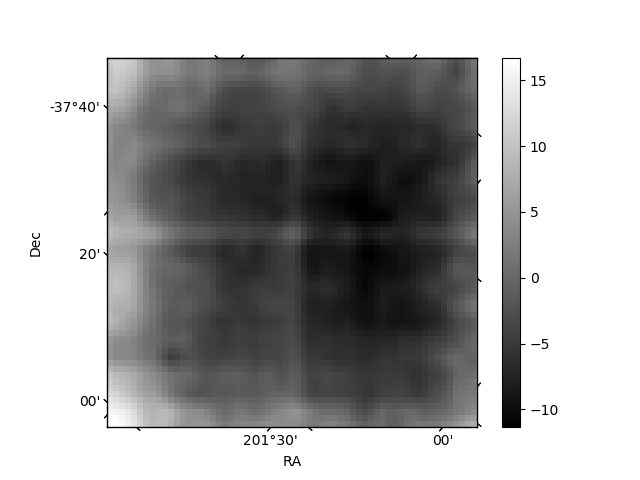
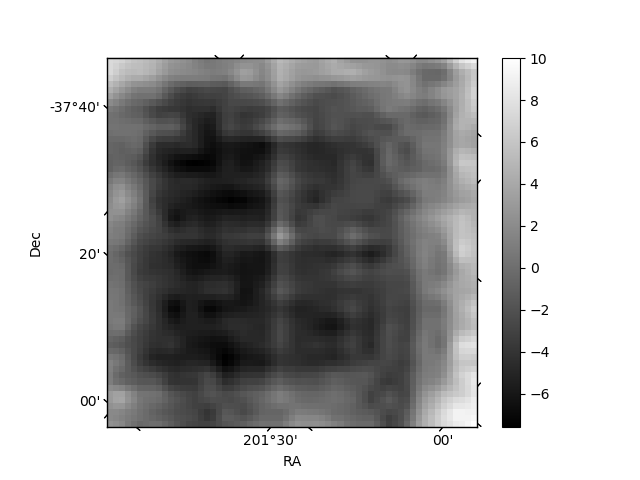
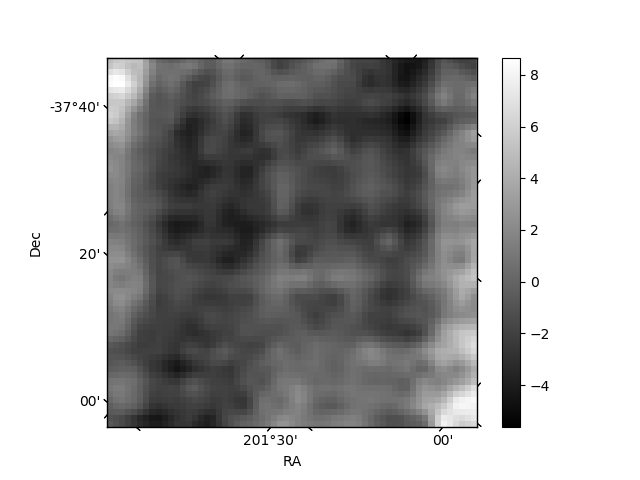
Histogram calculated using DETX and DETY for each event in the final _common_clean file
| Quadrant A | 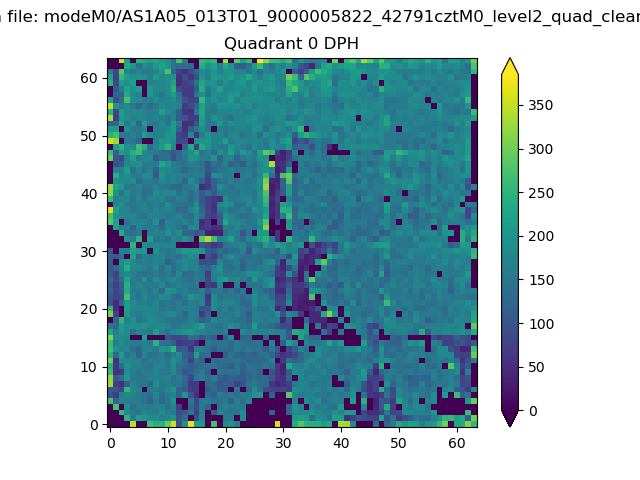 |
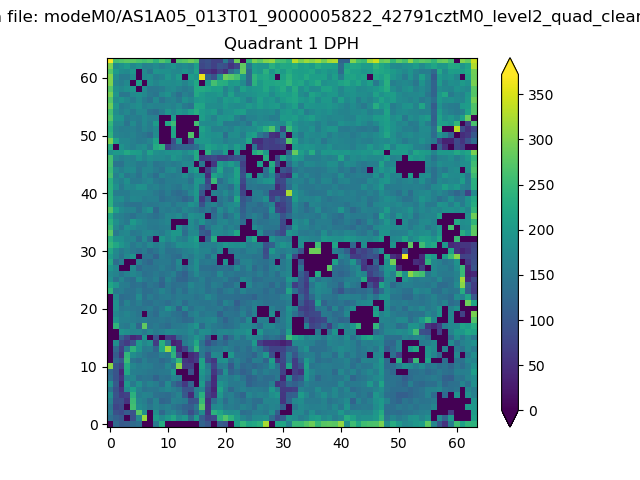 |
Quadrant B |
|---|---|---|---|
| Quadrant D | 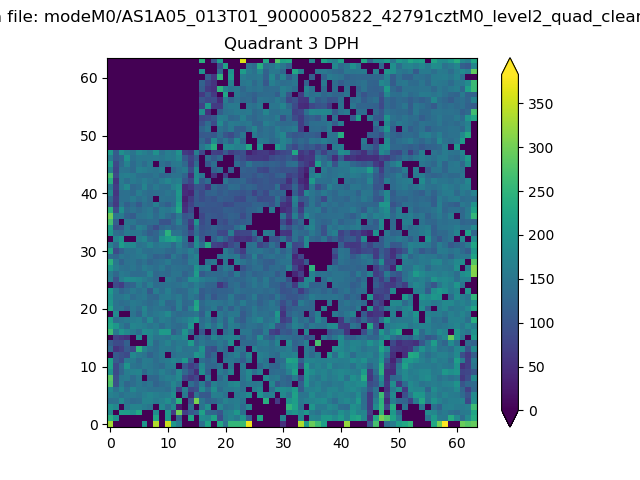 |
 |
Quadrant C |
| Plot type | Count rate plots | Images |
|---|---|---|
| Comparison with Poisson distribution Blue bars denote a histogram of data divided into 1 sec bins. Red curve is a Poisson curve with rate = median count rate of data. |
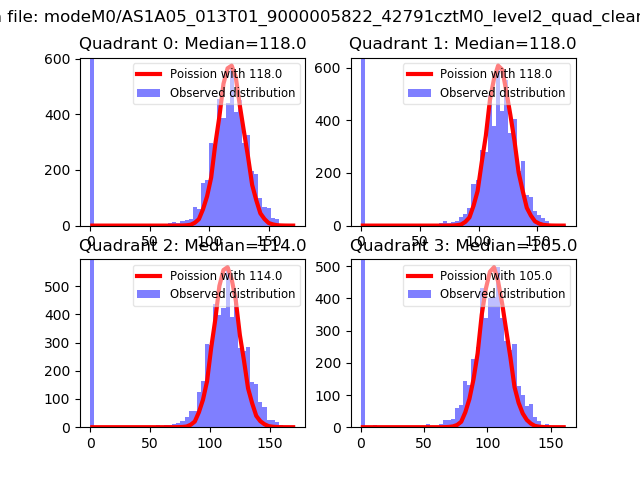 |
 |
| Quadrant-wise count rates Data is divided into 100 sec bins |
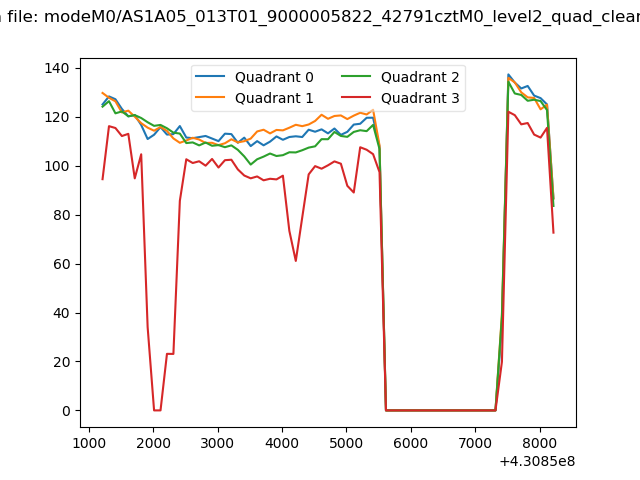 |
|
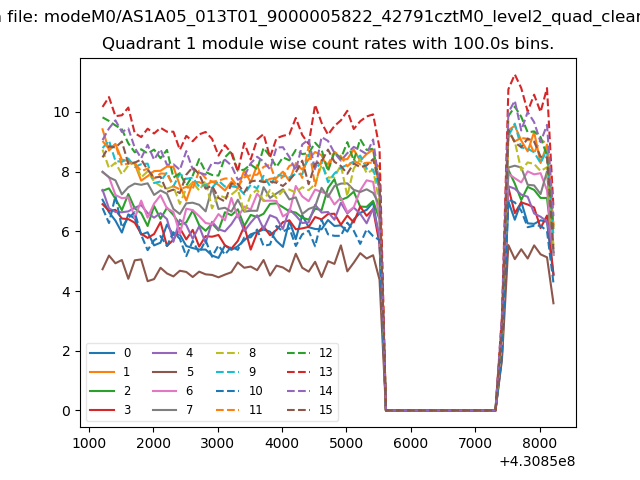
| Module-wise count rates for Quadrant A Data is divided into 100 sec bins |
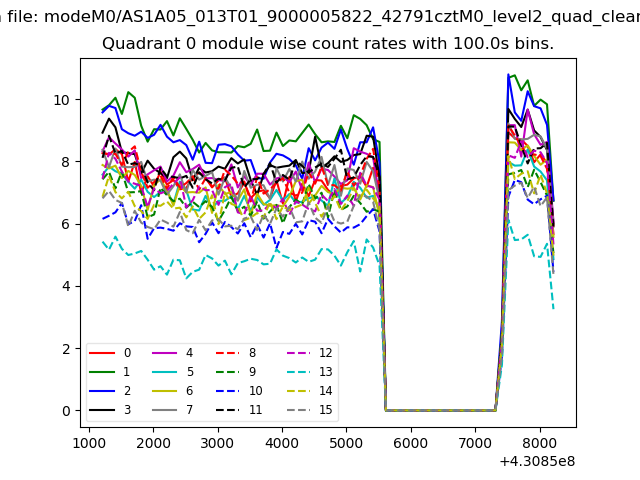 |
 |
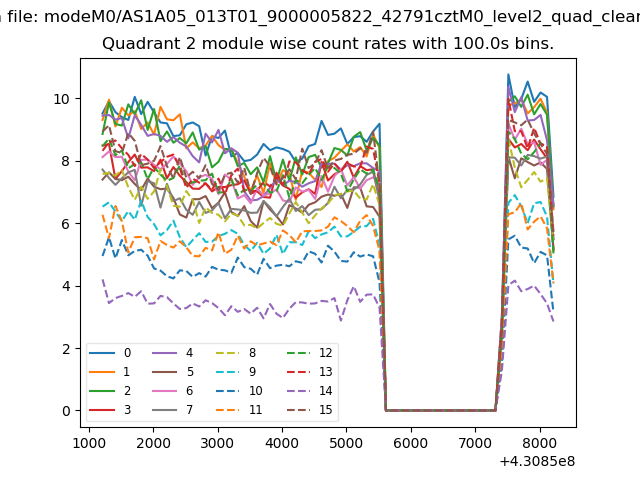
| Module-wise count rates for Quadrant B Data is divided into 100 sec bins |
 |
 |
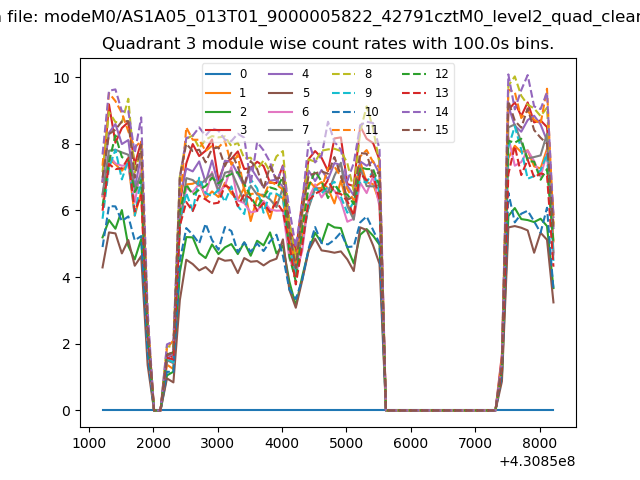
| Module-wise count rates for Quadrant C Data is divided into 100 sec bins |
 |
 |
| Module-wise count rates for Quadrant D Data is divided into 100 sec bins |
 |
 |
| Parameter | Plot |
|---|---|
| CZT HV Monitor | 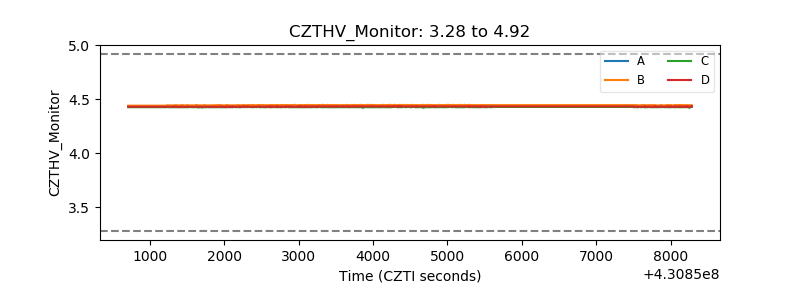 |
| D_VDD | 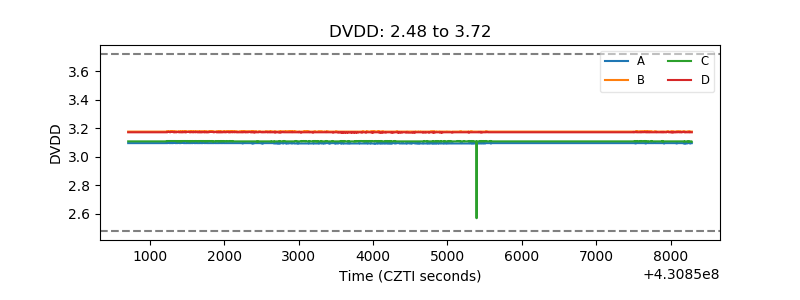 |
| Temperature 1 | 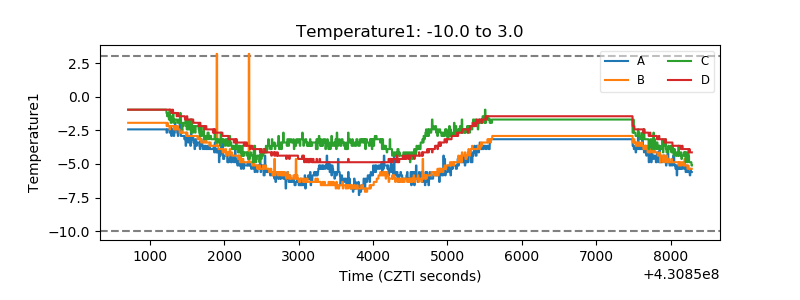 |
| Veto HV Monitor | 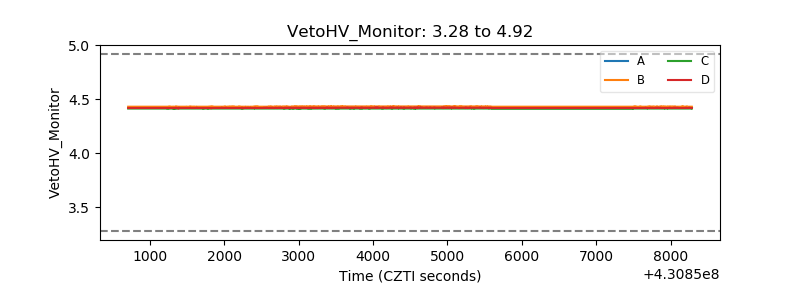 |
| Veto LLD | 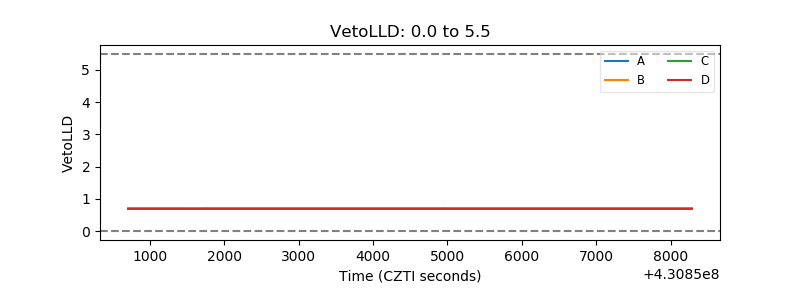 |
| Alpha Counter | 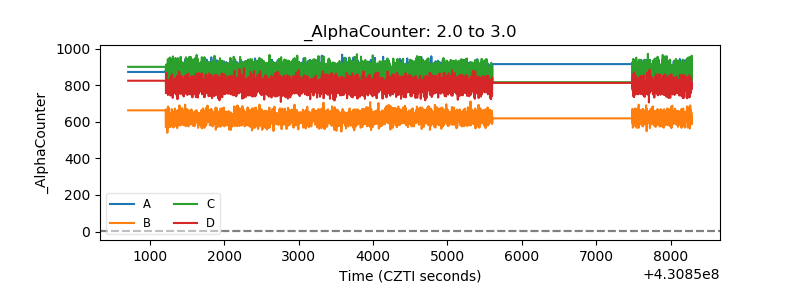 |
| _CPM_Rate | 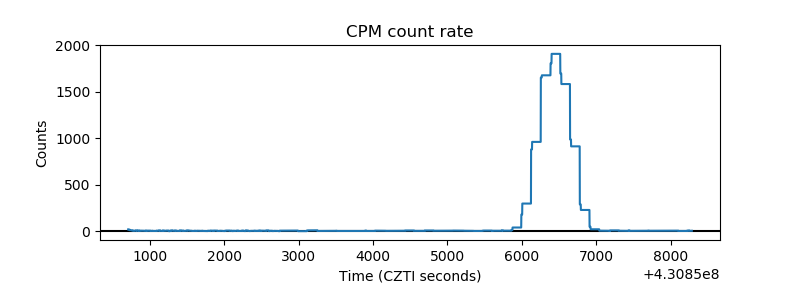 |
| CZT Counter | 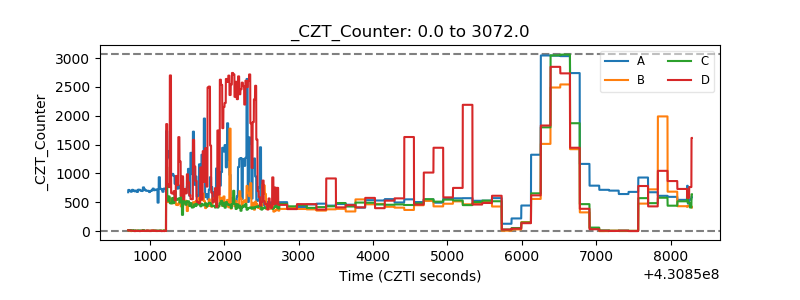 |
| +2.5 Volts monitor | 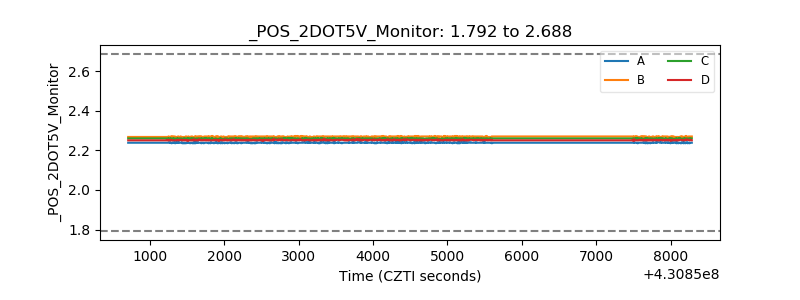 |
| +5 Volts monitor | 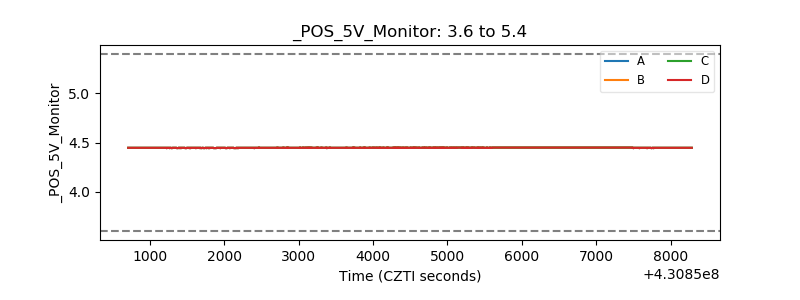 |
| _ROLL_ROT | 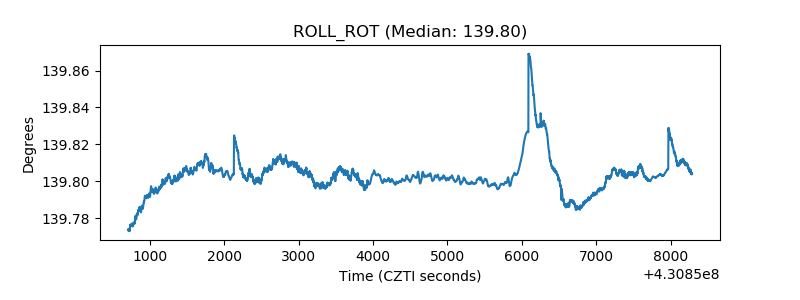 |
| _Roll_DEC | 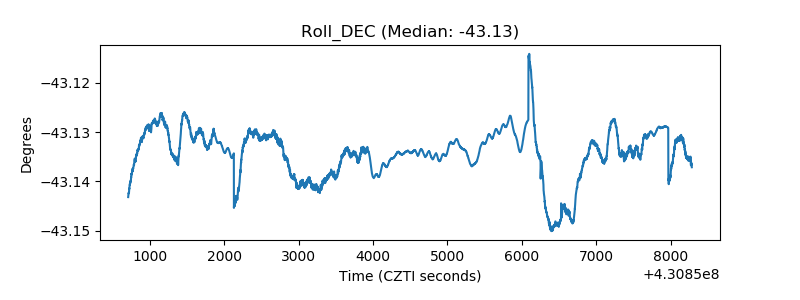 |
| _Roll_RA | 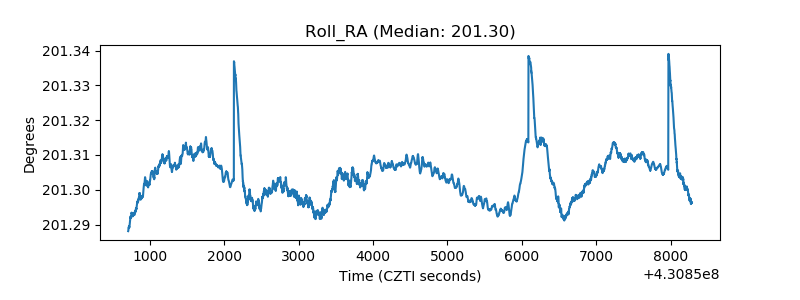 |
| Veto Counter | 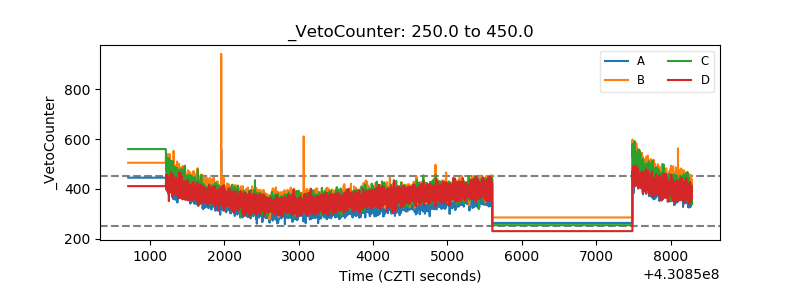 |