| Param | Original file | Final file |
|---|---|---|
| Filename | modeM0/AS1A05_013T01_9000005822_42792cztM0_level2.fits | modeM0/AS1A05_013T01_9000005822_42792cztM0_level2_quad_clean.evt |
| Size (bytes) | 325,820,160 | 90,452,160 |
| Size | 310.7 MB | 86.3 MB |
| Events in quadrant A | 2,881,907 | 620,948 |
| Events in quadrant B | 2,387,220 | 629,213 |
| Events in quadrant C | 2,567,512 | 601,747 |
| Events in quadrant D | 3,827,606 | 530,274 |
| Mode M0 | |||
|---|---|---|---|
| Quadrant | BADHDUFLAG | Total packets | Discarded packets |
| A | 0 | 11515 | 2 |
| B | 0 | 10443 | 2 |
| C | 0 | 10661 | 2 |
| D | 0 | 14874 | 2 |
| Mode M9 | |||
|---|---|---|---|
| Quadrant | BADHDUFLAG | Total packets | Discarded packets |
| A | 0 | 29 | 0 |
| B | 0 | 30 | 0 |
| C | 0 | 30 | 0 |
| D | 0 | 30 | 0 |
| Mode SS | |||
|---|---|---|---|
| Quadrant | BADHDUFLAG | Total packets | Discarded packets |
| A | 0 | 104 | 0 |
| B | 0 | 104 | 0 |
| C | 0 | 104 | 0 |
| D | 0 | 104 | 0 |
| Quadrant | Total seconds | Saturated seconds | Saturation percentage |
|---|---|---|---|
| A | 5088 | 12 | 0.235849% |
| B | 5088 | 11 | 0.216195% |
| C | 5088 | 26 | 0.511006% |
| D | 5088 | 342 | 6.721698% |
Noise dominated data is calculated using 1-second bins in cleaned event files. If a bin has >2000 counts, and if more than 50% of those come from <1% of pixels, then it is considered to be noise-dominated and hence unusable.
| Quadrant | # 1 sec bins | Bins with >0 counts | Bins with >2000 counts | High rate bins dominated by noise | Noise dominated (total time) | Noise dominated (detector-on time) | Marked lightcurve |
|---|---|---|---|---|---|---|---|
| A | 7090 | 5089 | 6 | 6 | 0.08% | 0.12% | 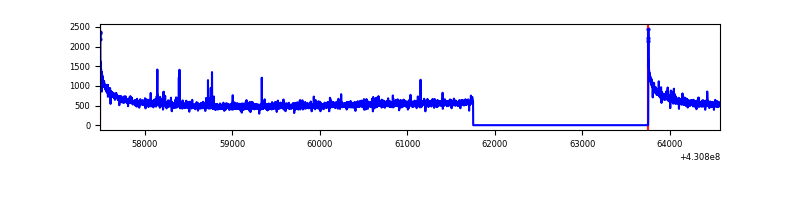 |
| B | 7090 | 5089 | 4 | 4 | 0.06% | 0.08% | 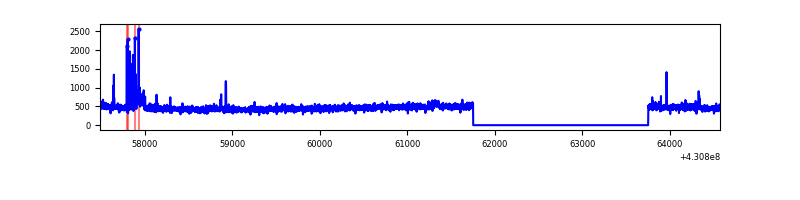 |
| C | 7090 | 5089 | 22 | 22 | 0.31% | 0.43% | 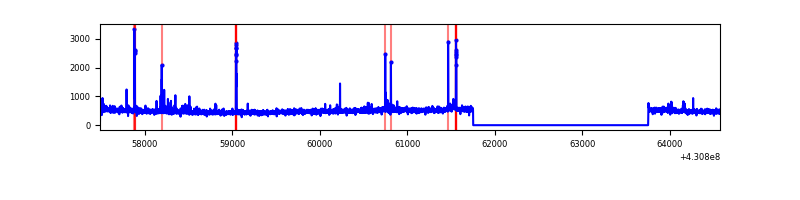 |
| D | 7090 | 5089 | 290 | 290 | 4.09% | 5.70% | 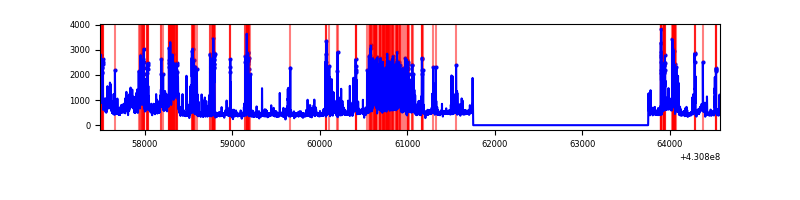 |
Top three noisy pixels from each quadrant. If the there are fewer than three noisy pixels in the level2.evt file, extra rows are filled as -1
| Pixel properties | Quadrant properties | ||||||
|---|---|---|---|---|---|---|---|
| Quadrant | DetID | PixID | Counts | Sigma | Mean | Median | Sigma |
| A | 10 | 83 | 552897 | 4574.25 | 587 | 575 | 120.7 |
| A | 2 | 79 | 20257 | 163.0 | 587 | 575 | 120.7 |
| A | 13 | 248 | 19257 | 154.72 | 587 | 575 | 120.7 |
| B | 0 | 229 | 70575 | 622.4 | 583 | 566 | 112.5 |
| B | 12 | 0 | 14250 | 121.66 | 583 | 566 | 112.5 |
| B | 12 | 111 | 14110 | 120.41 | 583 | 566 | 112.5 |
| C | 15 | 214 | 219462 | 1651.64 | 569 | 575 | 132.5 |
| C | 14 | 254 | 93890 | 704.12 | 569 | 575 | 132.5 |
| C | 0 | 207 | 21875 | 160.72 | 569 | 575 | 132.5 |
| D | 2 | 249 | 1150894 | 8551.59 | 551 | 536 | 134.5 |
| D | 1 | 52 | 395437 | 2935.63 | 551 | 536 | 134.5 |
| D | 5 | 70 | 60121 | 442.94 | 551 | 536 | 134.5 |
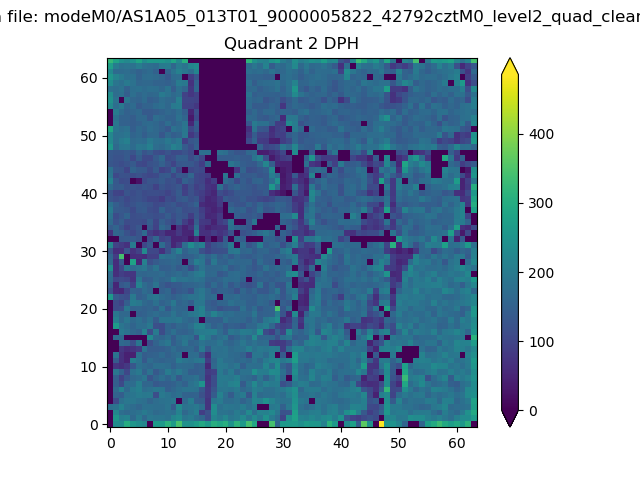
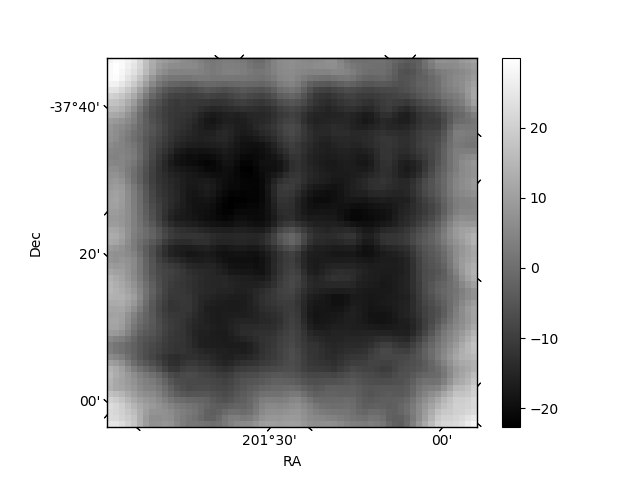
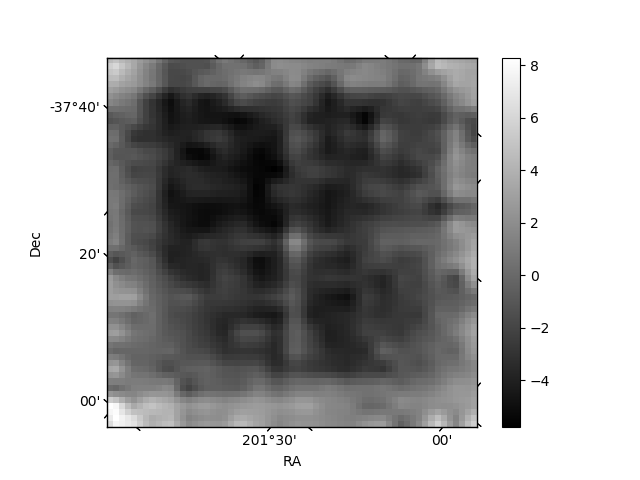
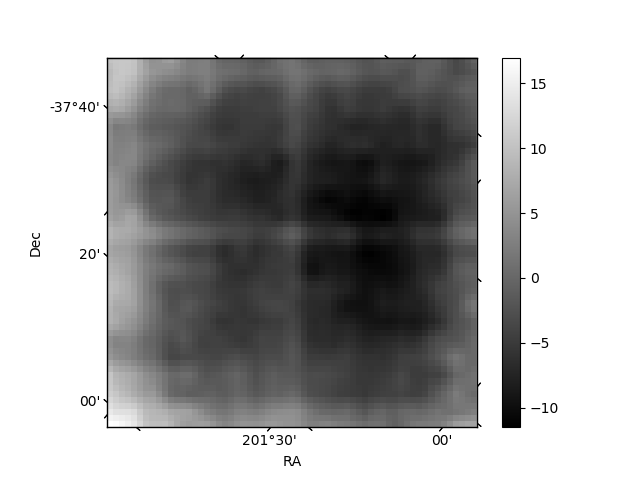
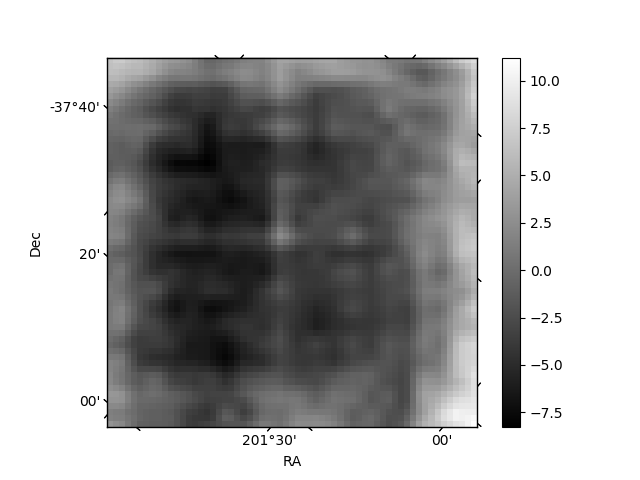
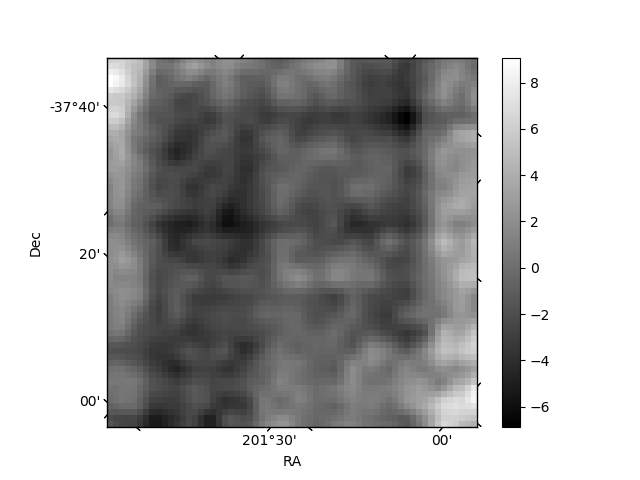
Histogram calculated using DETX and DETY for each event in the final _common_clean file
| Quadrant A | 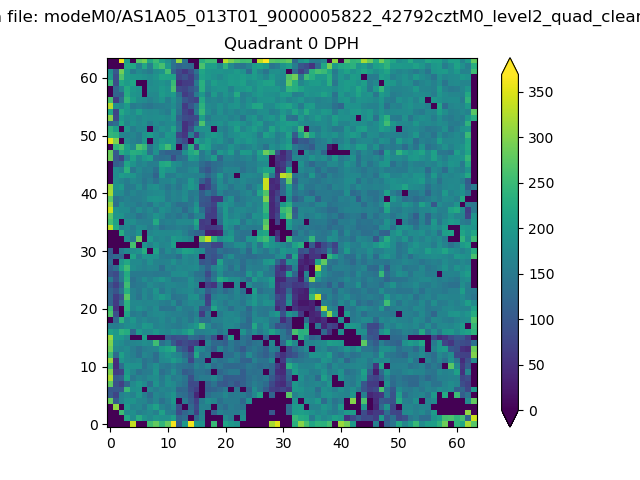 |
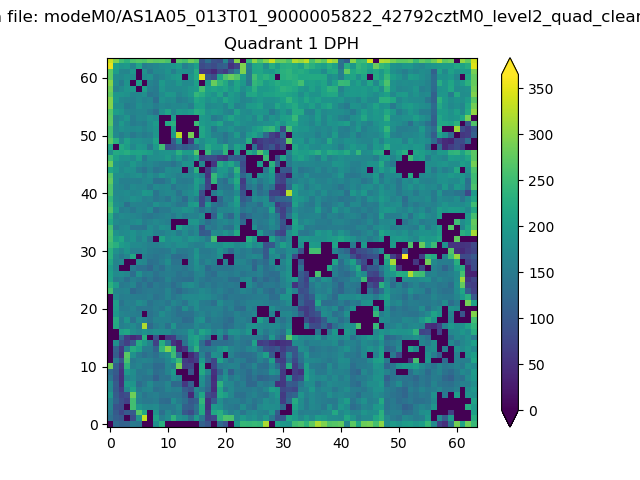 |
Quadrant B |
|---|---|---|---|
| Quadrant D | 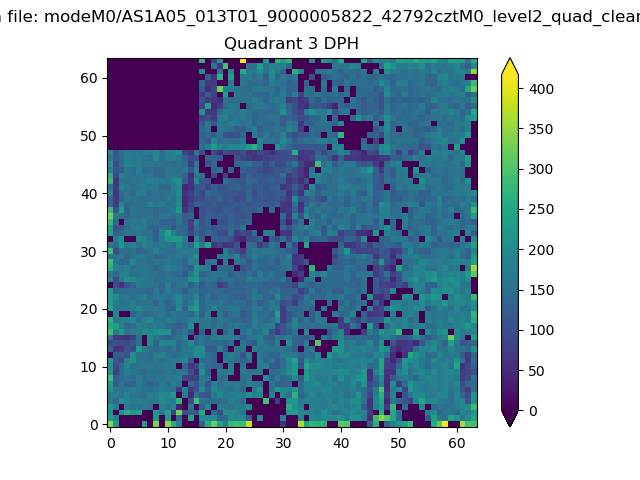 |
 |
Quadrant C |
| Plot type | Count rate plots | Images |
|---|---|---|
| Comparison with Poisson distribution Blue bars denote a histogram of data divided into 1 sec bins. Red curve is a Poisson curve with rate = median count rate of data. |
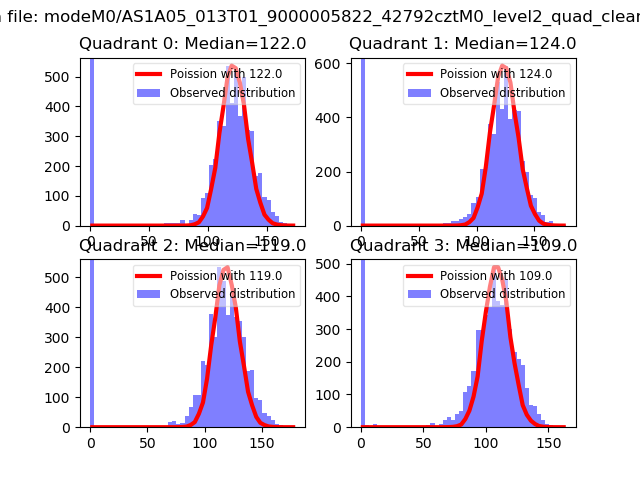 |
 |
| Quadrant-wise count rates Data is divided into 100 sec bins |
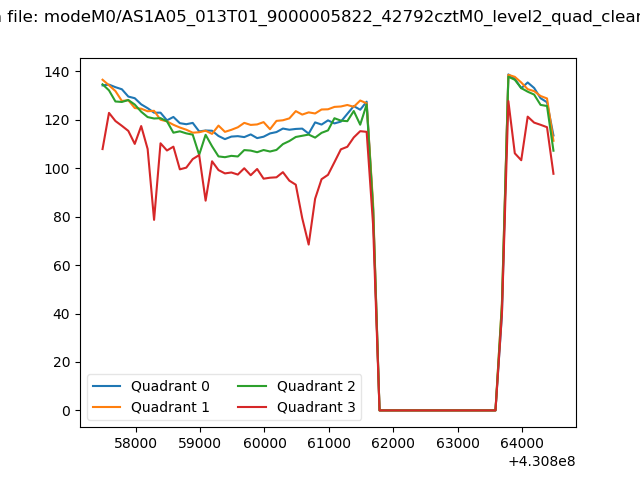 |
|
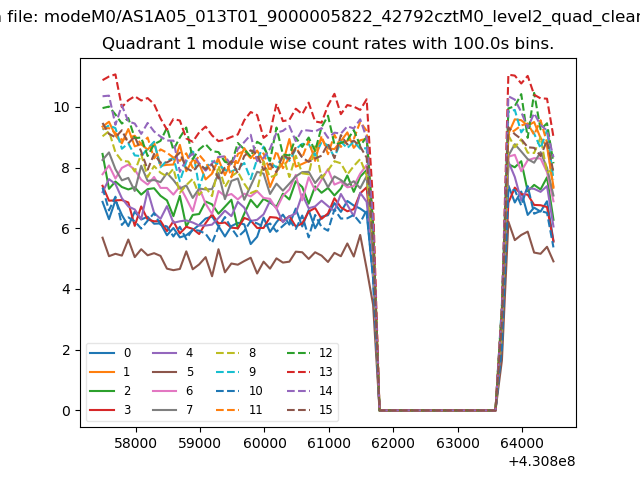
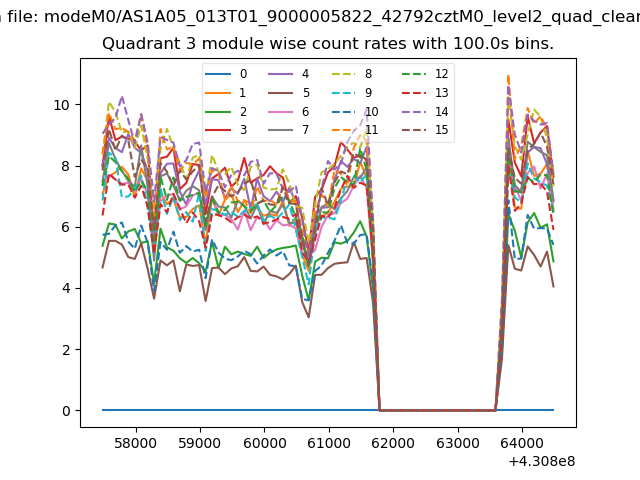
| Module-wise count rates for Quadrant A Data is divided into 100 sec bins |
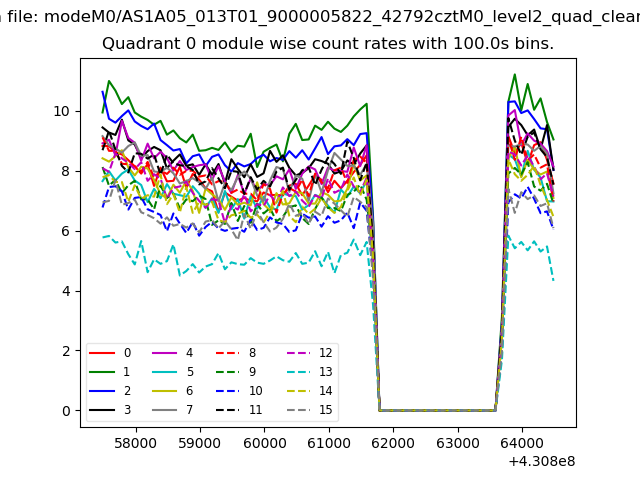 |
 |
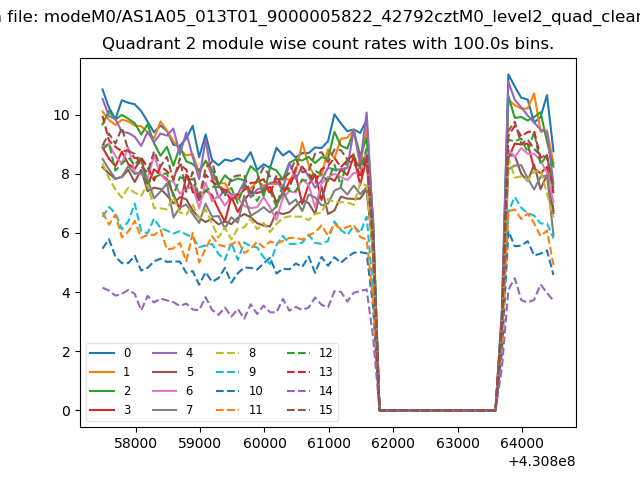
| Module-wise count rates for Quadrant B Data is divided into 100 sec bins |
 |
 |
| Module-wise count rates for Quadrant C Data is divided into 100 sec bins |
 |
 |
| Module-wise count rates for Quadrant D Data is divided into 100 sec bins |
 |
 |
| Parameter | Plot |
|---|---|
| CZT HV Monitor | 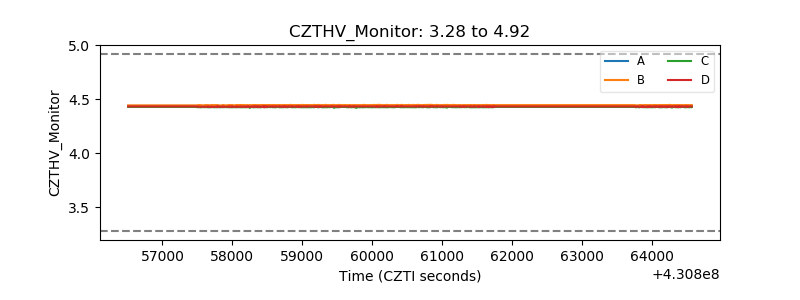 |
| D_VDD | 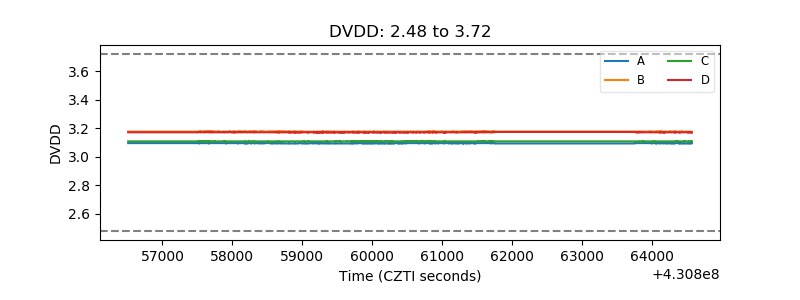 |
| Temperature 1 | 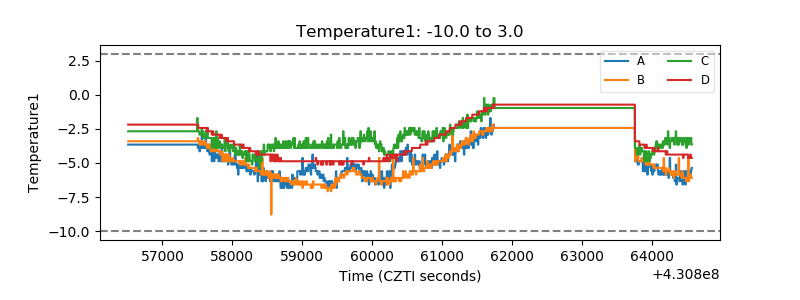 |
| Veto HV Monitor |  |
| Veto LLD | 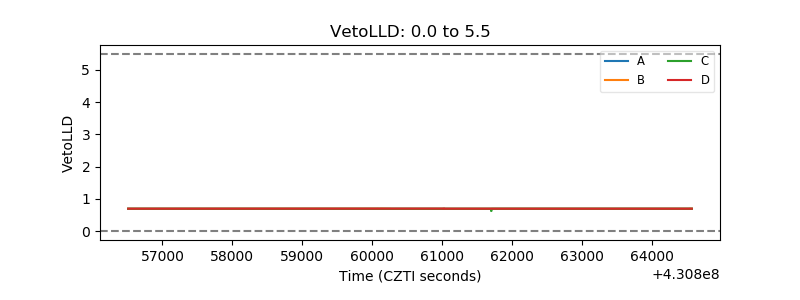 |
| Alpha Counter | 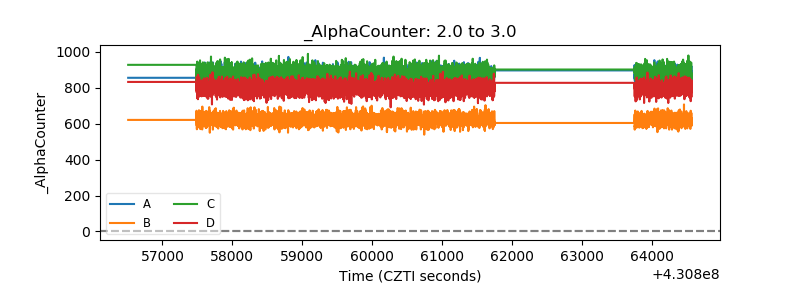 |
| _CPM_Rate | 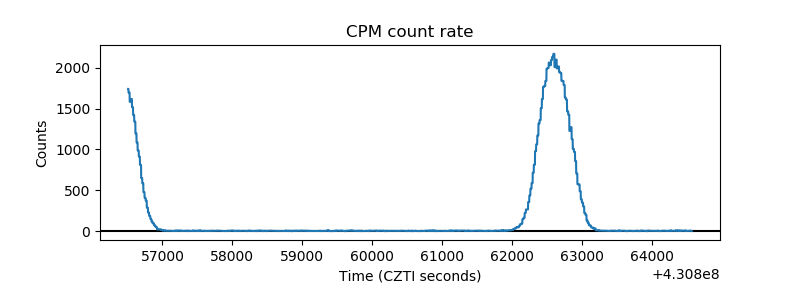 |
| CZT Counter | 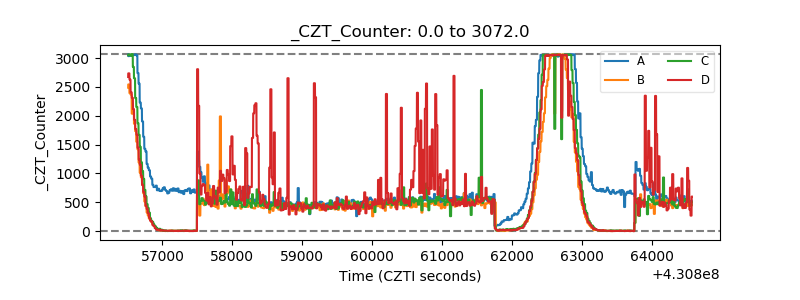 |
| +2.5 Volts monitor | 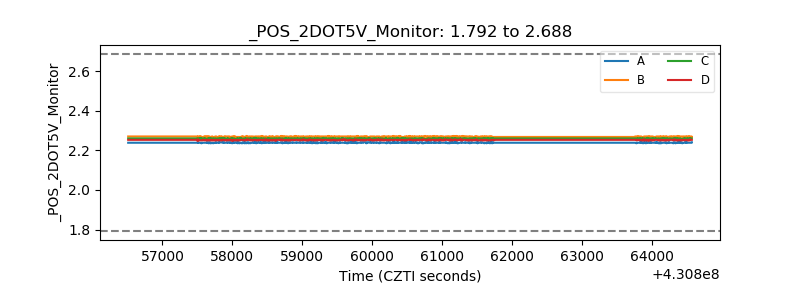 |
| +5 Volts monitor | 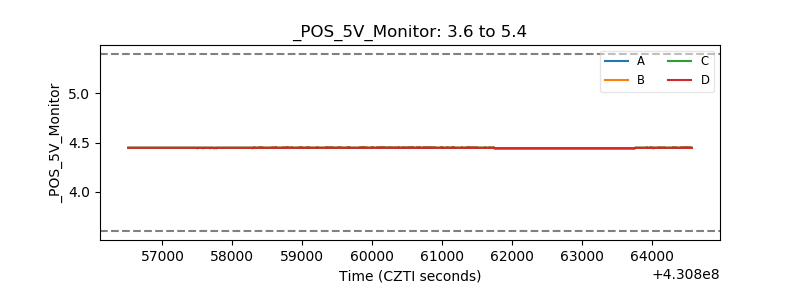 |
| _ROLL_ROT | 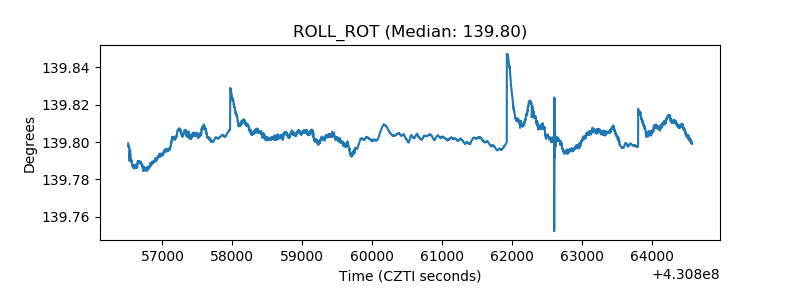 |
| _Roll_DEC | 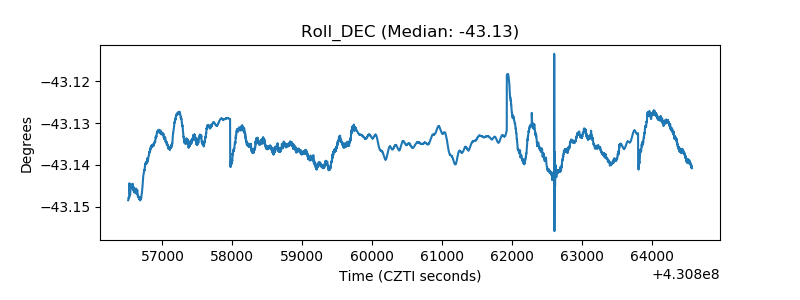 |
| _Roll_RA | 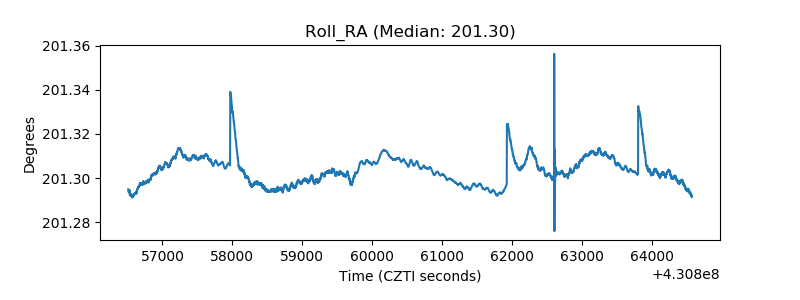 |
| Veto Counter | 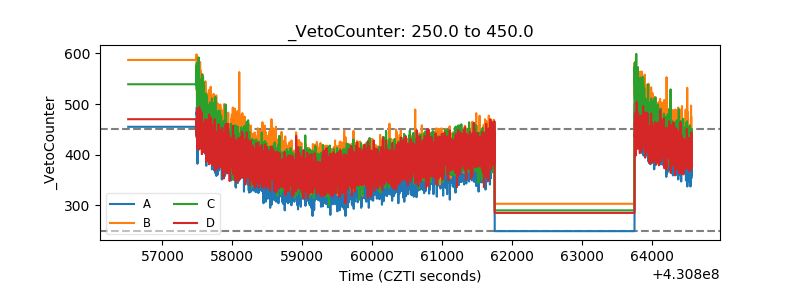 |