| Param | Original file | Final file |
|---|---|---|
| Filename | modeM0/AS1A05_013T01_9000005822_42793cztM0_level2.fits | modeM0/AS1A05_013T01_9000005822_42793cztM0_level2_quad_clean.evt |
| Size (bytes) | 334,310,400 | 88,588,800 |
| Size | 318.8 MB | 84.5 MB |
| Events in quadrant A | 2,829,765 | 613,882 |
| Events in quadrant B | 2,676,286 | 611,452 |
| Events in quadrant C | 2,775,337 | 593,301 |
| Events in quadrant D | 3,707,444 | 516,587 |
| Mode M0 | |||
|---|---|---|---|
| Quadrant | BADHDUFLAG | Total packets | Discarded packets |
| A | 0 | 11270 | 2 |
| B | 0 | 11025 | 2 |
| C | 0 | 11228 | 2 |
| D | 0 | 14413 | 2 |
| Mode M9 | |||
|---|---|---|---|
| Quadrant | BADHDUFLAG | Total packets | Discarded packets |
| A | 0 | 24 | 0 |
| B | 0 | 25 | 0 |
| C | 0 | 25 | 0 |
| D | 0 | 25 | 0 |
| Mode SS | |||
|---|---|---|---|
| Quadrant | BADHDUFLAG | Total packets | Discarded packets |
| A | 0 | 100 | 0 |
| B | 0 | 100 | 0 |
| C | 0 | 100 | 0 |
| D | 0 | 100 | 0 |
| Quadrant | Total seconds | Saturated seconds | Saturation percentage |
|---|---|---|---|
| A | 4956 | 12 | 0.242131% |
| B | 4956 | 127 | 2.562550% |
| C | 4956 | 40 | 0.807103% |
| D | 4956 | 358 | 7.223567% |
Noise dominated data is calculated using 1-second bins in cleaned event files. If a bin has >2000 counts, and if more than 50% of those come from <1% of pixels, then it is considered to be noise-dominated and hence unusable.
| Quadrant | # 1 sec bins | Bins with >0 counts | Bins with >2000 counts | High rate bins dominated by noise | Noise dominated (total time) | Noise dominated (detector-on time) | Marked lightcurve |
|---|---|---|---|---|---|---|---|
| A | 7049 | 4957 | 5 | 5 | 0.07% | 0.10% | 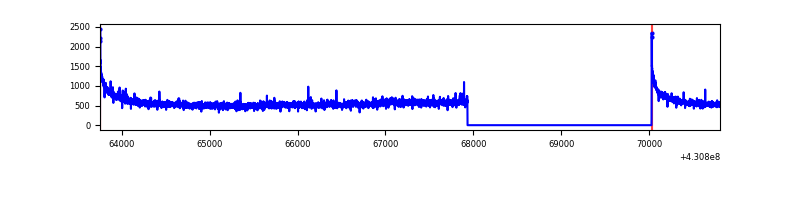 |
| B | 7049 | 4957 | 109 | 109 | 1.55% | 2.20% | 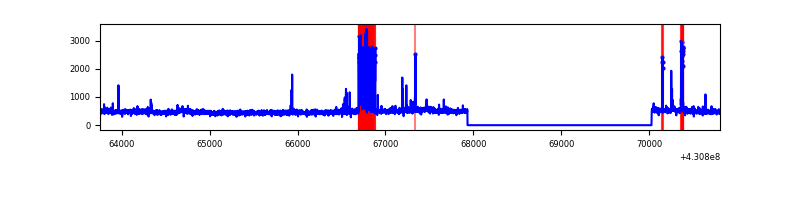 |
| C | 7049 | 4957 | 39 | 39 | 0.55% | 0.79% | 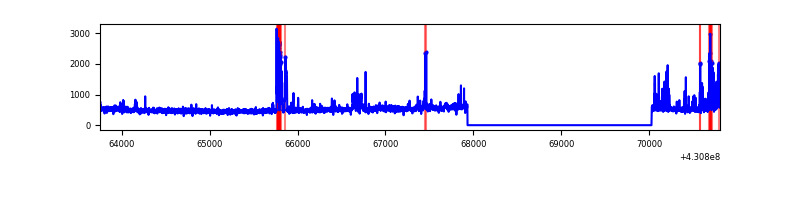 |
| D | 7049 | 4957 | 332 | 332 | 4.71% | 6.70% |  |
Top three noisy pixels from each quadrant. If the there are fewer than three noisy pixels in the level2.evt file, extra rows are filled as -1
| Pixel properties | Quadrant properties | ||||||
|---|---|---|---|---|---|---|---|
| Quadrant | DetID | PixID | Counts | Sigma | Mean | Median | Sigma |
| A | 10 | 83 | 524210 | 4446.04 | 580 | 569 | 117.8 |
| A | 2 | 79 | 50942 | 427.7 | 580 | 569 | 117.8 |
| A | 13 | 254 | 7184 | 56.17 | 580 | 569 | 117.8 |
| B | 0 | 229 | 343037 | 3125.19 | 569 | 554 | 109.6 |
| B | 12 | 0 | 57466 | 519.33 | 569 | 554 | 109.6 |
| B | 5 | 255 | 14974 | 131.58 | 569 | 554 | 109.6 |
| C | 14 | 254 | 286594 | 2165.56 | 562 | 565 | 132.1 |
| C | 15 | 214 | 214845 | 1622.34 | 562 | 565 | 132.1 |
| C | 10 | 34 | 65776 | 493.72 | 562 | 565 | 132.1 |
| D | 2 | 249 | 1472471 | 11008.66 | 546 | 531 | 133.7 |
| D | 1 | 52 | 52906 | 391.71 | 546 | 531 | 133.7 |
| D | 5 | 70 | 39544 | 291.78 | 546 | 531 | 133.7 |
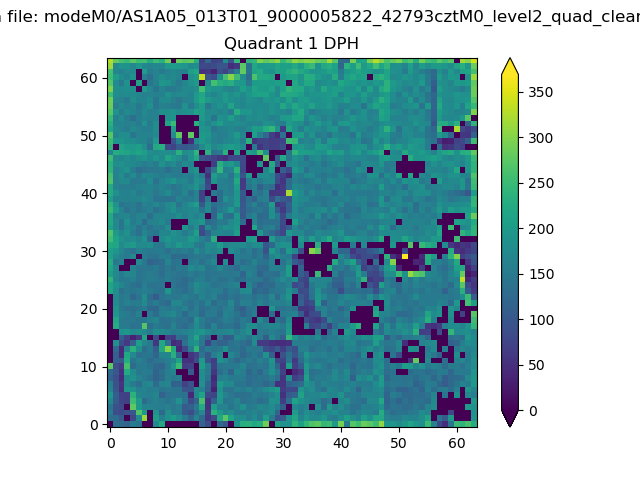
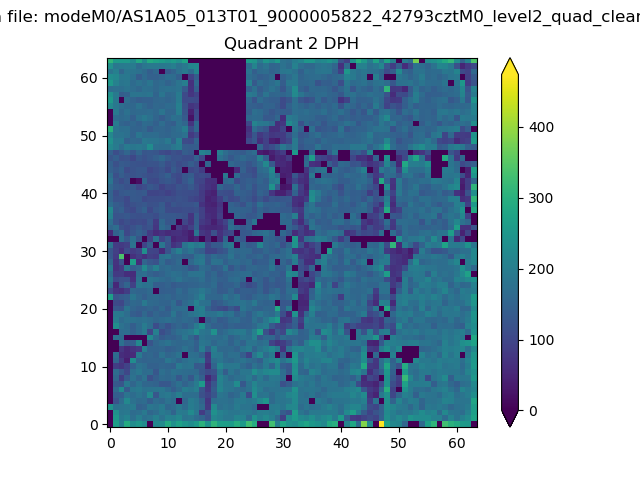
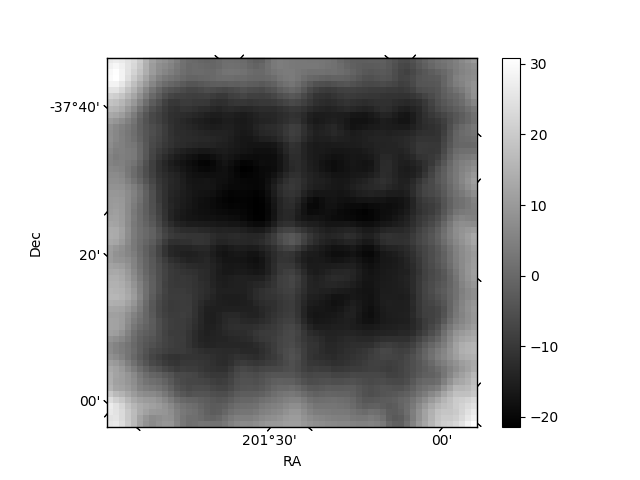
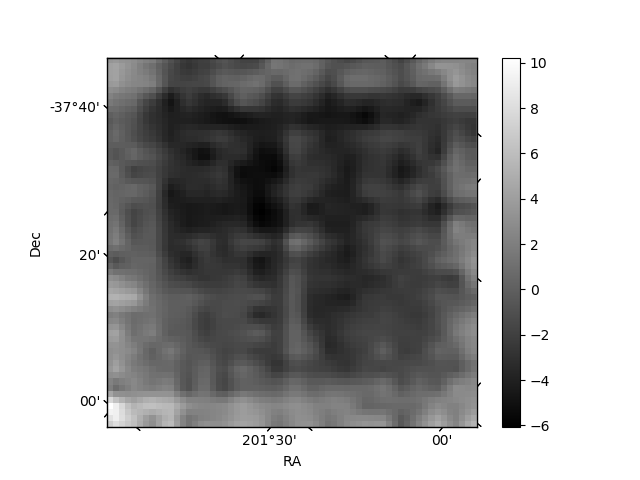
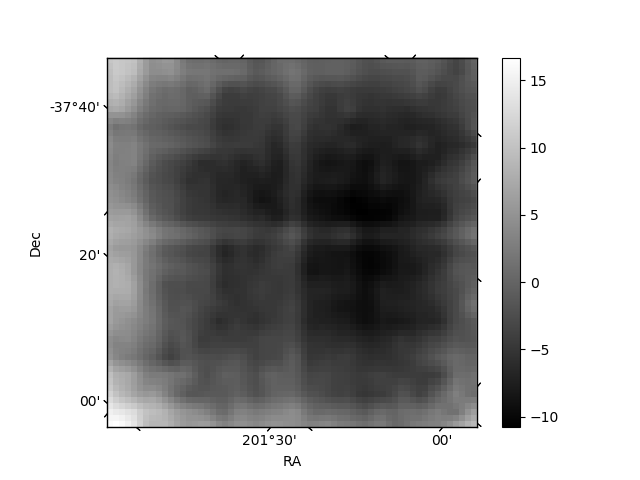
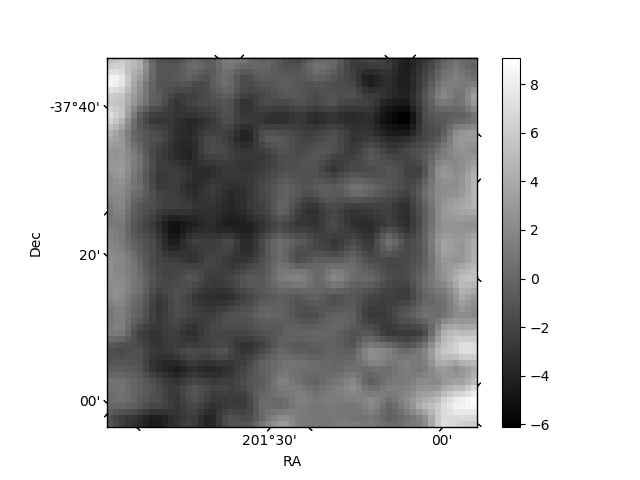
Histogram calculated using DETX and DETY for each event in the final _common_clean file
| Quadrant A | 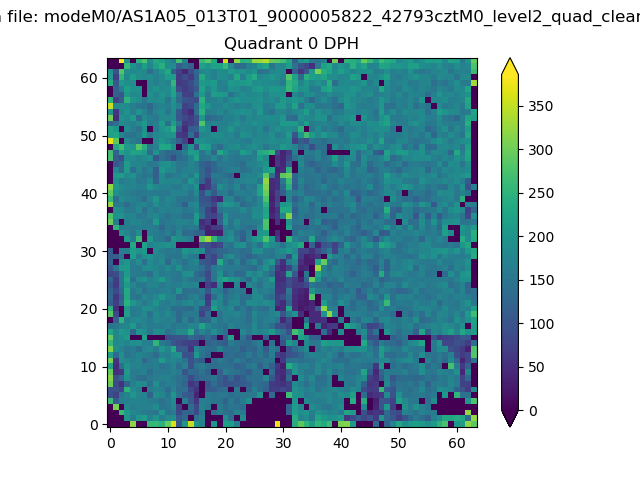 |
 |
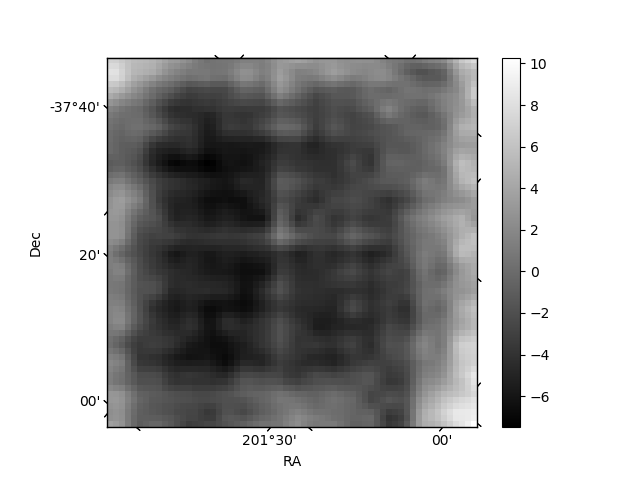
Quadrant B |
|---|---|---|---|
| Quadrant D | 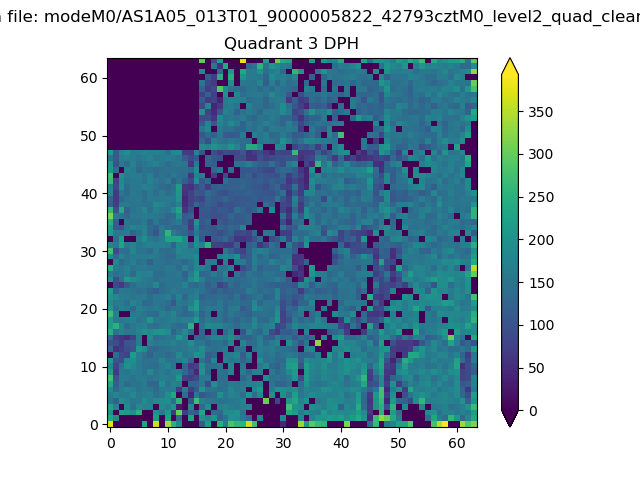 |
 |
Quadrant C |
| Plot type | Count rate plots | Images |
|---|---|---|
| Comparison with Poisson distribution Blue bars denote a histogram of data divided into 1 sec bins. Red curve is a Poisson curve with rate = median count rate of data. |
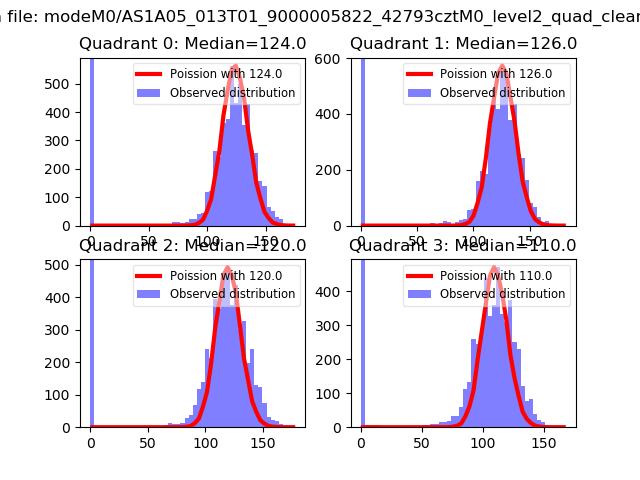 |
 |
| Quadrant-wise count rates Data is divided into 100 sec bins |
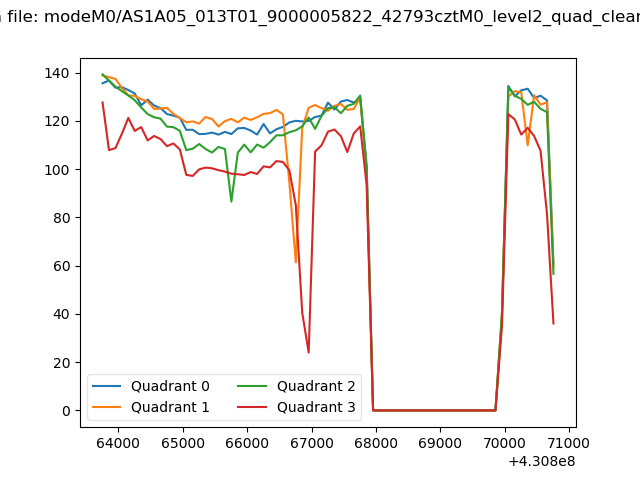 |
|
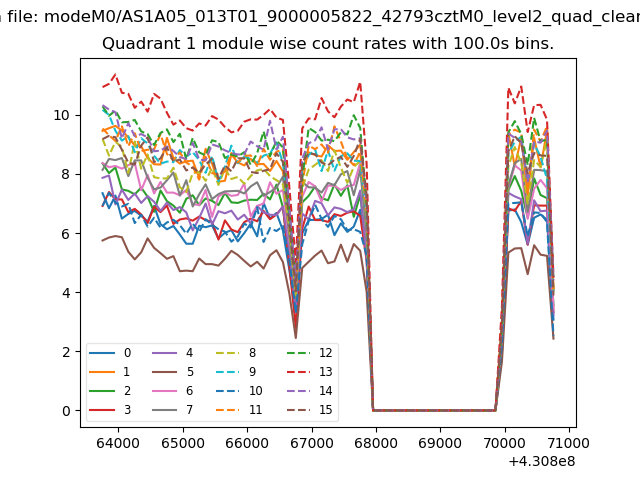
| Module-wise count rates for Quadrant A Data is divided into 100 sec bins |
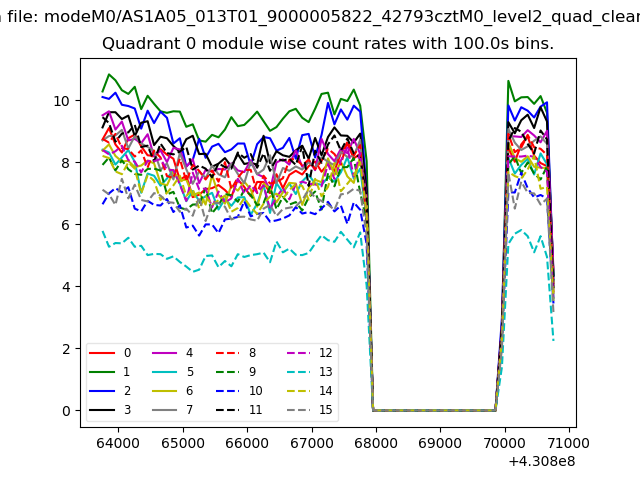 |
 |
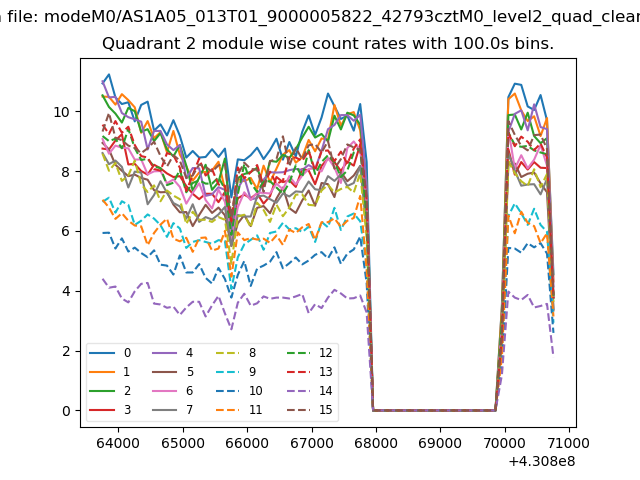
| Module-wise count rates for Quadrant B Data is divided into 100 sec bins |
 |
 |
| Module-wise count rates for Quadrant C Data is divided into 100 sec bins |
 |
 |
| Module-wise count rates for Quadrant D Data is divided into 100 sec bins |
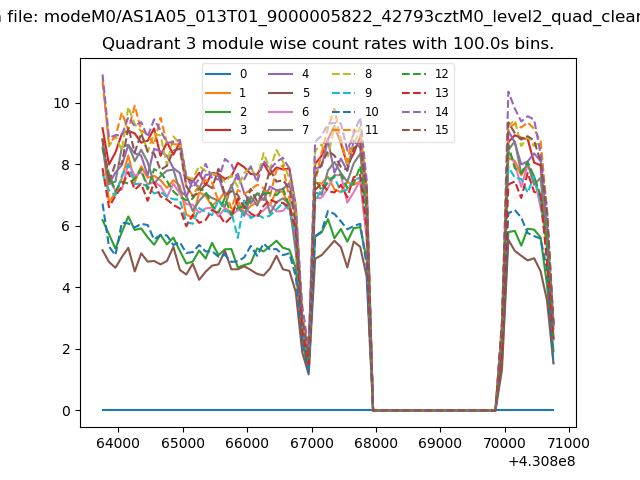 |
 |
| Parameter | Plot |
|---|---|
| CZT HV Monitor | 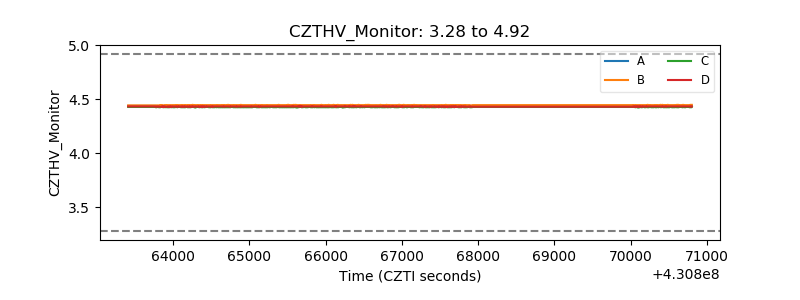 |
| D_VDD | 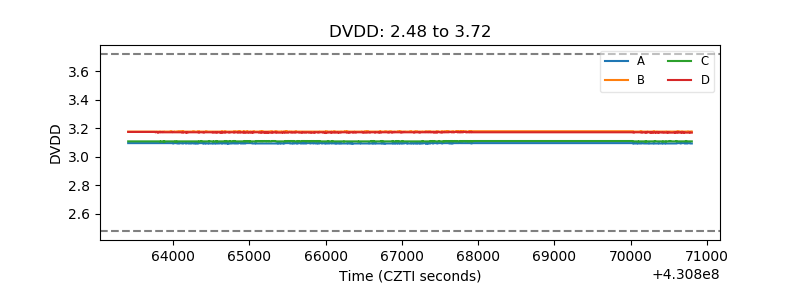 |
| Temperature 1 | 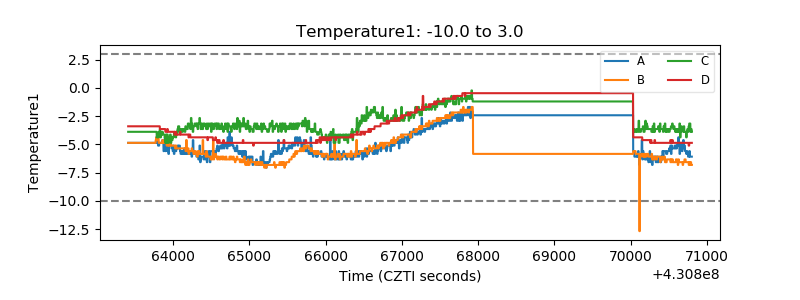 |
| Veto HV Monitor | 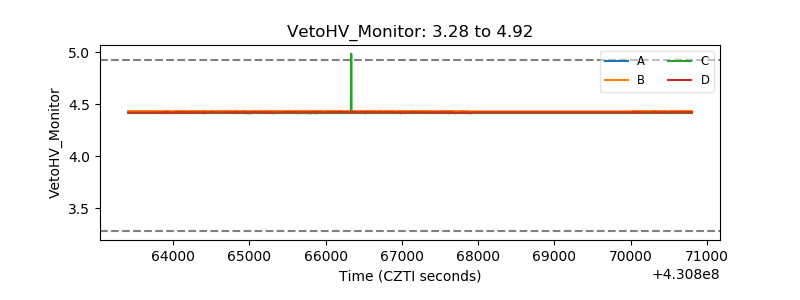 |
| Veto LLD | 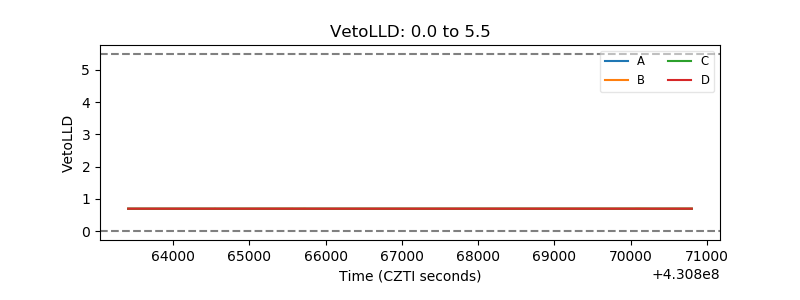 |
| Alpha Counter | 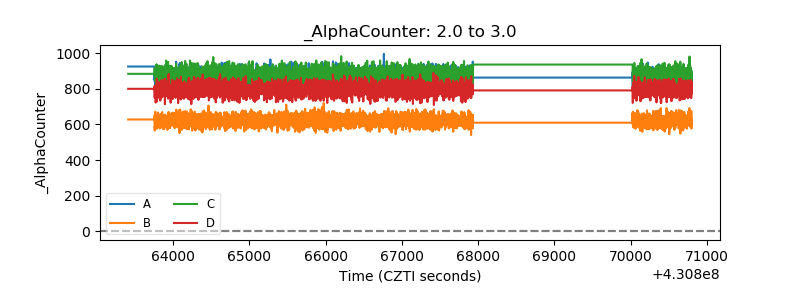 |
| _CPM_Rate | 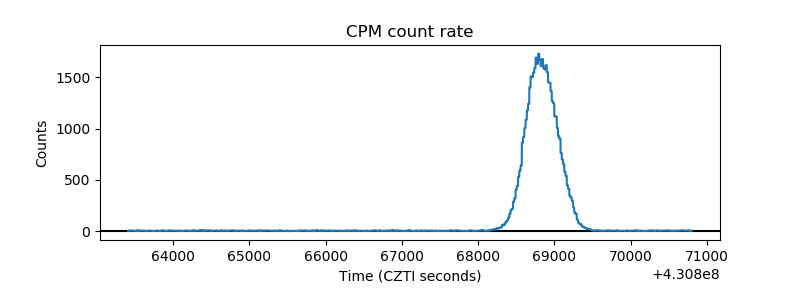 |
| CZT Counter | 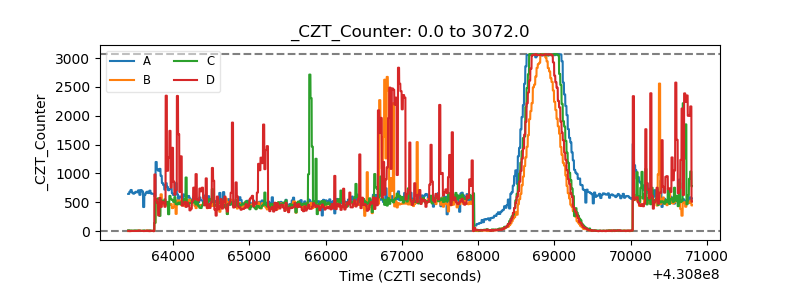 |
| +2.5 Volts monitor | 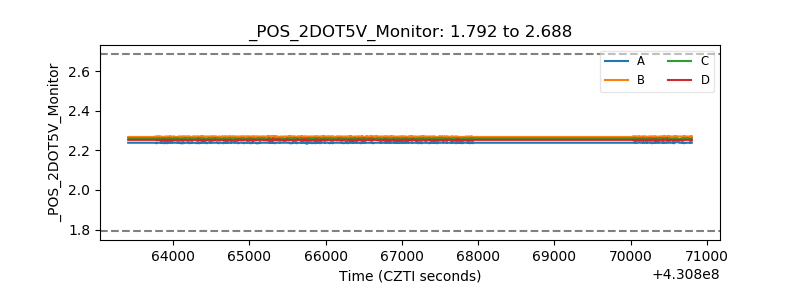 |
| +5 Volts monitor | 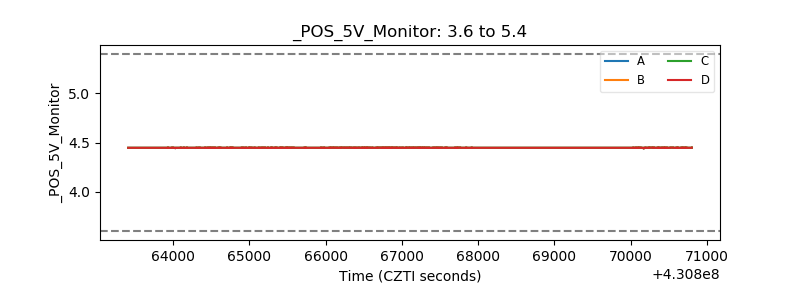 |
| _ROLL_ROT | 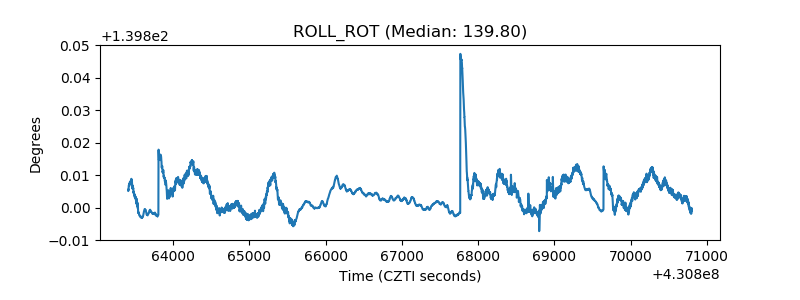 |
| _Roll_DEC | 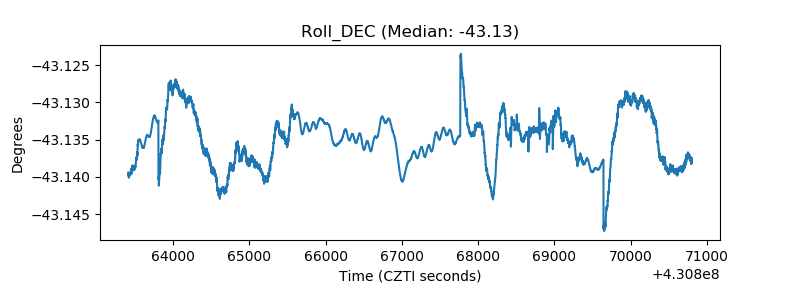 |
| _Roll_RA | 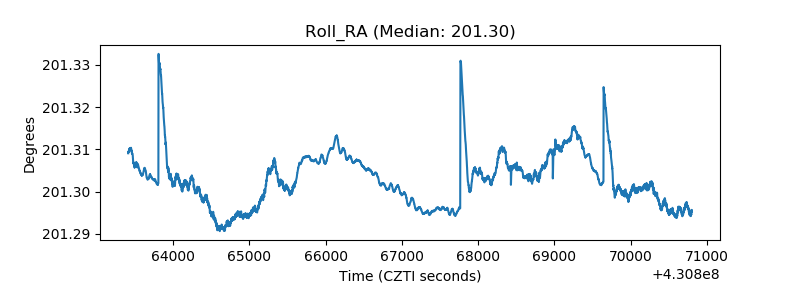 |
| Veto Counter | 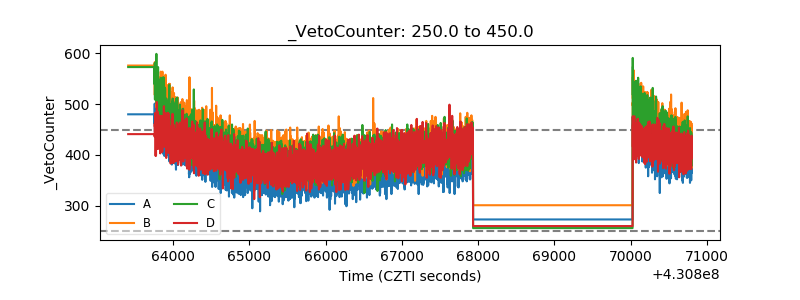 |