| Param | Original file | Final file |
|---|---|---|
| Filename | modeM0/AS1A05_013T01_9000005822_42794cztM0_level2.fits | modeM0/AS1A05_013T01_9000005822_42794cztM0_level2_quad_clean.evt |
| Size (bytes) | 399,790,080 | 82,221,120 |
| Size | 381.3 MB | 78.4 MB |
| Events in quadrant A | 2,704,761 | 594,102 |
| Events in quadrant B | 2,499,624 | 594,633 |
| Events in quadrant C | 2,754,270 | 575,042 |
| Events in quadrant D | 6,460,699 | 384,027 |
| Mode M0 | |||
|---|---|---|---|
| Quadrant | BADHDUFLAG | Total packets | Discarded packets |
| A | 0 | 10795 | 2 |
| B | 0 | 10531 | 2 |
| C | 0 | 11016 | 2 |
| D | 0 | 22540 | 2 |
| Mode M9 | |||
|---|---|---|---|
| Quadrant | BADHDUFLAG | Total packets | Discarded packets |
| A | 0 | 27 | 0 |
| B | 0 | 28 | 0 |
| C | 0 | 28 | 0 |
| D | 0 | 28 | 0 |
| Mode SS | |||
|---|---|---|---|
| Quadrant | BADHDUFLAG | Total packets | Discarded packets |
| A | 0 | 100 | 0 |
| B | 0 | 100 | 0 |
| C | 0 | 100 | 0 |
| D | 0 | 100 | 0 |
| Quadrant | Total seconds | Saturated seconds | Saturation percentage |
|---|---|---|---|
| A | 4872 | 11 | 0.225780% |
| B | 4872 | 86 | 1.765189% |
| C | 4871 | 39 | 0.800657% |
| D | 4871 | 1554 | 31.903100% |
Noise dominated data is calculated using 1-second bins in cleaned event files. If a bin has >2000 counts, and if more than 50% of those come from <1% of pixels, then it is considered to be noise-dominated and hence unusable.
| Quadrant | # 1 sec bins | Bins with >0 counts | Bins with >2000 counts | High rate bins dominated by noise | Noise dominated (total time) | Noise dominated (detector-on time) | Marked lightcurve |
|---|---|---|---|---|---|---|---|
| A | 7025 | 4873 | 4 | 4 | 0.06% | 0.08% | 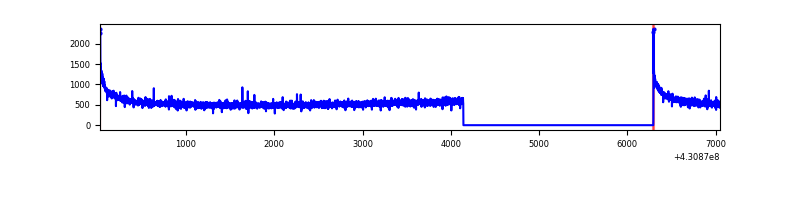 |
| B | 7025 | 4873 | 66 | 66 | 0.94% | 1.35% | 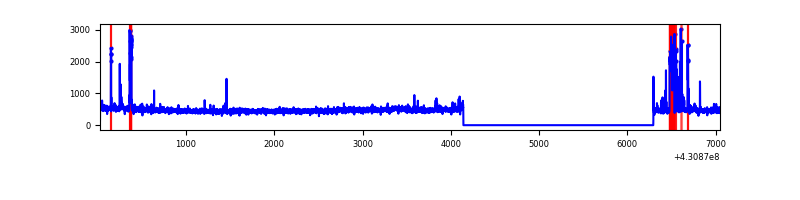 |
| C | 7024 | 4872 | 38 | 38 | 0.54% | 0.78% | 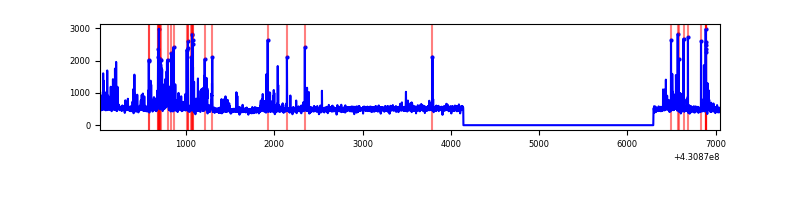 |
| D | 7024 | 4871 | 1494 | 1494 | 21.27% | 30.67% | 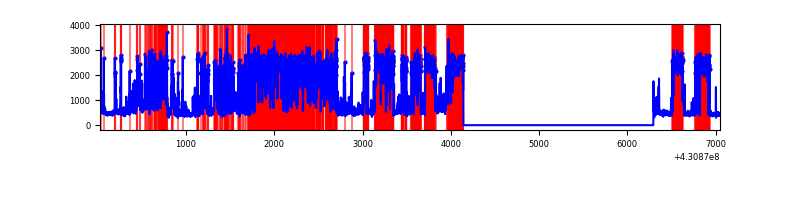 |
Top three noisy pixels from each quadrant. If the there are fewer than three noisy pixels in the level2.evt file, extra rows are filled as -1
| Pixel properties | Quadrant properties | ||||||
|---|---|---|---|---|---|---|---|
| Quadrant | DetID | PixID | Counts | Sigma | Mean | Median | Sigma |
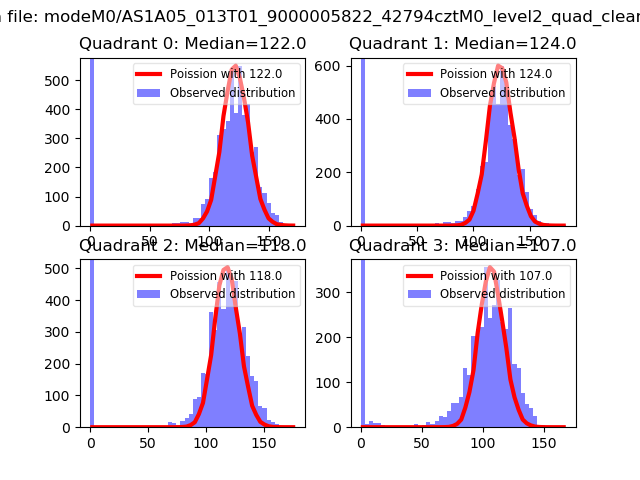
| A | 10 | 83 | 509811 | 4422.87 | 565 | 554 | 115.1 |
| A | 3 | 137 | 6063 | 47.85 | 565 | 554 | 115.1 |
| A | 13 | 254 | 5496 | 42.92 | 565 | 554 | 115.1 |
| B | 0 | 229 | 204647 | 1892.12 | 557 | 542 | 107.9 |
| B | 12 | 0 | 41696 | 381.51 | 557 | 542 | 107.9 |
| B | 5 | 255 | 28071 | 255.2 | 557 | 542 | 107.9 |
| C | 14 | 254 | 388930 | 3045.87 | 550 | 554 | 127.5 |
| C | 15 | 214 | 211087 | 1651.12 | 550 | 554 | 127.5 |
| C | 3 | 233 | 5906 | 41.97 | 550 | 554 | 127.5 |
| D | 2 | 249 | 4502362 | 39032.5 | 466 | 452 | 115.3 |
| D | 1 | 52 | 83088 | 716.47 | 466 | 452 | 115.3 |
| D | 5 | 70 | 22254 | 189.03 | 466 | 452 | 115.3 |
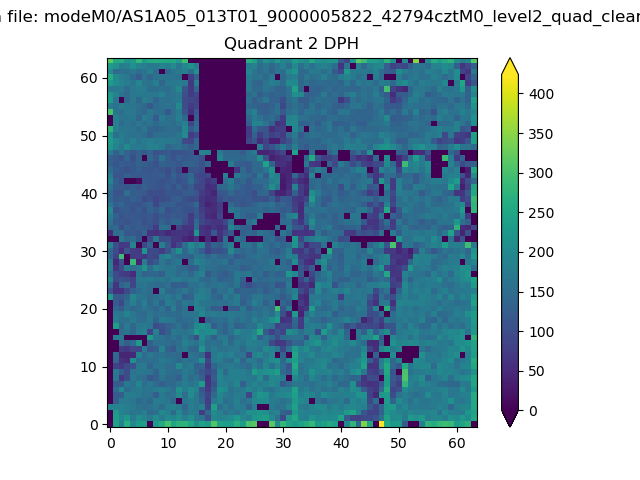
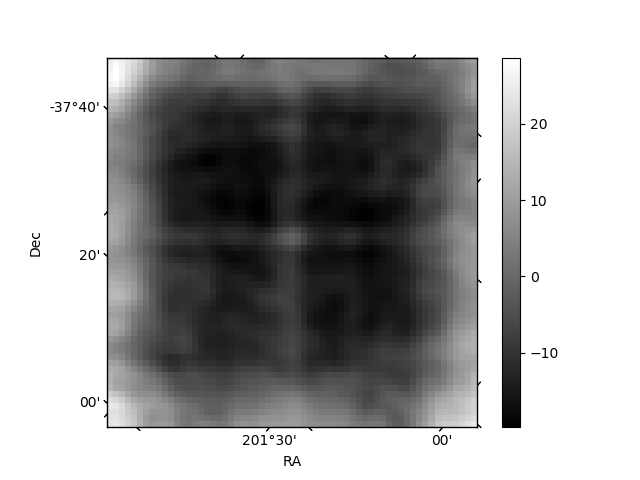
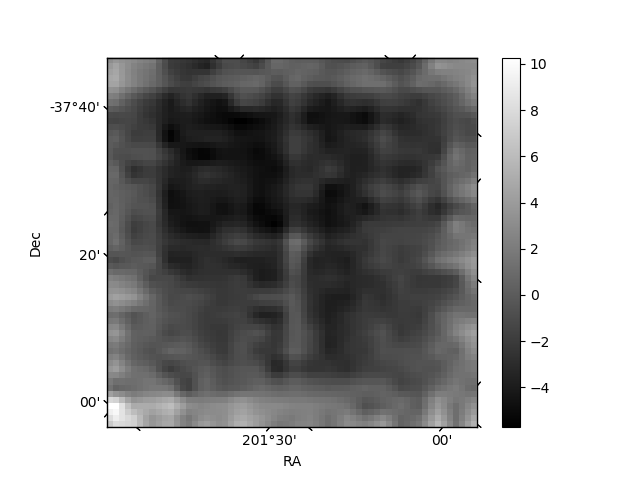
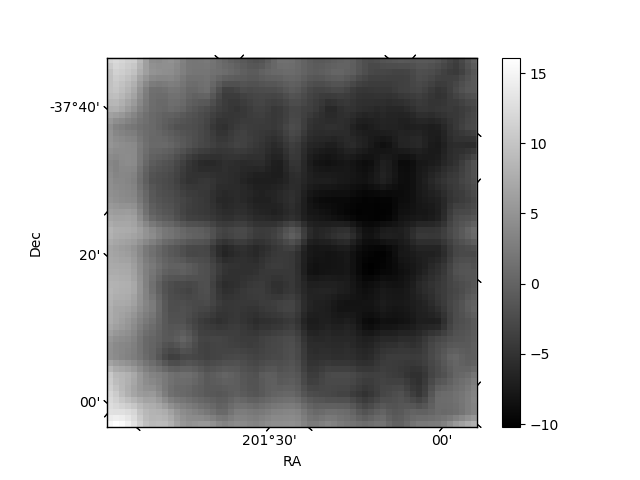
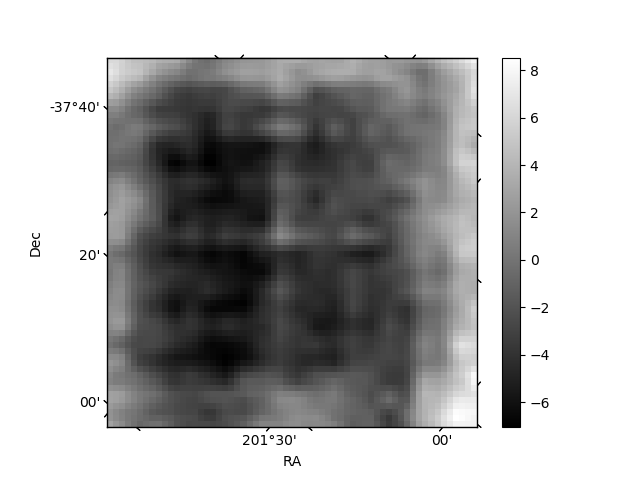
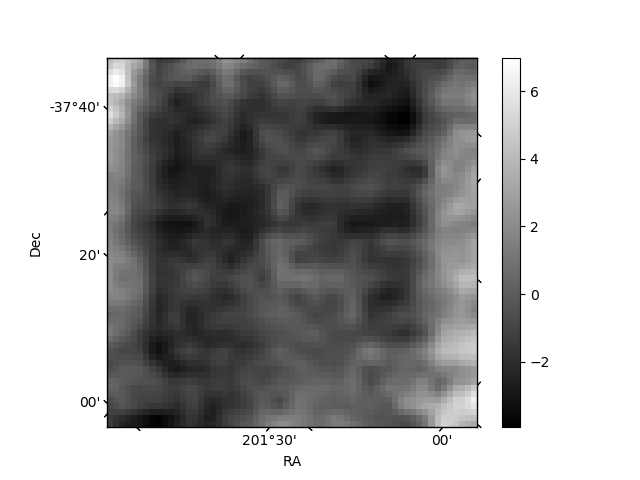
Histogram calculated using DETX and DETY for each event in the final _common_clean file
| Quadrant A | 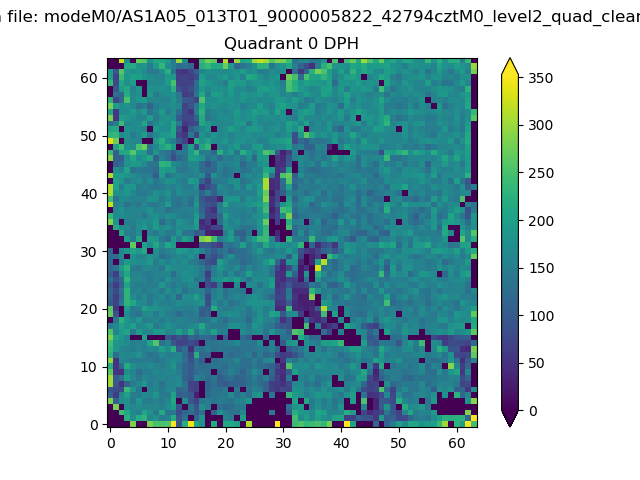 |
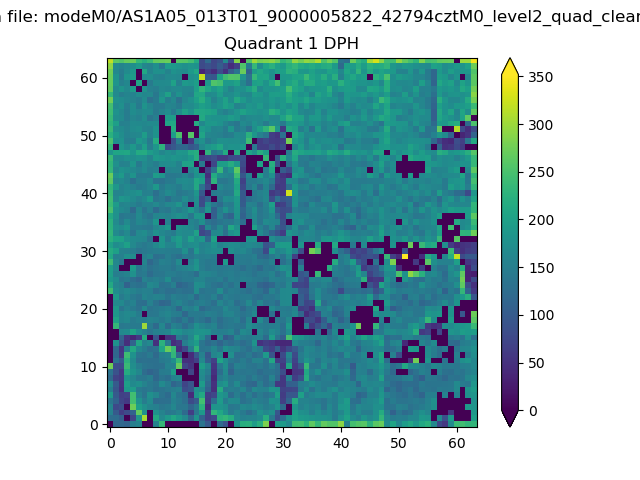 |
Quadrant B |
|---|---|---|---|
| Quadrant D | 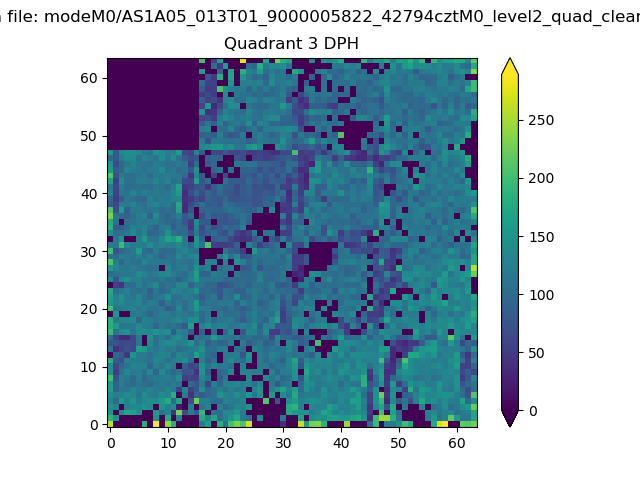 |
 |
Quadrant C |
| Plot type | Count rate plots | Images |
|---|---|---|
| Comparison with Poisson distribution Blue bars denote a histogram of data divided into 1 sec bins. Red curve is a Poisson curve with rate = median count rate of data. |
 |
 |
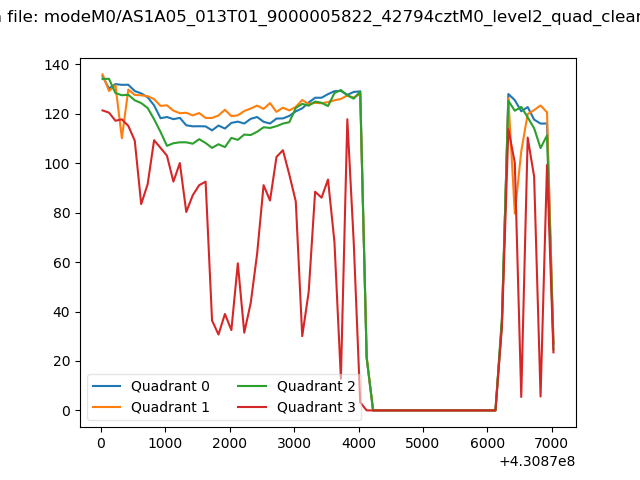
| Quadrant-wise count rates Data is divided into 100 sec bins |
 |
|
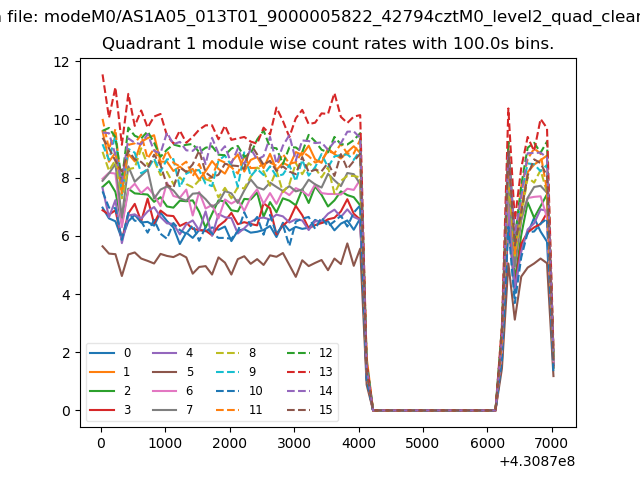
| Module-wise count rates for Quadrant A Data is divided into 100 sec bins |
 |
 |
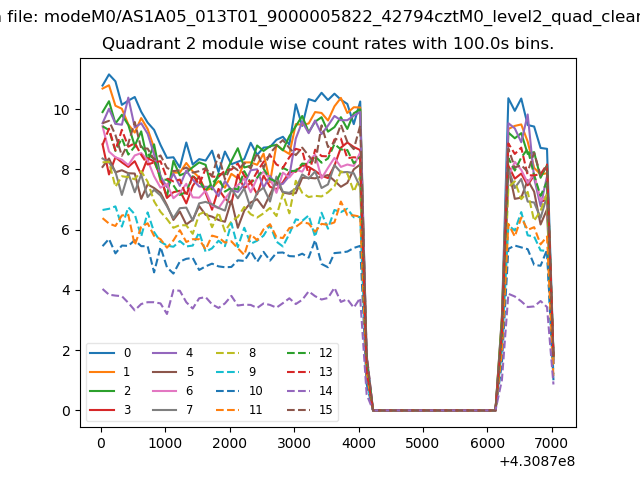
| Module-wise count rates for Quadrant B Data is divided into 100 sec bins |
 |
 |
| Module-wise count rates for Quadrant C Data is divided into 100 sec bins |
 |
 |
| Module-wise count rates for Quadrant D Data is divided into 100 sec bins |
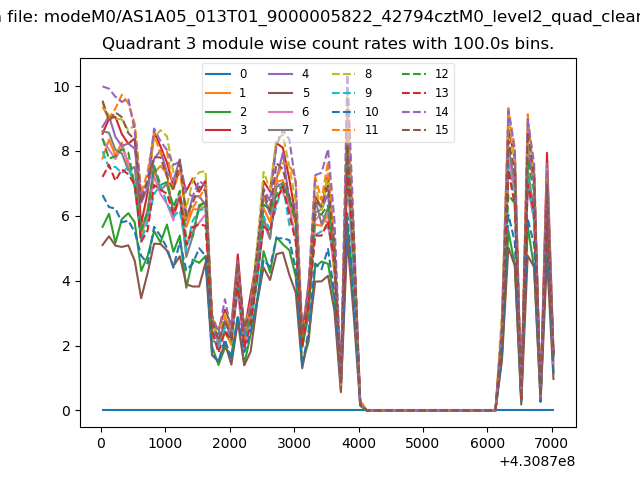 |
 |
| Parameter | Plot |
|---|---|
| CZT HV Monitor | 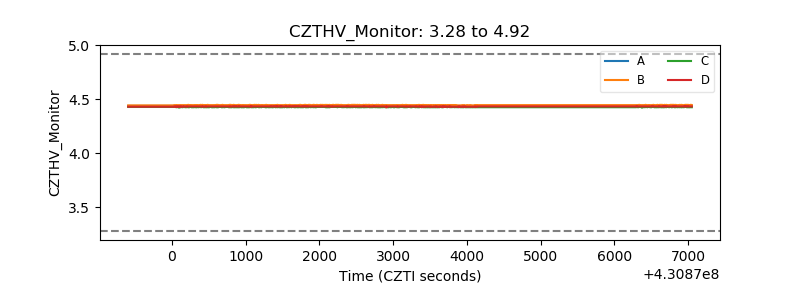 |
| D_VDD | 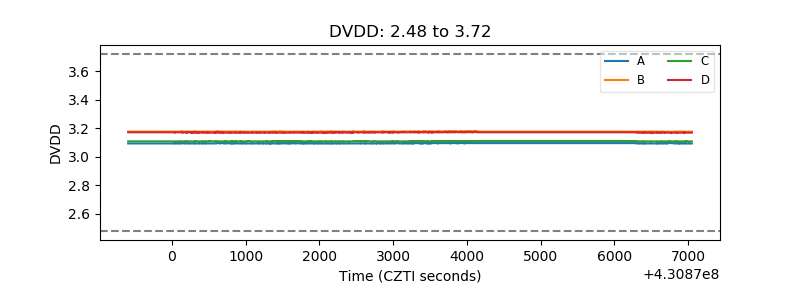 |
| Temperature 1 | 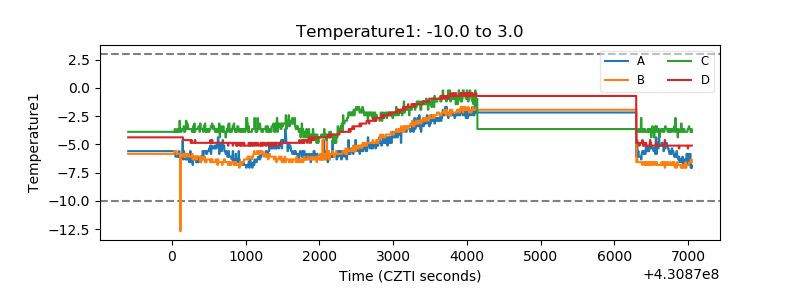 |
| Veto HV Monitor | 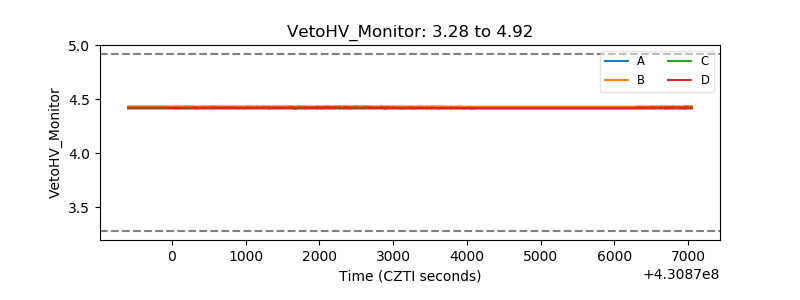 |
| Veto LLD | 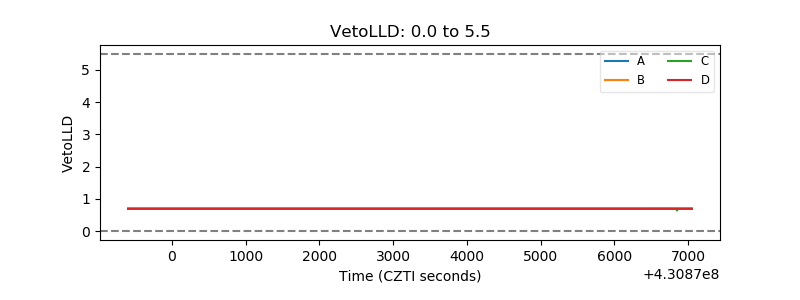 |
| Alpha Counter | 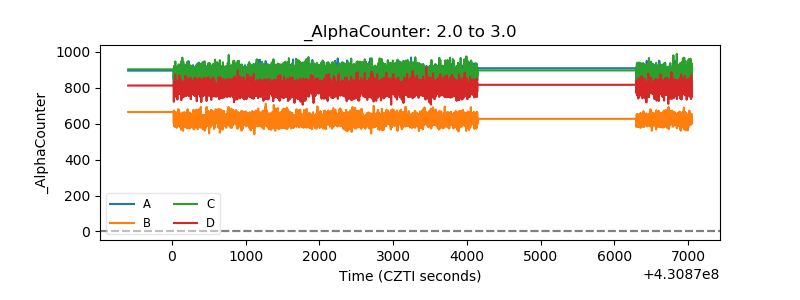 |
| _CPM_Rate | 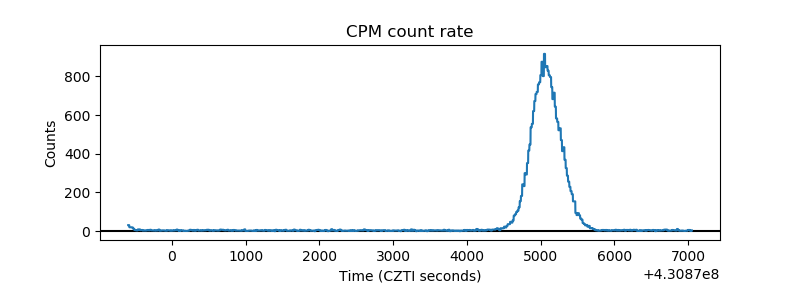 |
| CZT Counter | 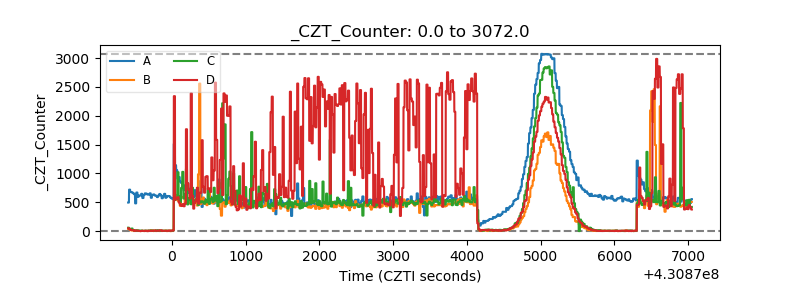 |
| +2.5 Volts monitor | 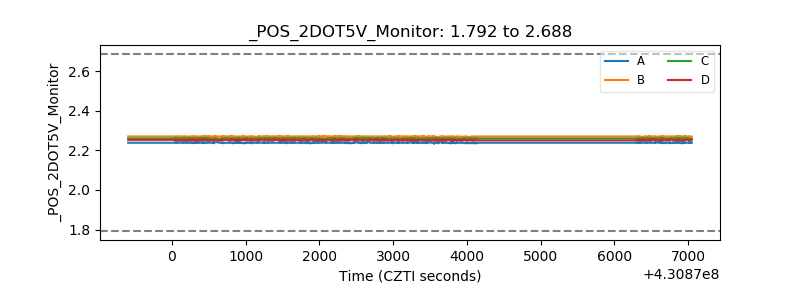 |
| +5 Volts monitor | 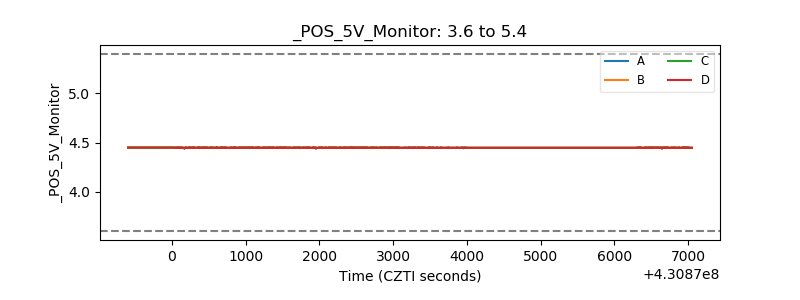 |
| _ROLL_ROT | 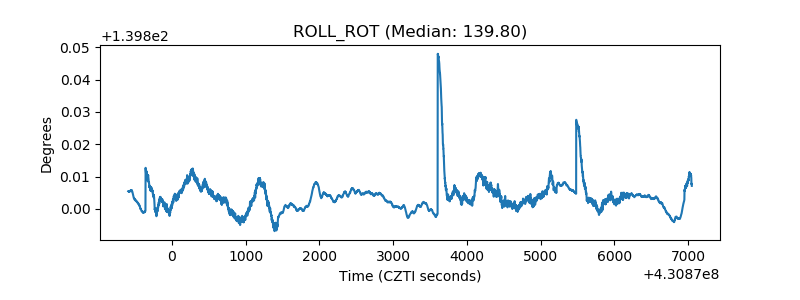 |
| _Roll_DEC | 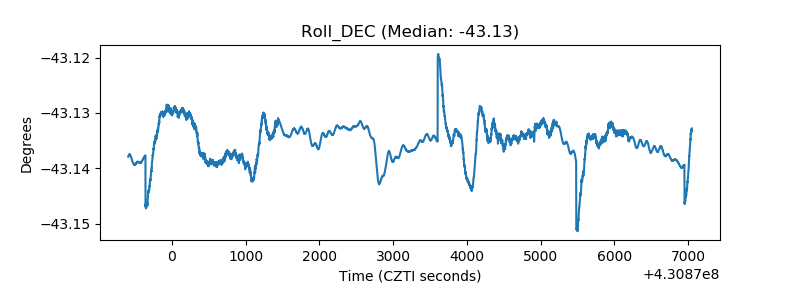 |
| _Roll_RA | 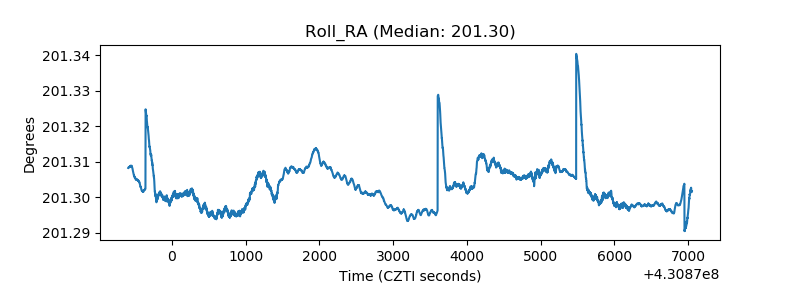 |
| Veto Counter | 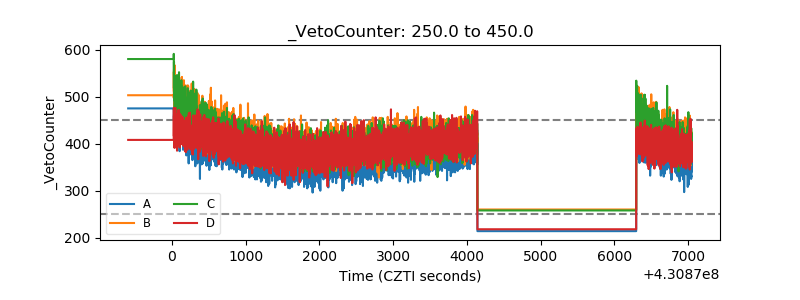 |