| Param | Original file | Final file |
|---|---|---|
| Filename | modeM0/AS1A05_013T01_9000005822_42795cztM0_level2.fits | modeM0/AS1A05_013T01_9000005822_42795cztM0_level2_quad_clean.evt |
| Size (bytes) | 417,332,160 | 78,583,680 |
| Size | 398.0 MB | 74.9 MB |
| Events in quadrant A | 2,740,814 | 581,873 |
| Events in quadrant B | 2,915,574 | 578,160 |
| Events in quadrant C | 2,578,879 | 564,907 |
| Events in quadrant D | 6,824,300 | 305,076 |
| Mode M0 | |||
|---|---|---|---|
| Quadrant | BADHDUFLAG | Total packets | Discarded packets |
| A | 0 | 10965 | 2 |
| B | 0 | 11969 | 2 |
| C | 0 | 10588 | 2 |
| D | 0 | 23713 | 2 |
| Mode M9 | |||
|---|---|---|---|
| Quadrant | BADHDUFLAG | Total packets | Discarded packets |
| A | 0 | 33 | 0 |
| B | 0 | 34 | 0 |
| C | 0 | 34 | 0 |
| D | 0 | 34 | 0 |
| Mode SS | |||
|---|---|---|---|
| Quadrant | BADHDUFLAG | Total packets | Discarded packets |
| A | 0 | 102 | 0 |
| B | 0 | 102 | 0 |
| C | 0 | 102 | 0 |
| D | 0 | 102 | 0 |
| Quadrant | Total seconds | Saturated seconds | Saturation percentage |
|---|---|---|---|
| A | 4985 | 10 | 0.200602% |
| B | 4985 | 197 | 3.951856% |
| C | 4985 | 29 | 0.581745% |
| D | 4985 | 2128 | 42.688064% |
Noise dominated data is calculated using 1-second bins in cleaned event files. If a bin has >2000 counts, and if more than 50% of those come from <1% of pixels, then it is considered to be noise-dominated and hence unusable.
| Quadrant | # 1 sec bins | Bins with >0 counts | Bins with >2000 counts | High rate bins dominated by noise | Noise dominated (total time) | Noise dominated (detector-on time) | Marked lightcurve |
|---|---|---|---|---|---|---|---|
| A | 7078 | 4986 | 4 | 4 | 0.06% | 0.08% | 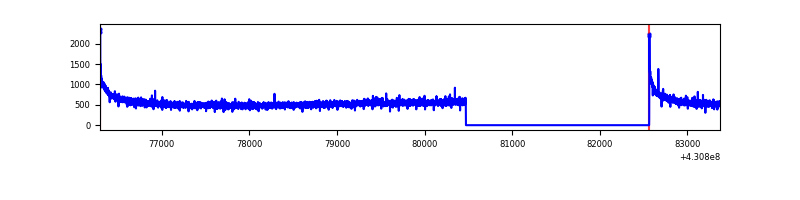 |
| B | 7078 | 4986 | 159 | 159 | 2.25% | 3.19% | 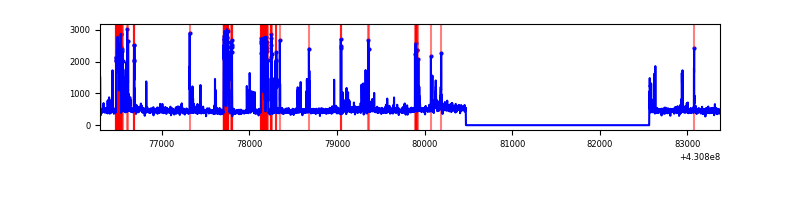 |
| C | 7078 | 4986 | 23 | 23 | 0.32% | 0.46% | 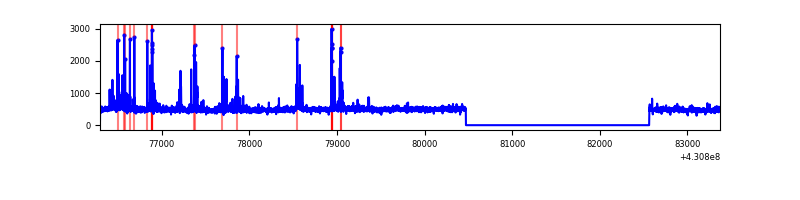 |
| D | 7078 | 4985 | 2031 | 2031 | 28.69% | 40.74% | 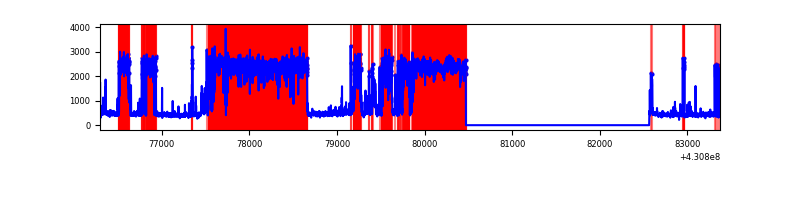 |
Top three noisy pixels from each quadrant. If the there are fewer than three noisy pixels in the level2.evt file, extra rows are filled as -1
| Pixel properties | Quadrant properties | ||||||
|---|---|---|---|---|---|---|---|
| Quadrant | DetID | PixID | Counts | Sigma | Mean | Median | Sigma |
| A | 10 | 83 | 527171 | 4562.65 | 567 | 556 | 115.4 |
| A | 13 | 6 | 7241 | 57.92 | 567 | 556 | 115.4 |
| A | 13 | 248 | 7047 | 56.24 | 567 | 556 | 115.4 |
| B | 0 | 229 | 521797 | 4834.73 | 554 | 540 | 107.8 |
| B | 5 | 255 | 106935 | 986.83 | 554 | 540 | 107.8 |
| B | 0 | 245 | 34867 | 318.39 | 554 | 540 | 107.8 |
| C | 15 | 214 | 214126 | 1658.77 | 553 | 556 | 128.8 |
| C | 14 | 254 | 197305 | 1528.13 | 553 | 556 | 128.8 |
| C | 8 | 79 | 7617 | 54.84 | 553 | 556 | 128.8 |
| D | 2 | 249 | 4911489 | 47993.39 | 416 | 404 | 102.3 |
| D | 12 | 233 | 139207 | 1356.45 | 416 | 404 | 102.3 |
| D | 12 | 6 | 47682 | 462.02 | 416 | 404 | 102.3 |
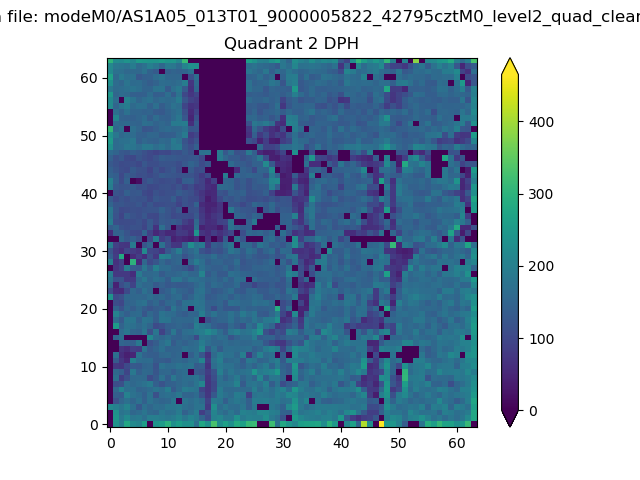
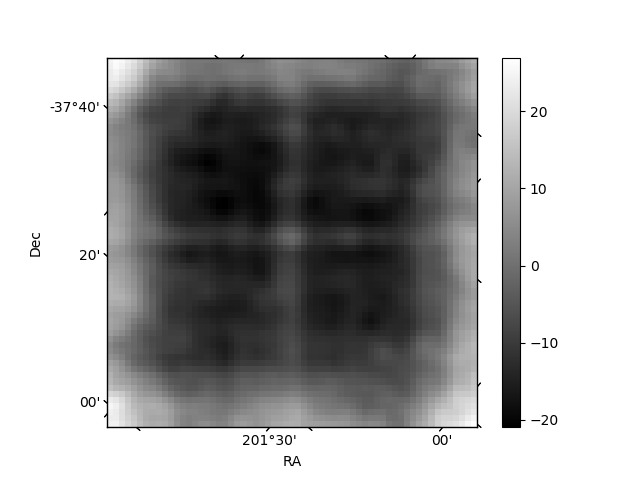
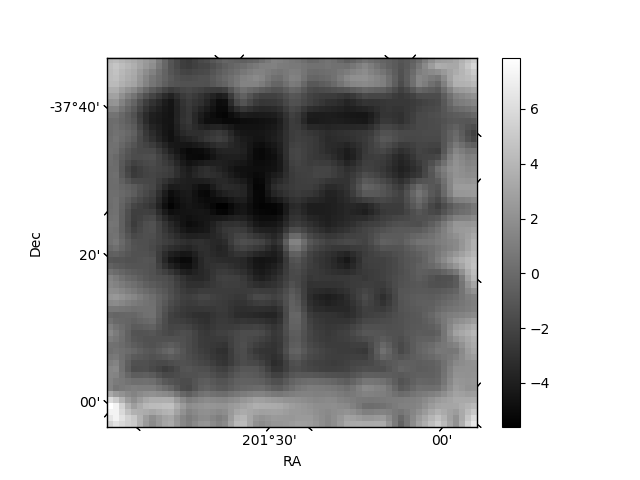
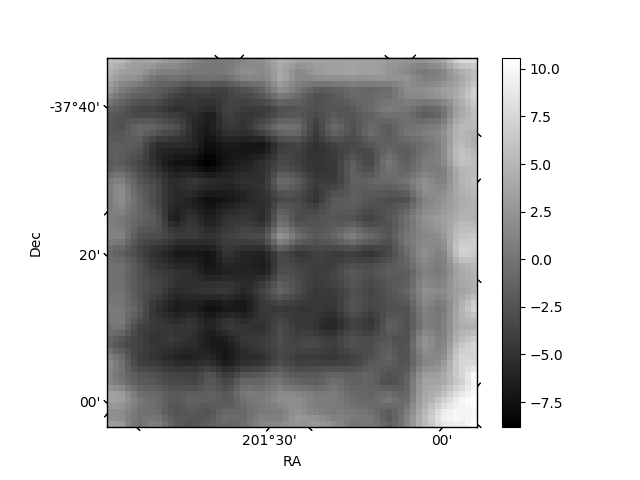
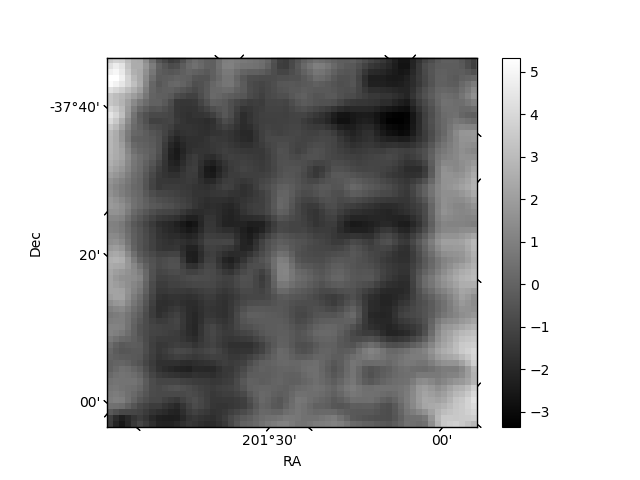
Histogram calculated using DETX and DETY for each event in the final _common_clean file
| Quadrant A | 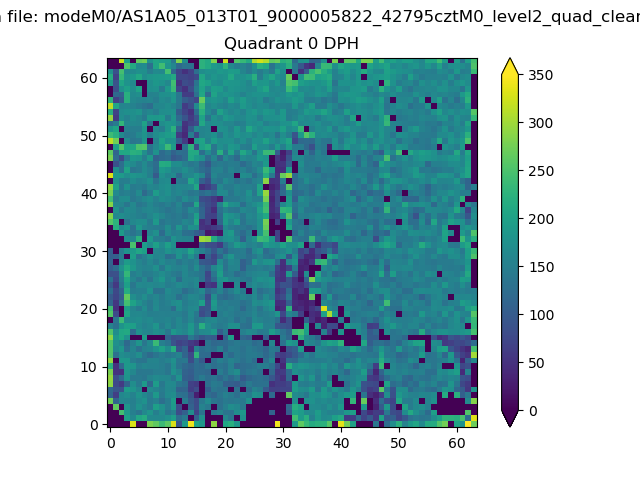 |
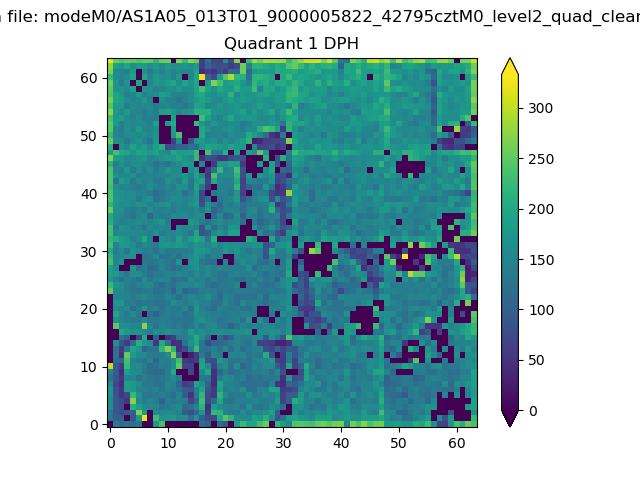 |
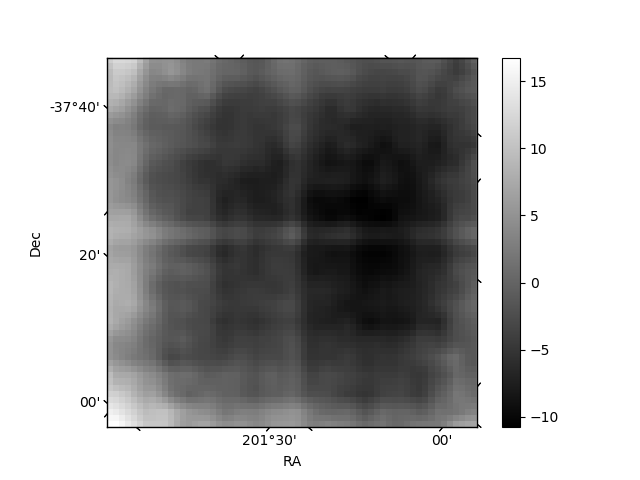
Quadrant B |
|---|---|---|---|
| Quadrant D | 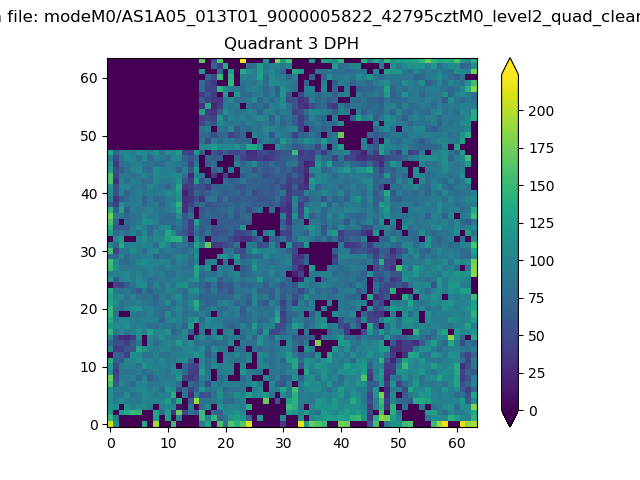 |
 |
Quadrant C |
| Plot type | Count rate plots | Images |
|---|---|---|
| Comparison with Poisson distribution Blue bars denote a histogram of data divided into 1 sec bins. Red curve is a Poisson curve with rate = median count rate of data. |
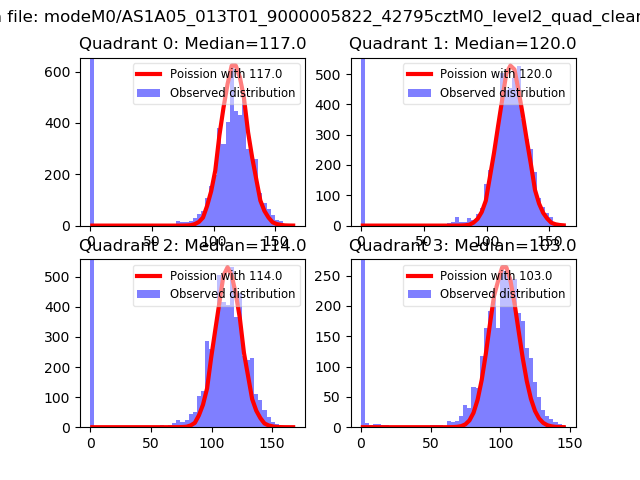 |
 |
| Quadrant-wise count rates Data is divided into 100 sec bins |
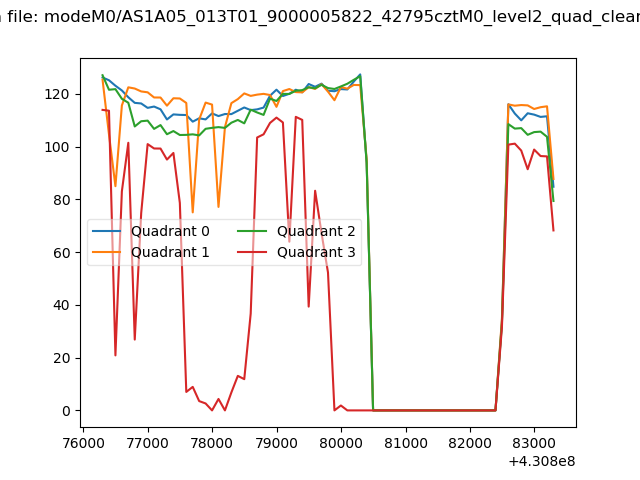 |
|
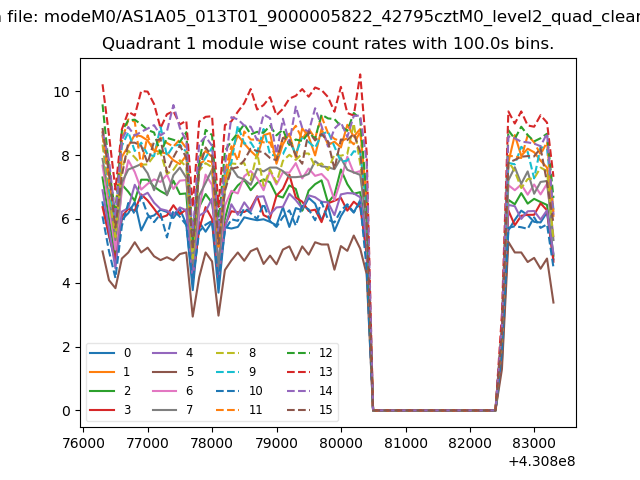
| Module-wise count rates for Quadrant A Data is divided into 100 sec bins |
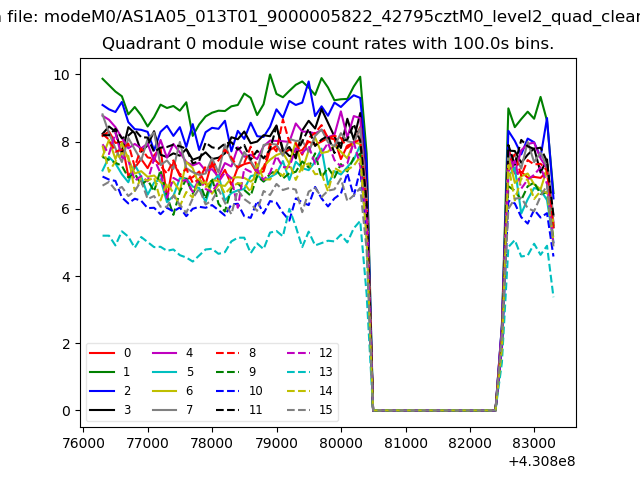 |
 |
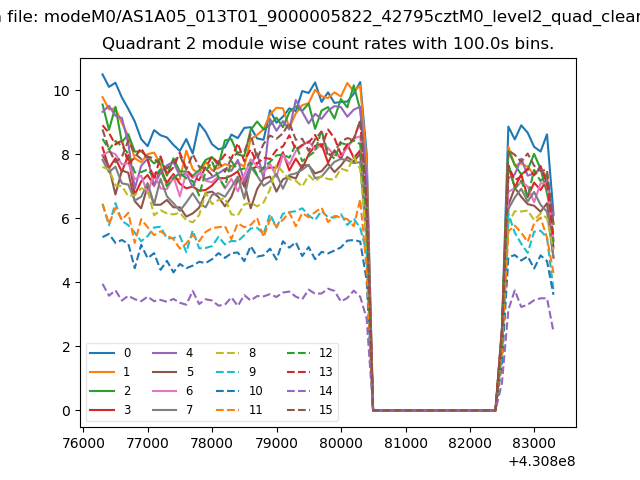
| Module-wise count rates for Quadrant B Data is divided into 100 sec bins |
 |
 |
| Module-wise count rates for Quadrant C Data is divided into 100 sec bins |
 |
 |
| Module-wise count rates for Quadrant D Data is divided into 100 sec bins |
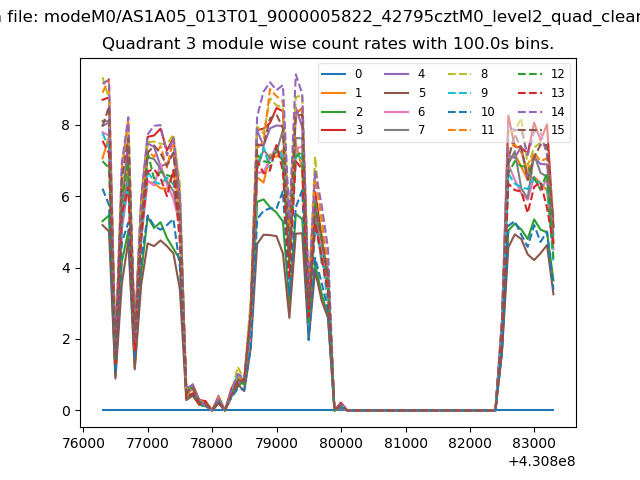 |
 |
| Parameter | Plot |
|---|---|
| CZT HV Monitor | 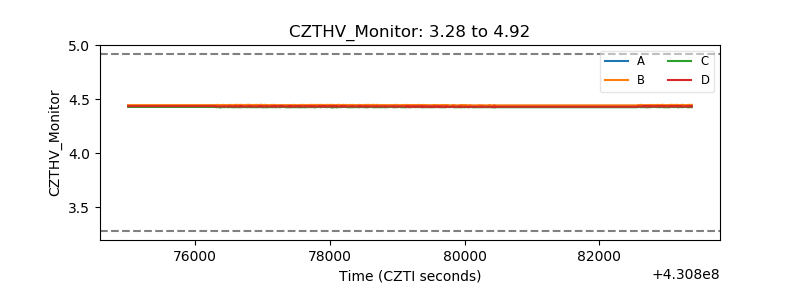 |
| D_VDD | 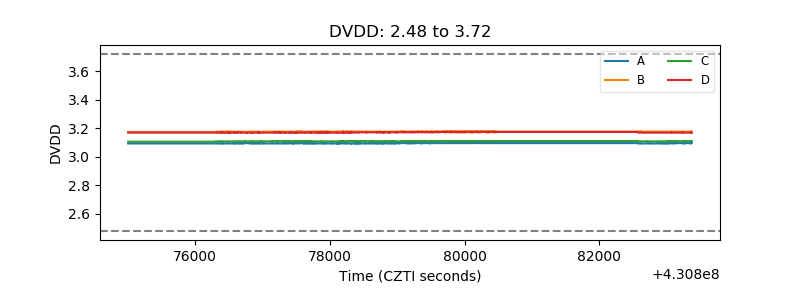 |
| Temperature 1 | 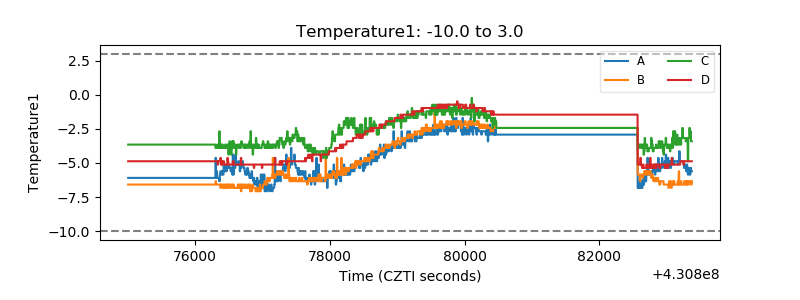 |
| Veto HV Monitor | 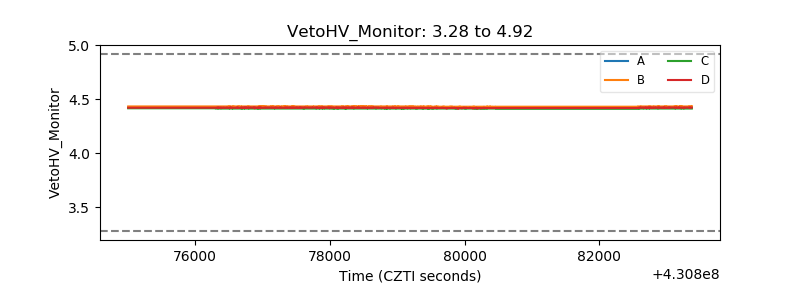 |
| Veto LLD | 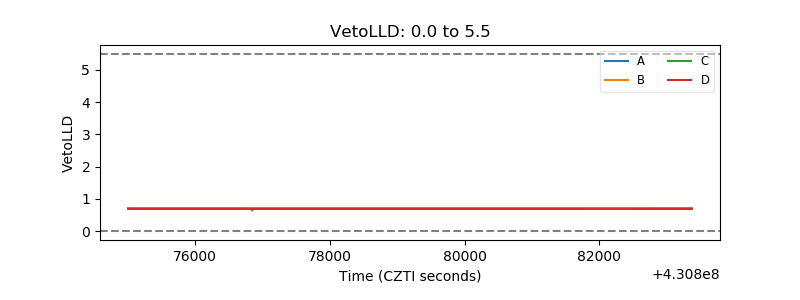 |
| Alpha Counter | 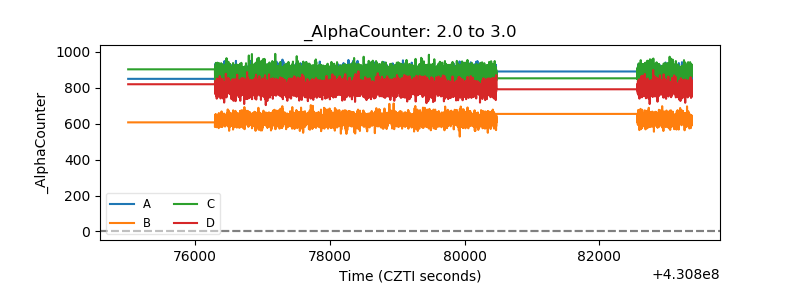 |
| _CPM_Rate |  |
| CZT Counter | 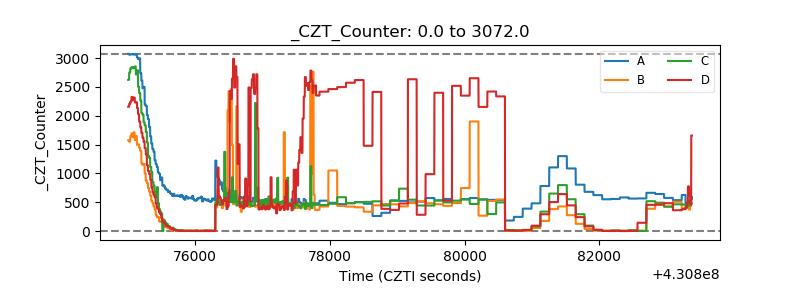 |
| +2.5 Volts monitor | 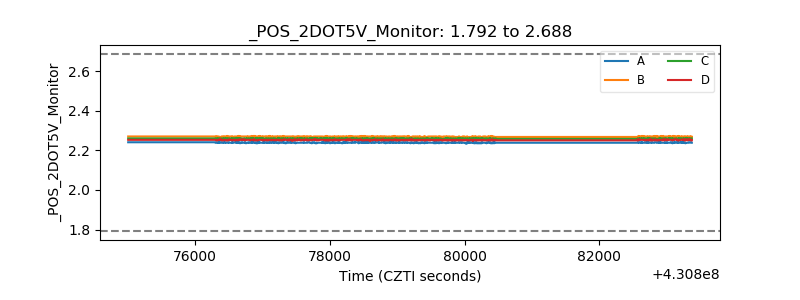 |
| +5 Volts monitor | 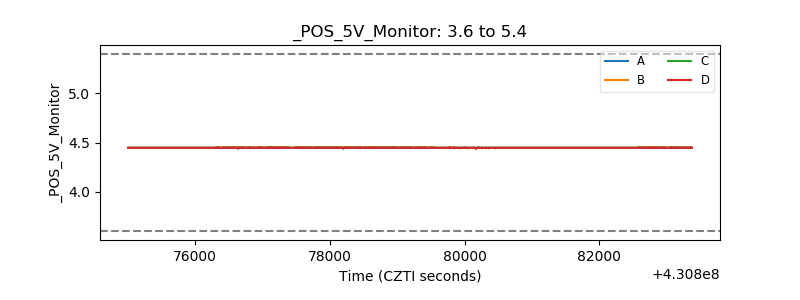 |
| _ROLL_ROT | 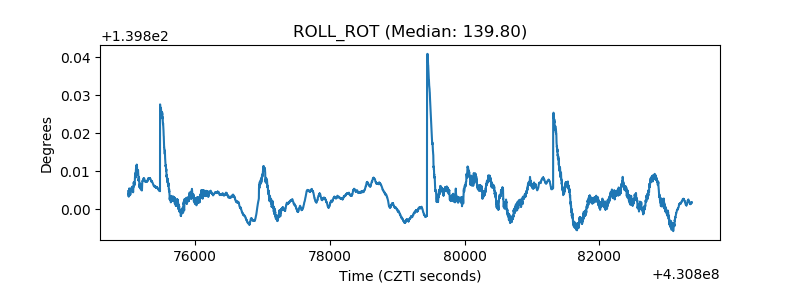 |
| _Roll_DEC | 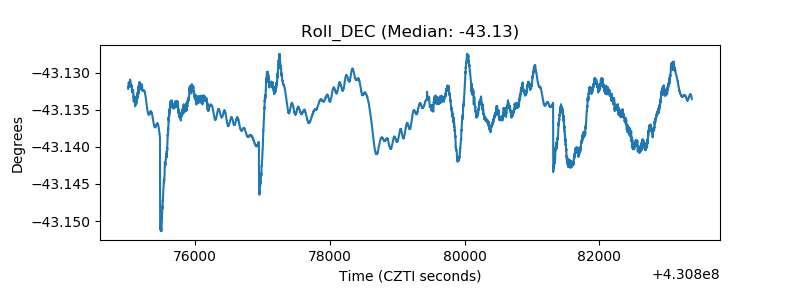 |
| _Roll_RA | 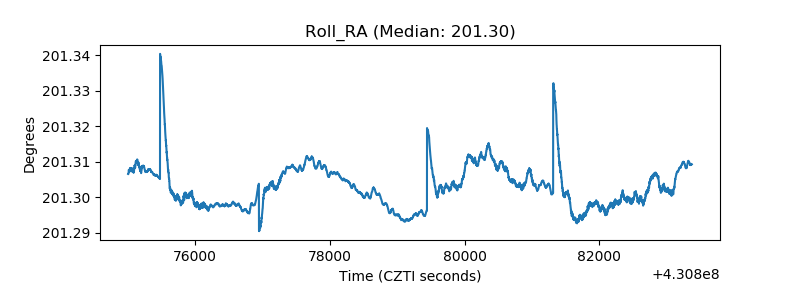 |
| Veto Counter | 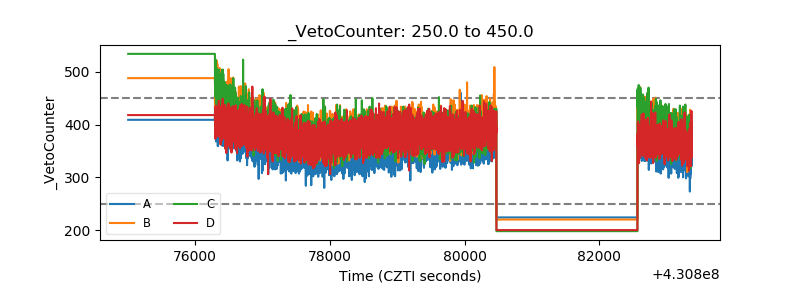 |