| Param | Original file | Final file |
|---|---|---|
| Filename | modeM0/AS1A05_013T01_9000005822_42796cztM0_level2.fits | modeM0/AS1A05_013T01_9000005822_42796cztM0_level2_quad_clean.evt |
| Size (bytes) | 300,087,360 | 86,771,520 |
| Size | 286.2 MB | 82.8 MB |
| Events in quadrant A | 2,820,495 | 583,910 |
| Events in quadrant B | 2,566,556 | 591,811 |
| Events in quadrant C | 2,528,773 | 569,774 |
| Events in quadrant D | 2,790,840 | 521,032 |
| Mode M0 | |||
|---|---|---|---|
| Quadrant | BADHDUFLAG | Total packets | Discarded packets |
| A | 0 | 11262 | 2 |
| B | 0 | 10945 | 2 |
| C | 0 | 10638 | 2 |
| D | 0 | 11845 | 2 |
| Mode M9 | |||
|---|---|---|---|
| Quadrant | BADHDUFLAG | Total packets | Discarded packets |
| A | 0 | 23 | 0 |
| B | 0 | 24 | 0 |
| C | 0 | 24 | 0 |
| D | 0 | 24 | 0 |
| Mode SS | |||
|---|---|---|---|
| Quadrant | BADHDUFLAG | Total packets | Discarded packets |
| A | 0 | 106 | 0 |
| B | 0 | 106 | 0 |
| C | 0 | 106 | 0 |
| D | 0 | 106 | 0 |
| Quadrant | Total seconds | Saturated seconds | Saturation percentage |
|---|---|---|---|
| A | 5150 | 13 | 0.252427% |
| B | 5150 | 30 | 0.582524% |
| C | 5150 | 4 | 0.077670% |
| D | 5150 | 62 | 1.203883% |
Noise dominated data is calculated using 1-second bins in cleaned event files. If a bin has >2000 counts, and if more than 50% of those come from <1% of pixels, then it is considered to be noise-dominated and hence unusable.
| Quadrant | # 1 sec bins | Bins with >0 counts | Bins with >2000 counts | High rate bins dominated by noise | Noise dominated (total time) | Noise dominated (detector-on time) | Marked lightcurve |
|---|---|---|---|---|---|---|---|
| A | 7003 | 5151 | 6 | 6 | 0.09% | 0.12% | 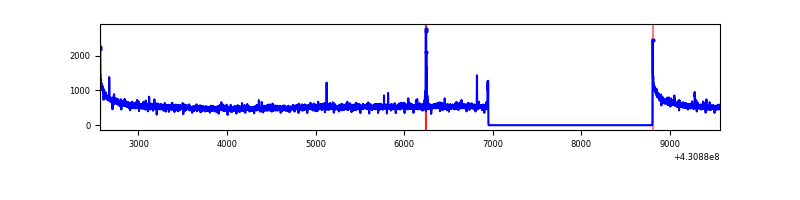 |
| B | 7003 | 5151 | 20 | 20 | 0.29% | 0.39% | 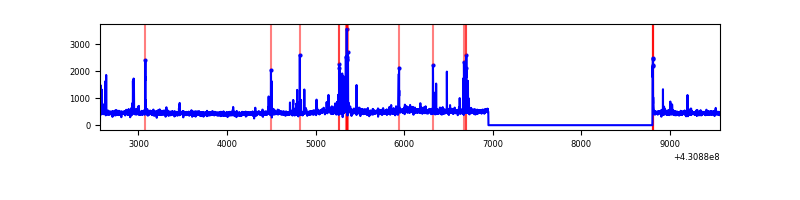 |
| C | 7003 | 5151 | 2 | 2 | 0.03% | 0.04% | 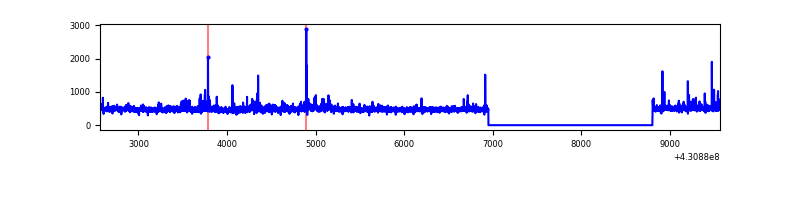 |
| D | 7003 | 5151 | 59 | 59 | 0.84% | 1.15% | 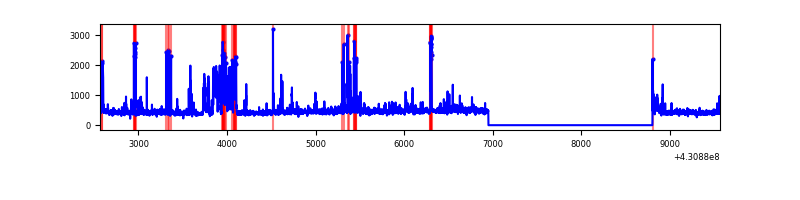 |
Top three noisy pixels from each quadrant. If the there are fewer than three noisy pixels in the level2.evt file, extra rows are filled as -1
| Pixel properties | Quadrant properties | ||||||
|---|---|---|---|---|---|---|---|
| Quadrant | DetID | PixID | Counts | Sigma | Mean | Median | Sigma |
| A | 10 | 83 | 554467 | 4699.98 | 575 | 563 | 117.9 |
| A | 15 | 223 | 21631 | 178.77 | 575 | 563 | 117.9 |
| A | 2 | 79 | 7717 | 60.7 | 575 | 563 | 117.9 |
| B | 7 | 202 | 129607 | 1174.54 | 567 | 553 | 109.9 |
| B | 0 | 229 | 58601 | 528.31 | 567 | 553 | 109.9 |
| B | 15 | 85 | 41541 | 373.04 | 567 | 553 | 109.9 |
| C | 15 | 214 | 210861 | 1605.69 | 560 | 564 | 131.0 |
| C | 8 | 79 | 71833 | 544.16 | 560 | 564 | 131.0 |
| C | 14 | 254 | 53050 | 400.75 | 560 | 564 | 131.0 |
| D | 1 | 52 | 339730 | 2490.31 | 558 | 542 | 136.2 |
| D | 12 | 233 | 87430 | 637.93 | 558 | 542 | 136.2 |
| D | 7 | 96 | 77803 | 567.25 | 558 | 542 | 136.2 |
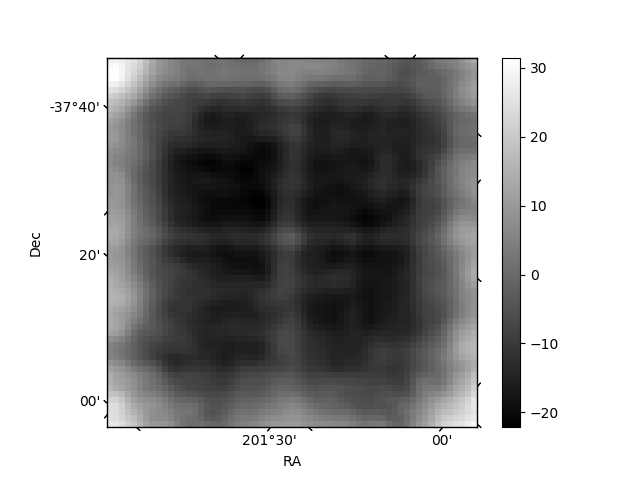
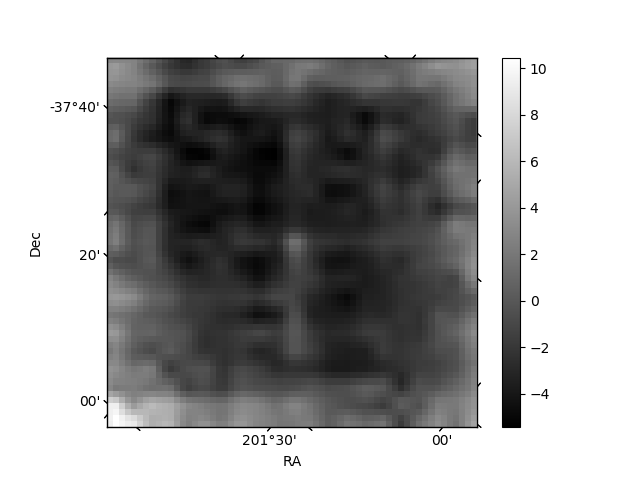
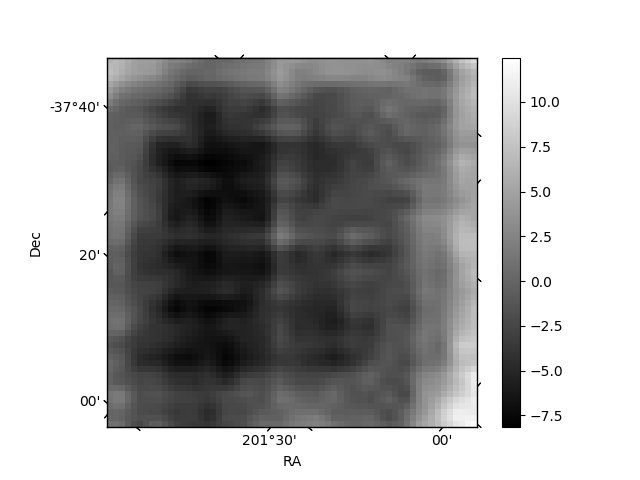
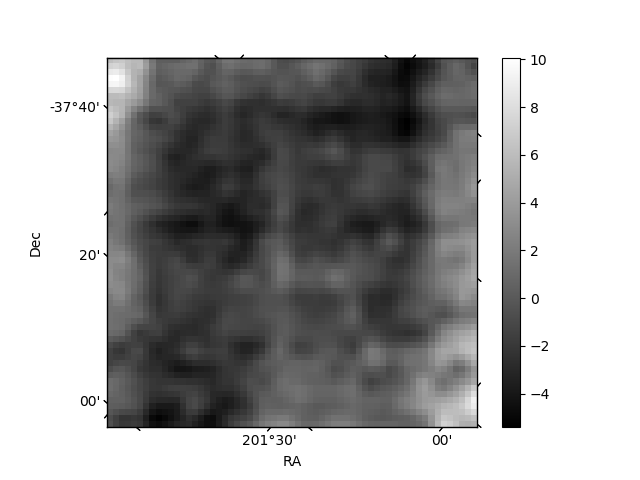
Histogram calculated using DETX and DETY for each event in the final _common_clean file
| Quadrant A | 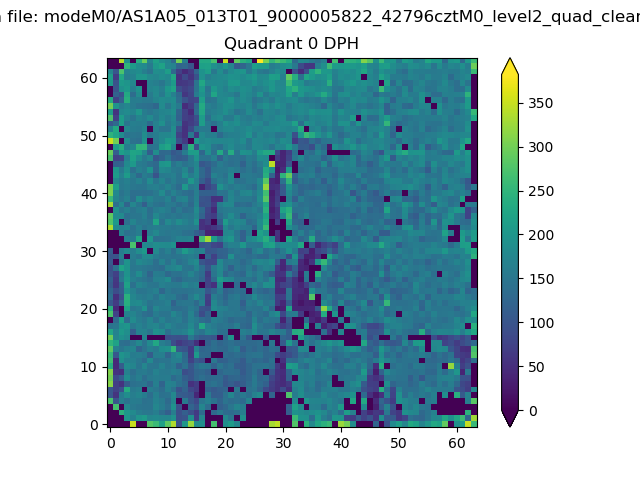 |
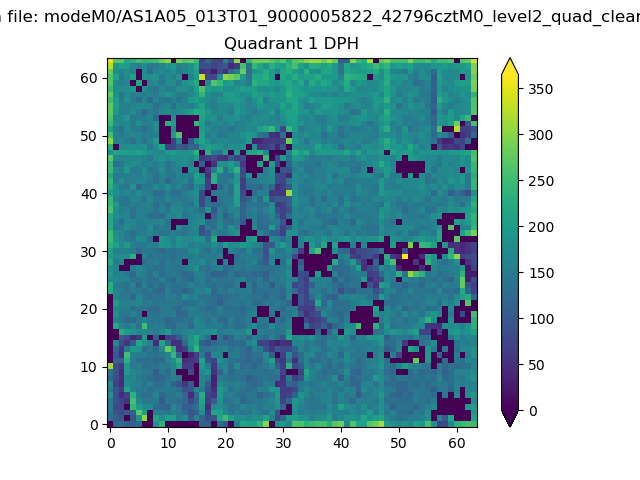 |
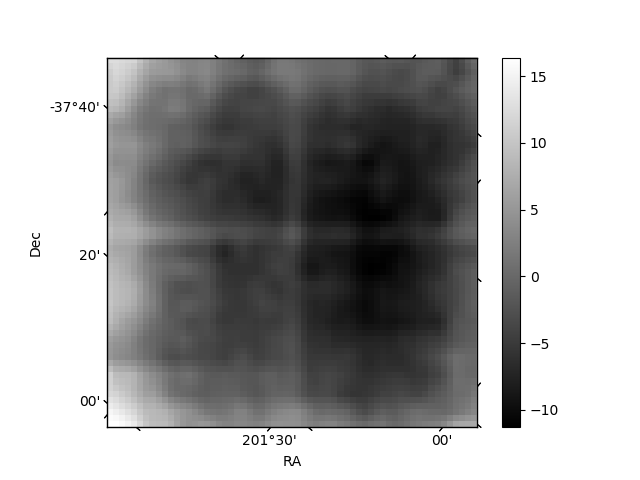
Quadrant B |
|---|---|---|---|
| Quadrant D | 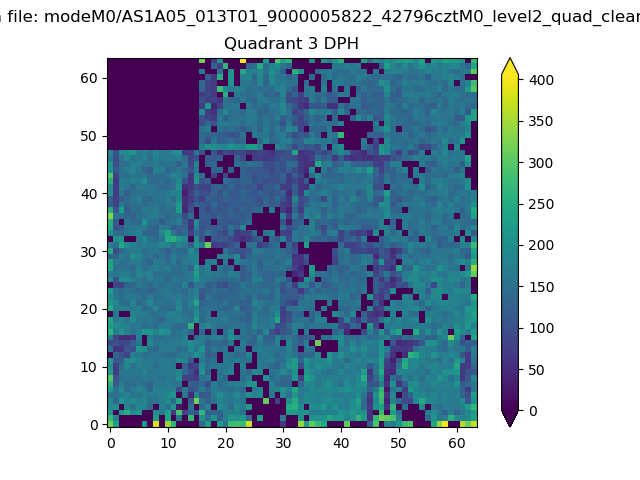 |
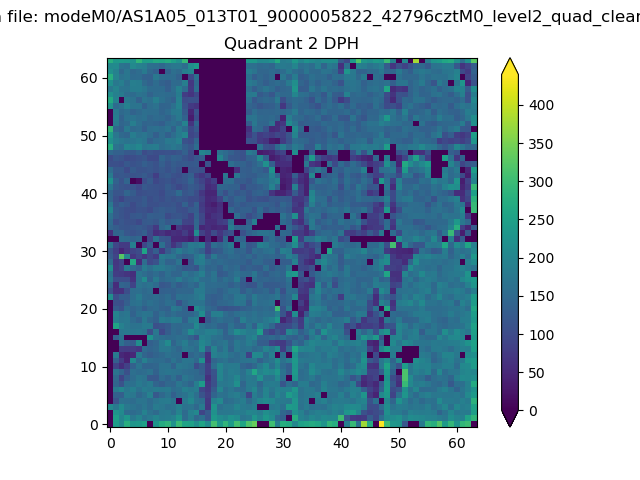 |
Quadrant C |
| Plot type | Count rate plots | Images |
|---|---|---|
| Comparison with Poisson distribution Blue bars denote a histogram of data divided into 1 sec bins. Red curve is a Poisson curve with rate = median count rate of data. |
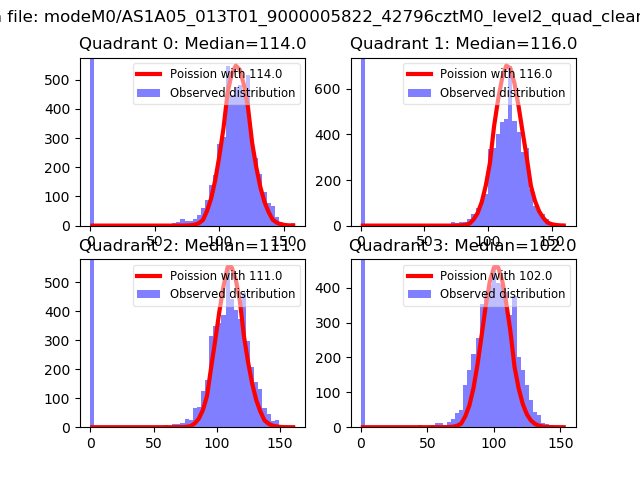 |
 |
| Quadrant-wise count rates Data is divided into 100 sec bins |
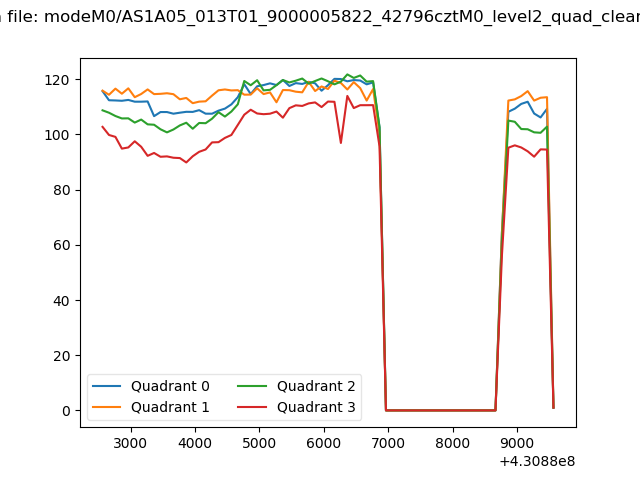 |
|
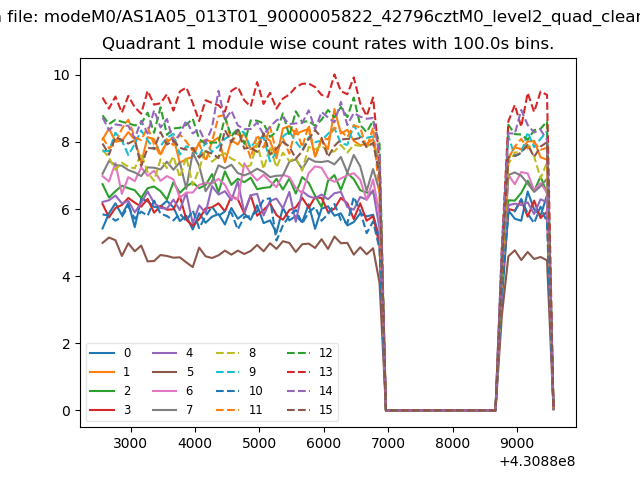
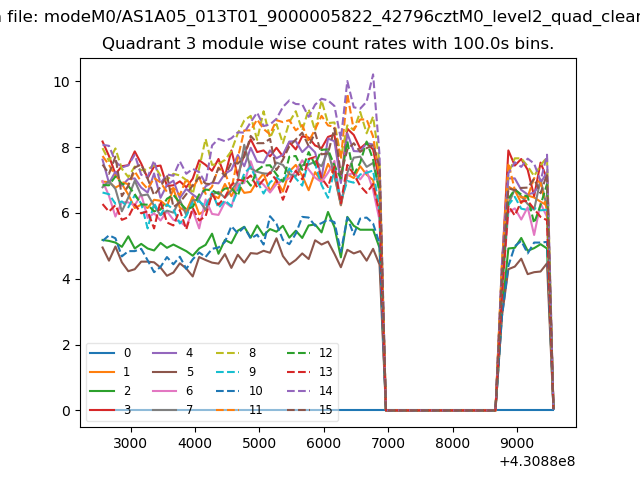
| Module-wise count rates for Quadrant A Data is divided into 100 sec bins |
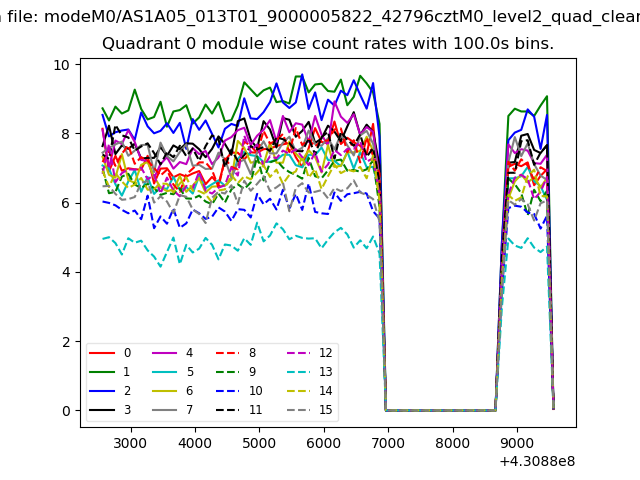 |
 |
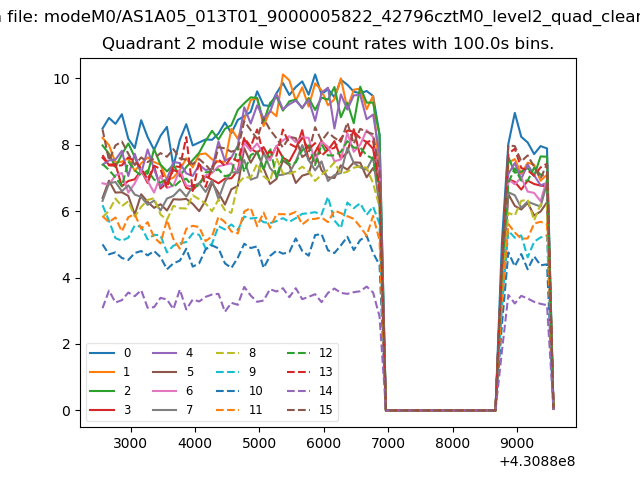
| Module-wise count rates for Quadrant B Data is divided into 100 sec bins |
 |
 |
| Module-wise count rates for Quadrant C Data is divided into 100 sec bins |
 |
 |
| Module-wise count rates for Quadrant D Data is divided into 100 sec bins |
 |
 |
| Parameter | Plot |
|---|---|
| CZT HV Monitor | 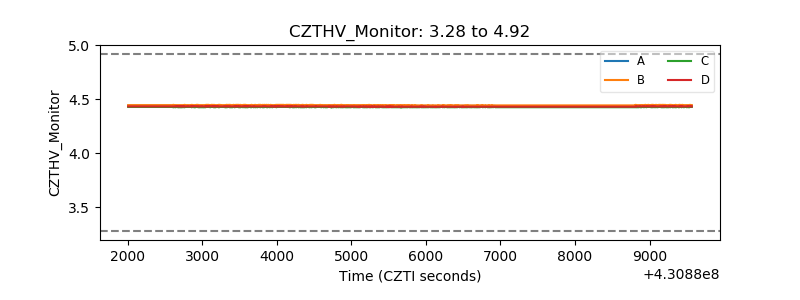 |
| D_VDD | 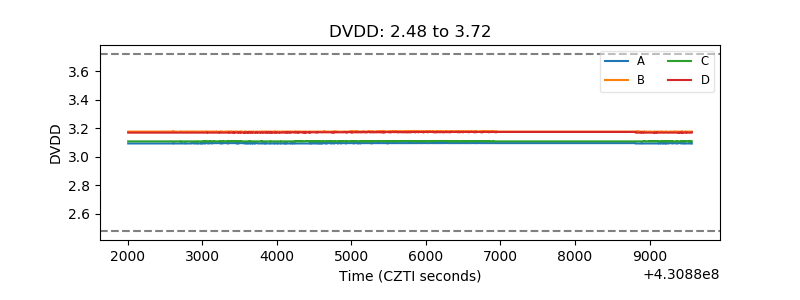 |
| Temperature 1 | 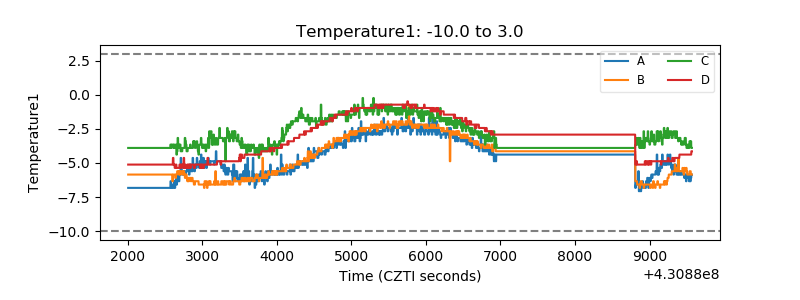 |
| Veto HV Monitor | 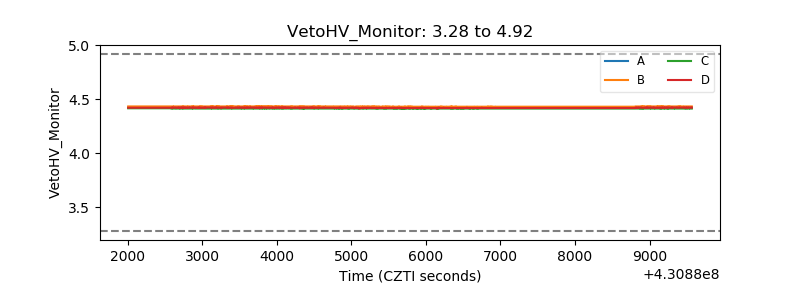 |
| Veto LLD | 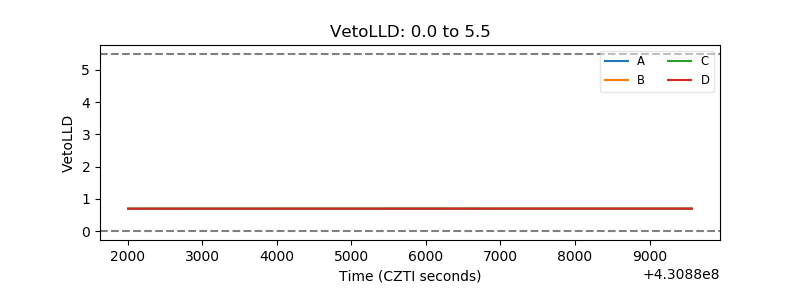 |
| Alpha Counter | 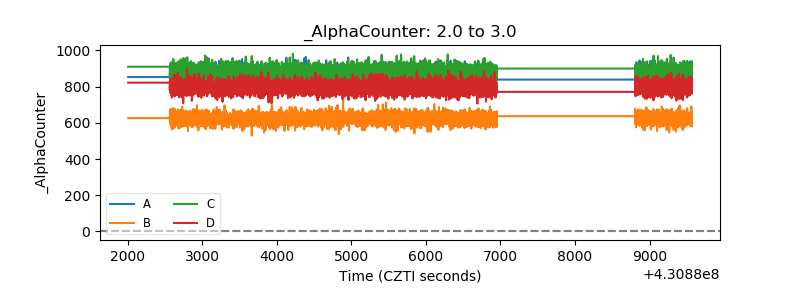 |
| _CPM_Rate | 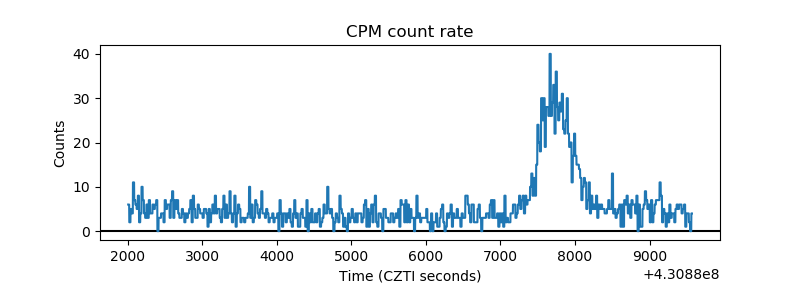 |
| CZT Counter | 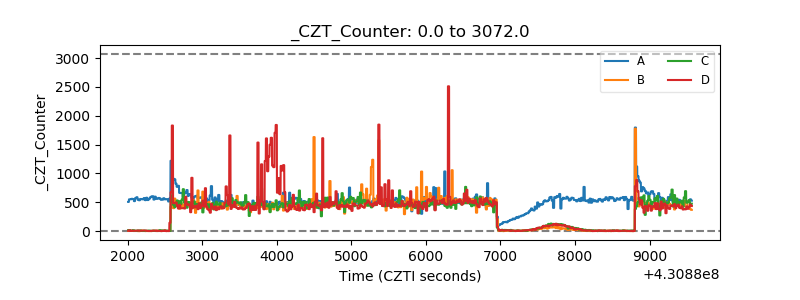 |
| +2.5 Volts monitor | 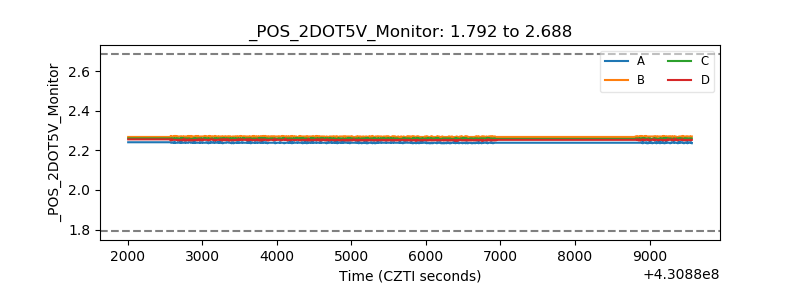 |
| +5 Volts monitor | 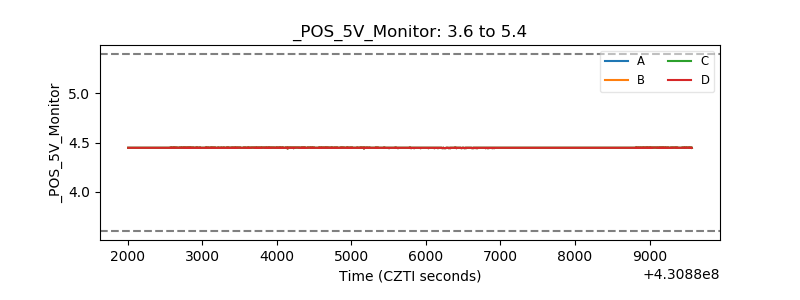 |
| _ROLL_ROT | 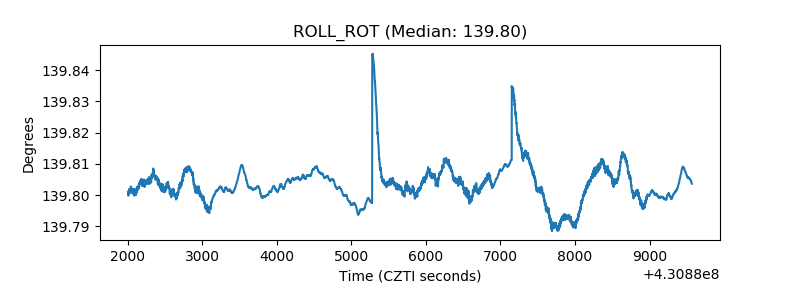 |
| _Roll_DEC | 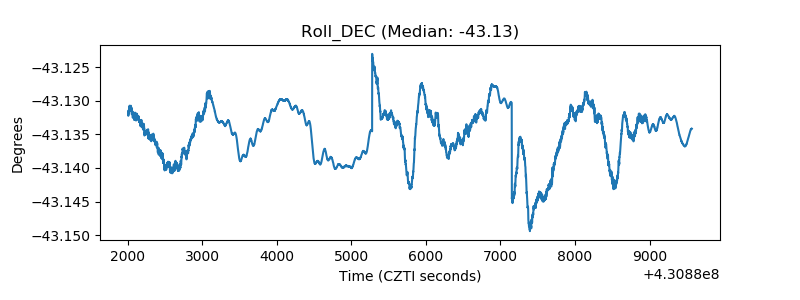 |
| _Roll_RA | 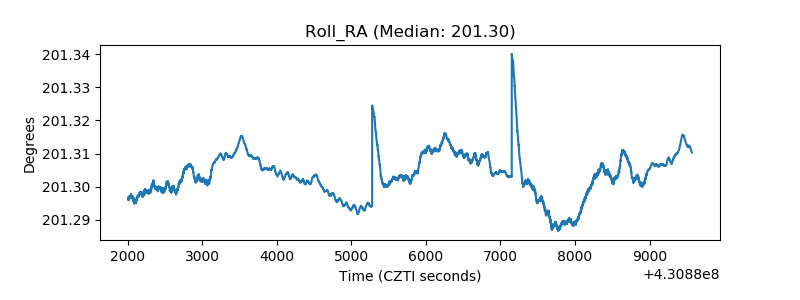 |
| Veto Counter | 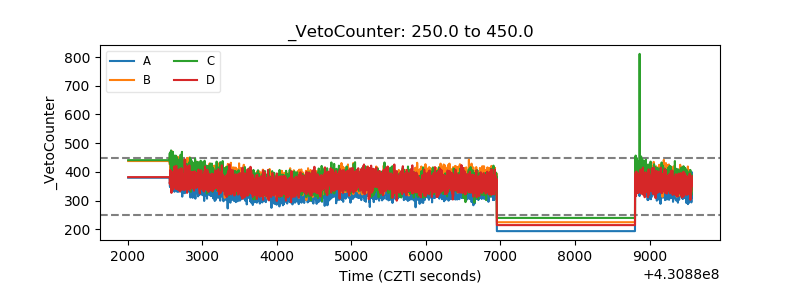 |