| Param | Original file | Final file |
|---|---|---|
| Filename | modeM0/AS1A05_013T01_9000005822_42797cztM0_level2.fits | modeM0/AS1A05_013T01_9000005822_42797cztM0_level2_quad_clean.evt |
| Size (bytes) | 311,198,400 | 93,314,880 |
| Size | 296.8 MB | 89.0 MB |
| Events in quadrant A | 3,048,058 | 625,471 |
| Events in quadrant B | 2,582,346 | 627,703 |
| Events in quadrant C | 2,719,245 | 614,287 |
| Events in quadrant D | 2,734,810 | 567,510 |
| Mode M0 | |||
|---|---|---|---|
| Quadrant | BADHDUFLAG | Total packets | Discarded packets |
| A | 0 | 12192 | 2 |
| B | 0 | 11557 | 2 |
| C | 0 | 11466 | 2 |
| D | 0 | 12048 | 2 |
| Mode M9 | |||
|---|---|---|---|
| Quadrant | BADHDUFLAG | Total packets | Discarded packets |
| A | 0 | 20 | 0 |
| B | 0 | 21 | 0 |
| C | 0 | 21 | 0 |
| D | 0 | 21 | 0 |
| Mode SS | |||
|---|---|---|---|
| Quadrant | BADHDUFLAG | Total packets | Discarded packets |
| A | 0 | 114 | 0 |
| B | 0 | 114 | 0 |
| C | 0 | 114 | 0 |
| D | 0 | 114 | 0 |
| Quadrant | Total seconds | Saturated seconds | Saturation percentage |
|---|---|---|---|
| A | 5583 | 11 | 0.197027% |
| B | 5583 | 31 | 0.555257% |
| C | 5583 | 4 | 0.071646% |
| D | 5583 | 32 | 0.573169% |
Noise dominated data is calculated using 1-second bins in cleaned event files. If a bin has >2000 counts, and if more than 50% of those come from <1% of pixels, then it is considered to be noise-dominated and hence unusable.
| Quadrant | # 1 sec bins | Bins with >0 counts | Bins with >2000 counts | High rate bins dominated by noise | Noise dominated (total time) | Noise dominated (detector-on time) | Marked lightcurve |
|---|---|---|---|---|---|---|---|
| A | 7076 | 5584 | 3 | 3 | 0.04% | 0.05% | 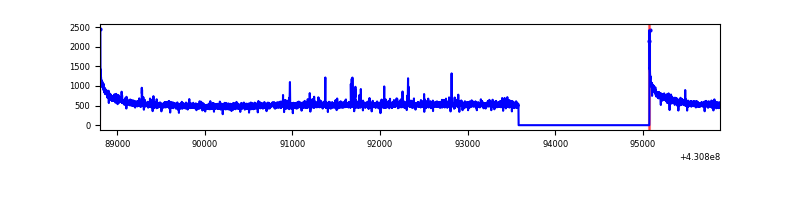 |
| B | 7076 | 5584 | 17 | 17 | 0.24% | 0.30% | 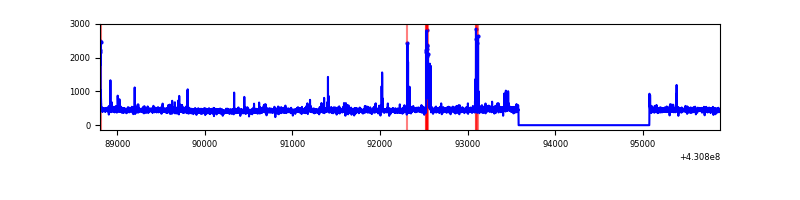 |
| C | 7076 | 5584 | 2 | 2 | 0.03% | 0.04% | 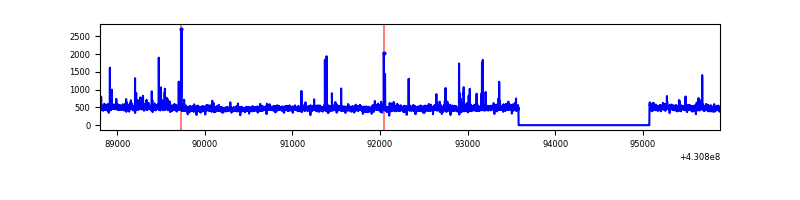 |
| D | 7076 | 5584 | 29 | 29 | 0.41% | 0.52% | 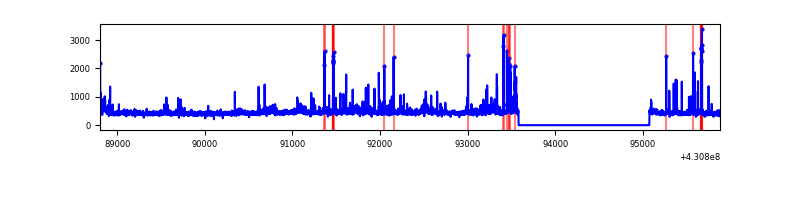 |
Top three noisy pixels from each quadrant. If the there are fewer than three noisy pixels in the level2.evt file, extra rows are filled as -1
| Pixel properties | Quadrant properties | ||||||
|---|---|---|---|---|---|---|---|
| Quadrant | DetID | PixID | Counts | Sigma | Mean | Median | Sigma |
| A | 10 | 83 | 593254 | 4631.32 | 620 | 607 | 128.0 |
| A | 13 | 248 | 22726 | 172.85 | 620 | 607 | 128.0 |
| A | 2 | 79 | 20452 | 155.08 | 620 | 607 | 128.0 |
| B | 5 | 255 | 60745 | 500.99 | 613 | 597 | 120.1 |
| B | 15 | 85 | 60583 | 499.64 | 613 | 597 | 120.1 |
| B | 7 | 202 | 20813 | 168.38 | 613 | 597 | 120.1 |
| C | 15 | 214 | 226073 | 1603.72 | 605 | 608 | 140.6 |
| C | 14 | 254 | 64443 | 454.05 | 605 | 608 | 140.6 |
| C | 8 | 79 | 38586 | 270.13 | 605 | 608 | 140.6 |
| D | 7 | 96 | 113699 | 756.76 | 608 | 589 | 149.5 |
| D | 1 | 52 | 93450 | 621.29 | 608 | 589 | 149.5 |
| D | 12 | 233 | 62009 | 410.93 | 608 | 589 | 149.5 |
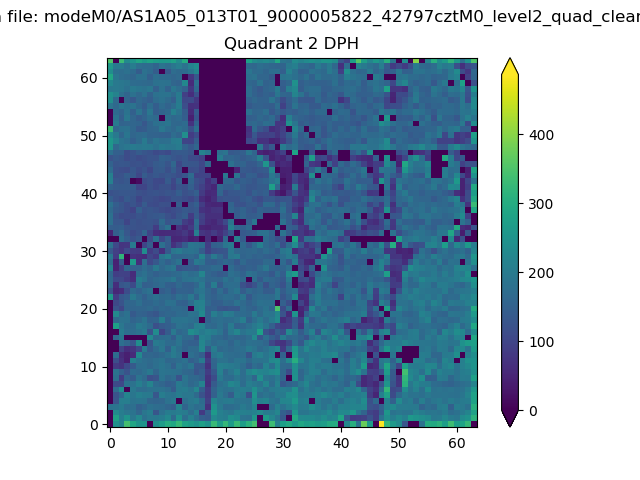
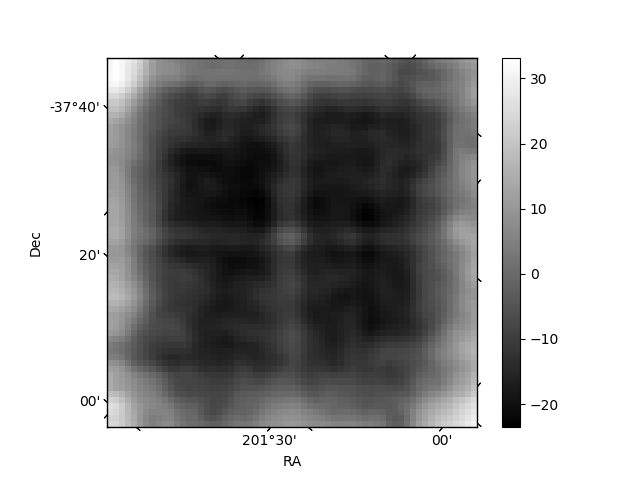
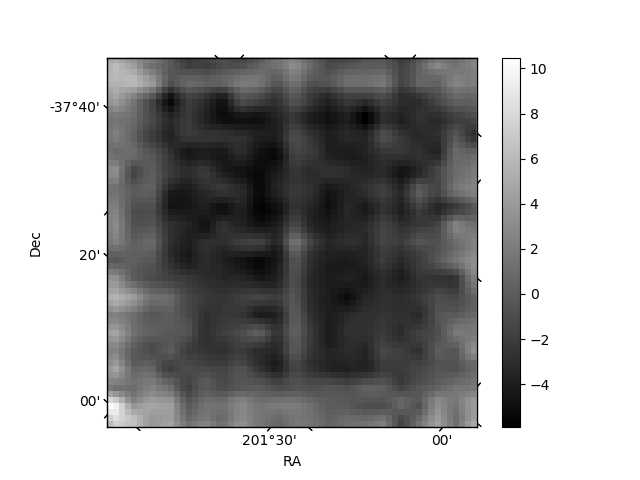
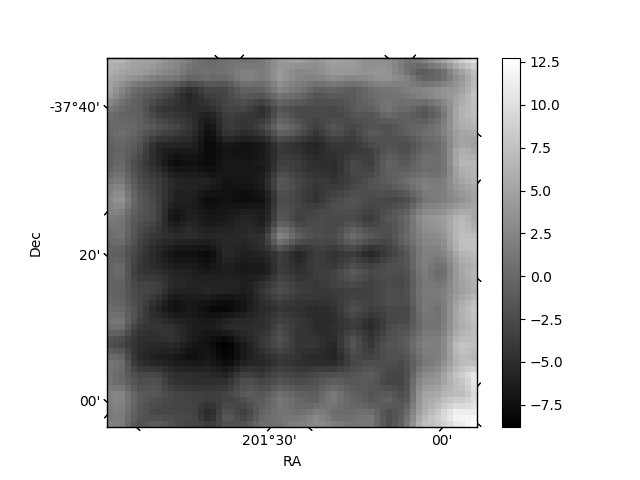
Histogram calculated using DETX and DETY for each event in the final _common_clean file
| Quadrant A | 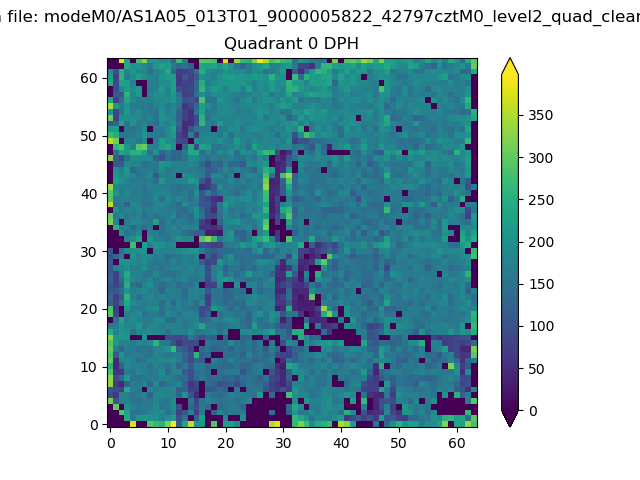 |
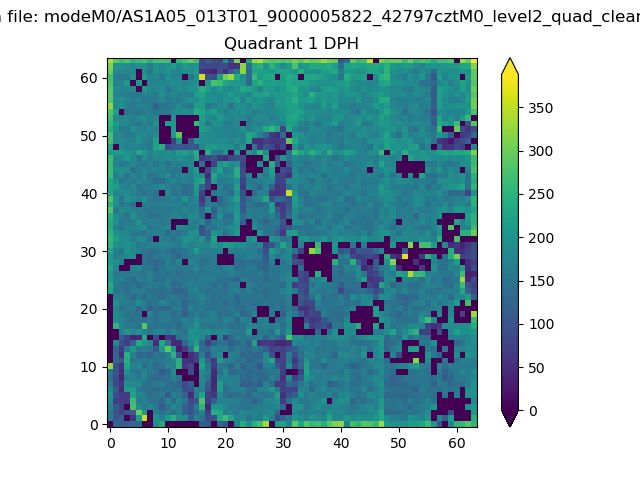 |
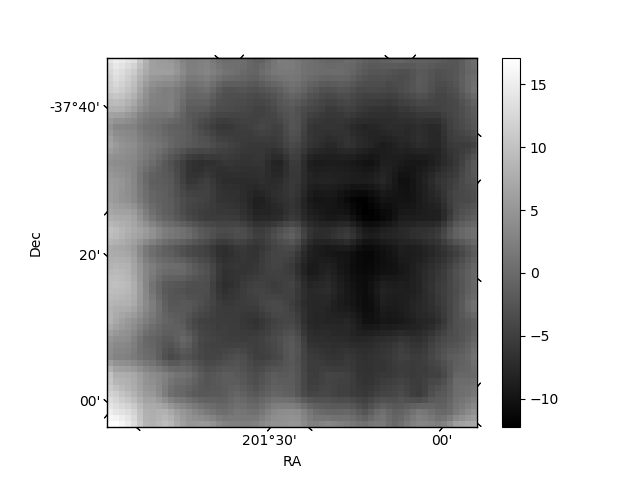
Quadrant B |
|---|---|---|---|
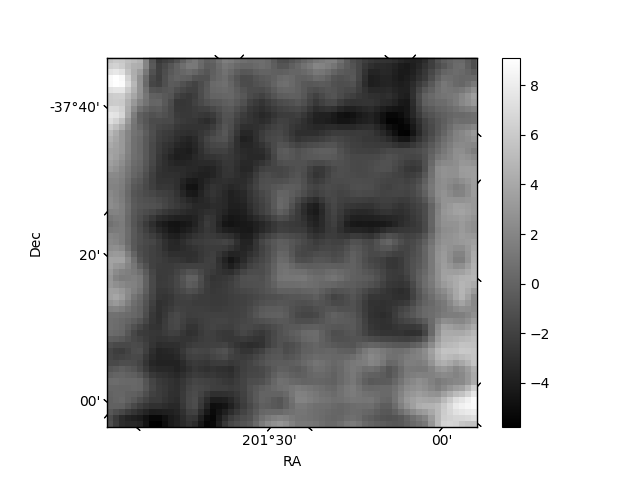
| Quadrant D | 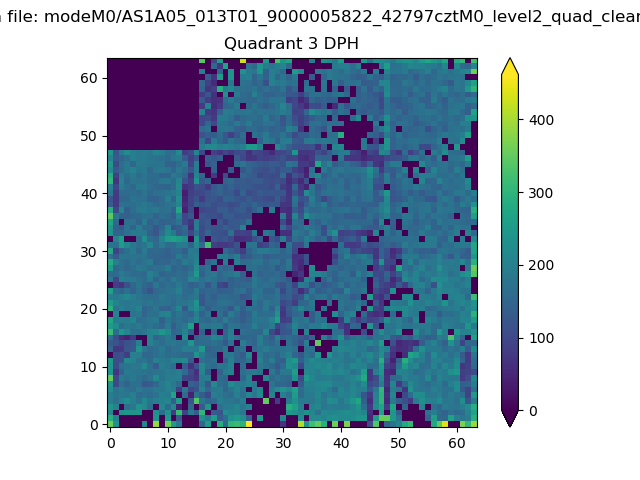 |
 |
Quadrant C |
| Plot type | Count rate plots | Images |
|---|---|---|
| Comparison with Poisson distribution Blue bars denote a histogram of data divided into 1 sec bins. Red curve is a Poisson curve with rate = median count rate of data. |
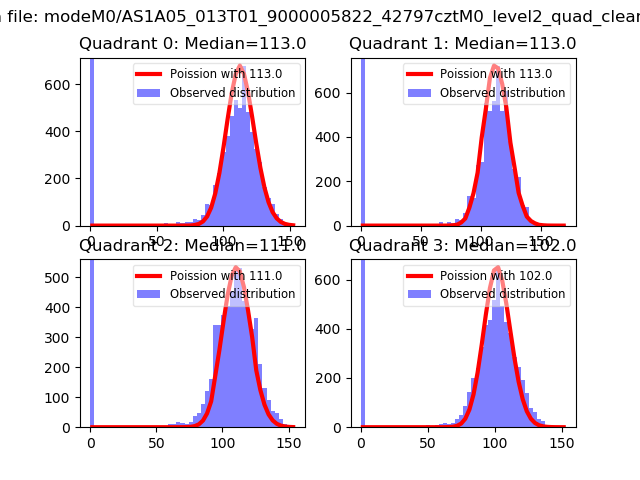 |
 |
| Quadrant-wise count rates Data is divided into 100 sec bins |
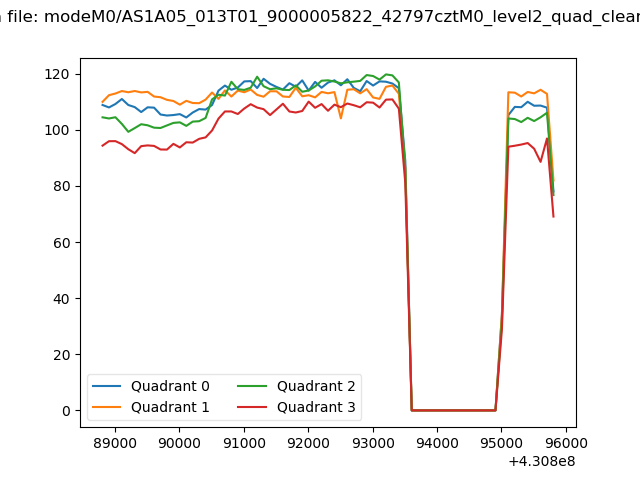 |
|
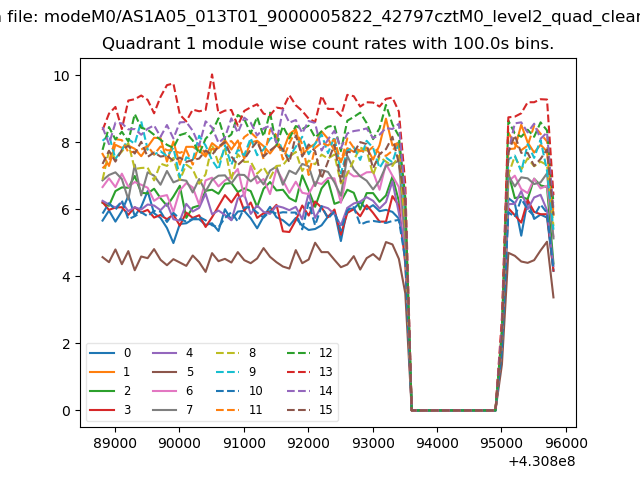
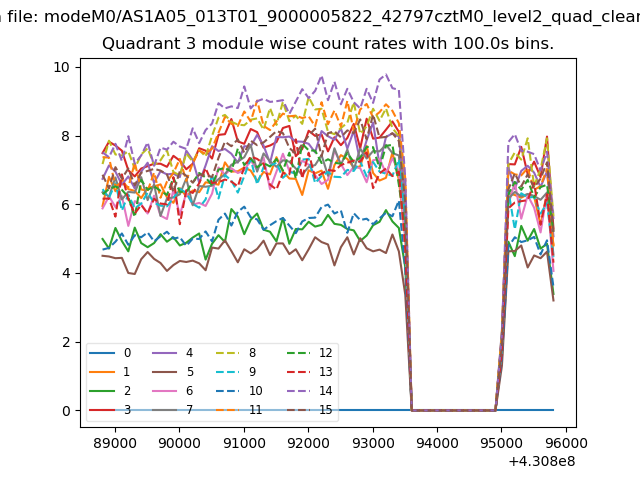
| Module-wise count rates for Quadrant A Data is divided into 100 sec bins |
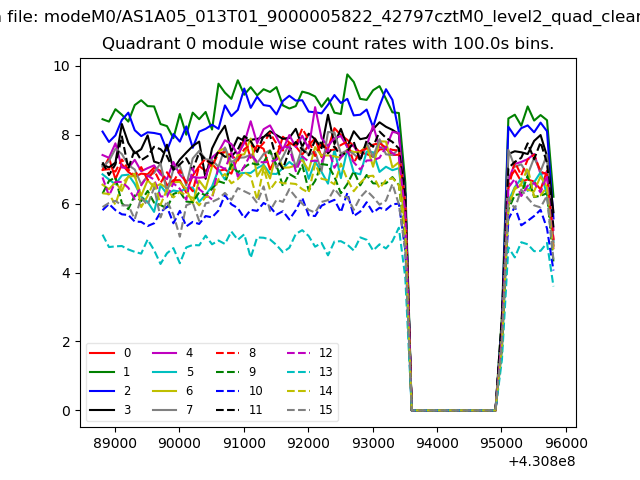 |
 |
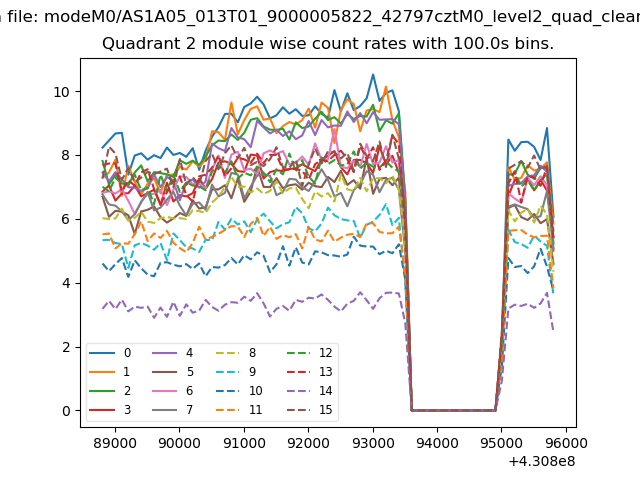
| Module-wise count rates for Quadrant B Data is divided into 100 sec bins |
 |
 |
| Module-wise count rates for Quadrant C Data is divided into 100 sec bins |
 |
 |
| Module-wise count rates for Quadrant D Data is divided into 100 sec bins |
 |
 |
| Parameter | Plot |
|---|---|
| CZT HV Monitor | 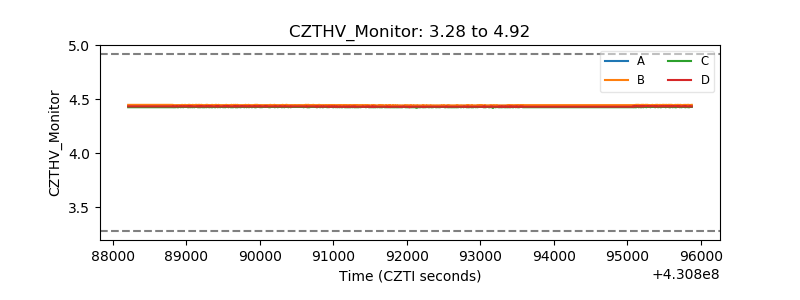 |
| D_VDD | 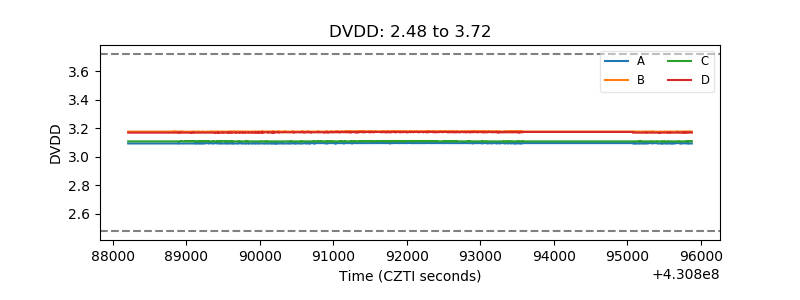 |
| Temperature 1 | 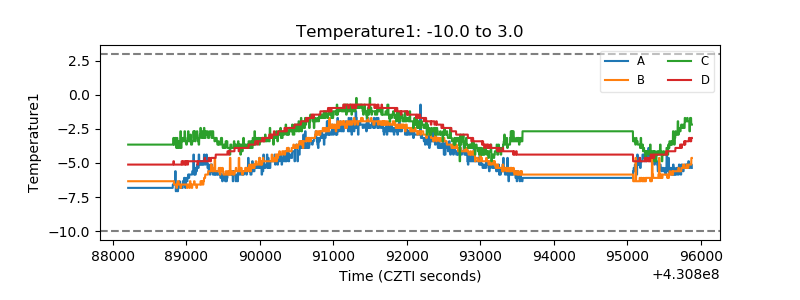 |
| Veto HV Monitor | 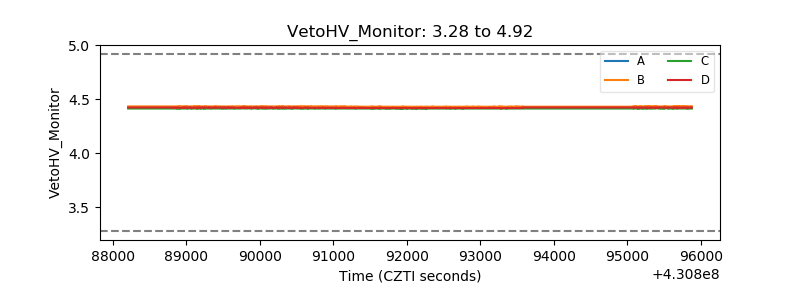 |
| Veto LLD | 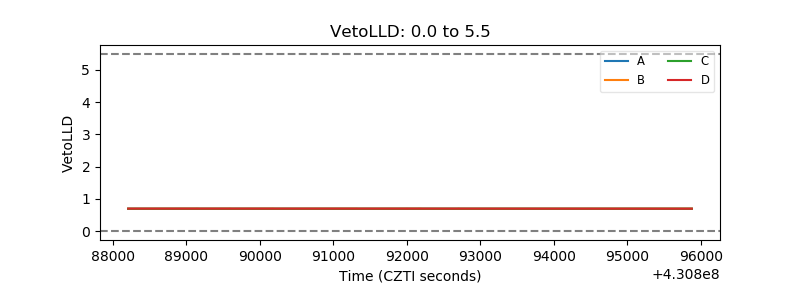 |
| Alpha Counter | 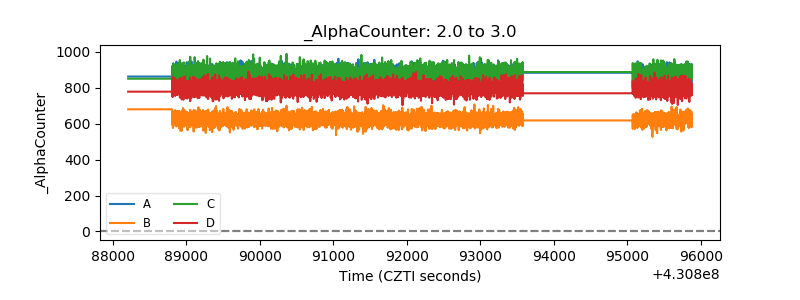 |
| _CPM_Rate | 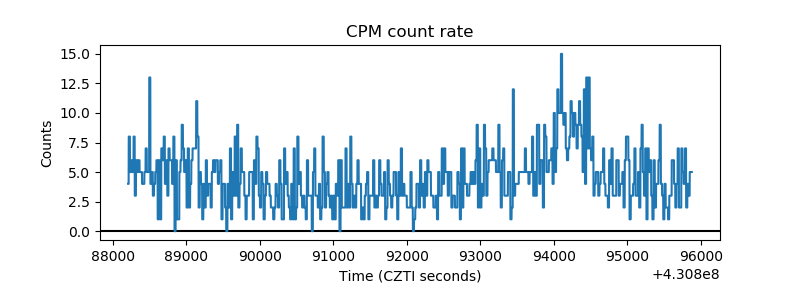 |
| CZT Counter | 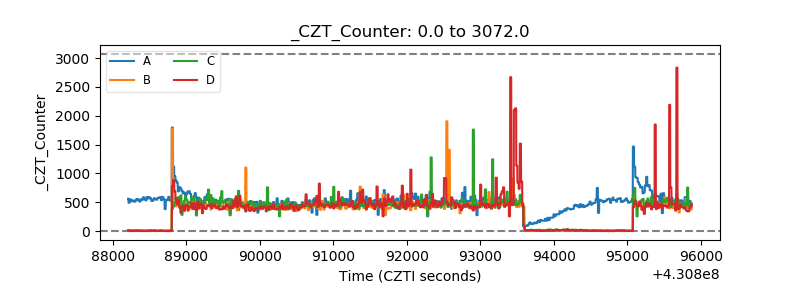 |
| +2.5 Volts monitor | 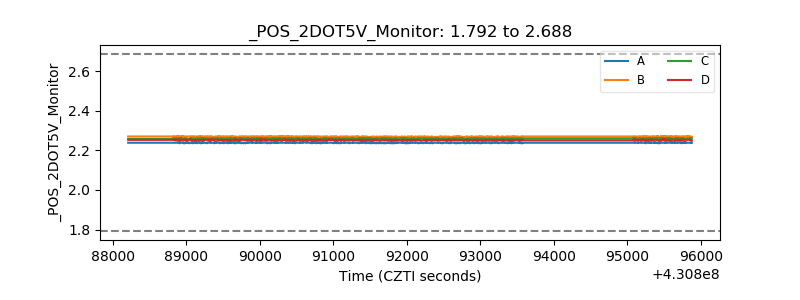 |
| +5 Volts monitor | 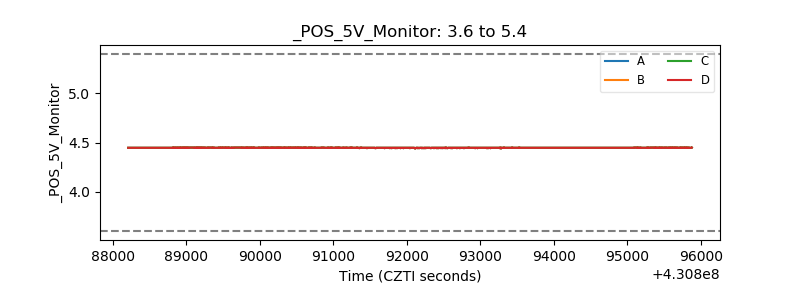 |
| _ROLL_ROT | 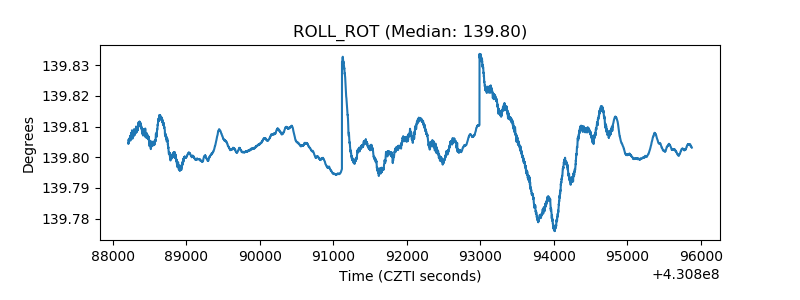 |
| _Roll_DEC | 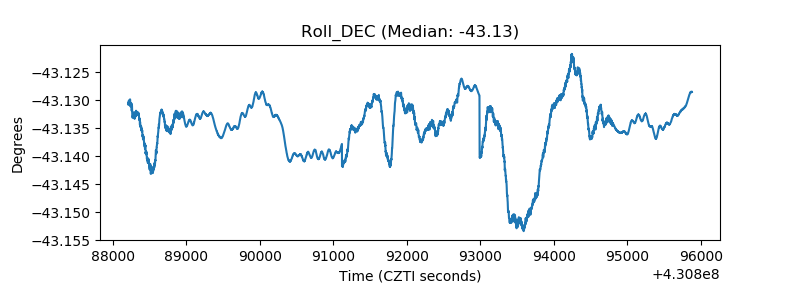 |
| _Roll_RA | 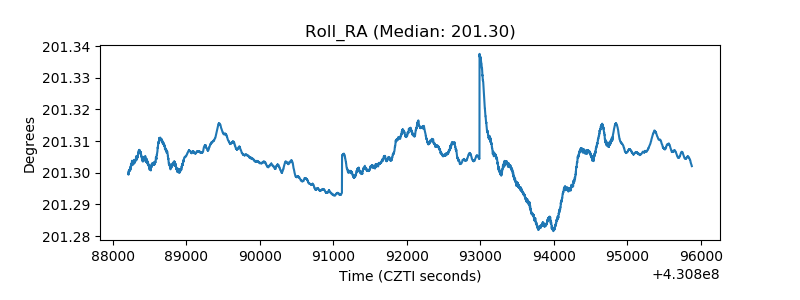 |
| Veto Counter | 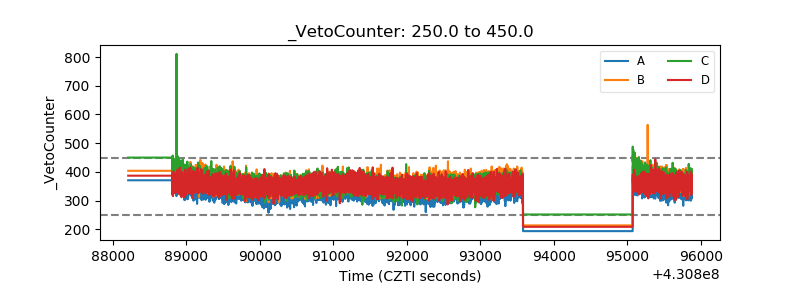 |