| Param | Original file | Final file |
|---|---|---|
| Filename | modeM0/AS1A05_013T01_9000005822_42798cztM0_level2.fits | modeM0/AS1A05_013T01_9000005822_42798cztM0_level2_quad_clean.evt |
| Size (bytes) | 352,036,800 | 97,928,640 |
| Size | 335.7 MB | 93.4 MB |
| Events in quadrant A | 3,378,726 | 652,608 |
| Events in quadrant B | 2,741,566 | 657,001 |
| Events in quadrant C | 3,172,561 | 649,429 |
| Events in quadrant D | 3,279,174 | 593,969 |
| Mode M0 | |||
|---|---|---|---|
| Quadrant | BADHDUFLAG | Total packets | Discarded packets |
| A | 0 | 13343 | 2 |
| B | 0 | 12157 | 2 |
| C | 0 | 12951 | 2 |
| D | 0 | 13738 | 3 |
| Mode M9 | |||
|---|---|---|---|
| Quadrant | BADHDUFLAG | Total packets | Discarded packets |
| A | 0 | 21 | 0 |
| B | 0 | 22 | 0 |
| C | 0 | 22 | 0 |
| D | 0 | 22 | 0 |
| Mode SS | |||
|---|---|---|---|
| Quadrant | BADHDUFLAG | Total packets | Discarded packets |
| A | 0 | 120 | 0 |
| B | 0 | 120 | 0 |
| C | 0 | 120 | 0 |
| D | 0 | 120 | 0 |
| Quadrant | Total seconds | Saturated seconds | Saturation percentage |
|---|---|---|---|
| A | 5899 | 46 | 0.779793% |
| B | 5899 | 19 | 0.322088% |
| C | 5899 | 17 | 0.288184% |
| D | 5898 | 114 | 1.932859% |
Noise dominated data is calculated using 1-second bins in cleaned event files. If a bin has >2000 counts, and if more than 50% of those come from <1% of pixels, then it is considered to be noise-dominated and hence unusable.
| Quadrant | # 1 sec bins | Bins with >0 counts | Bins with >2000 counts | High rate bins dominated by noise | Noise dominated (total time) | Noise dominated (detector-on time) | Marked lightcurve |
|---|---|---|---|---|---|---|---|
| A | 7242 | 5900 | 33 | 33 | 0.46% | 0.56% | 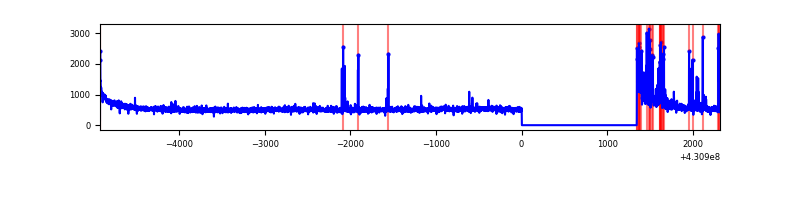 |
| B | 7242 | 5900 | 9 | 9 | 0.12% | 0.15% | 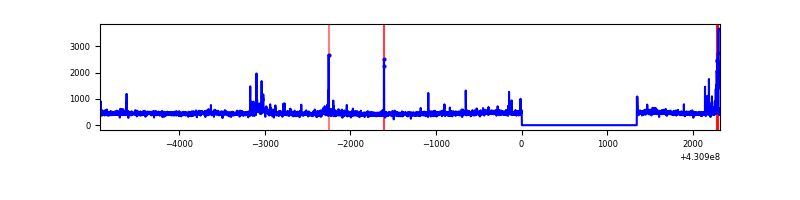 |
| C | 7242 | 5900 | 12 | 12 | 0.17% | 0.20% | 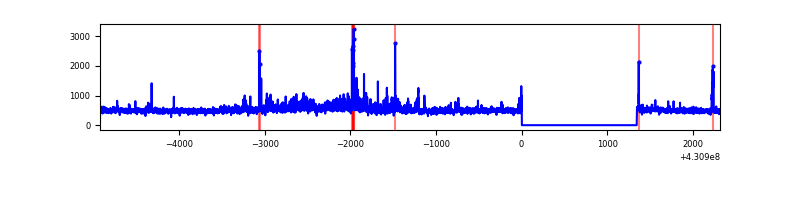 |
| D | 7241 | 5899 | 114 | 114 | 1.57% | 1.93% | 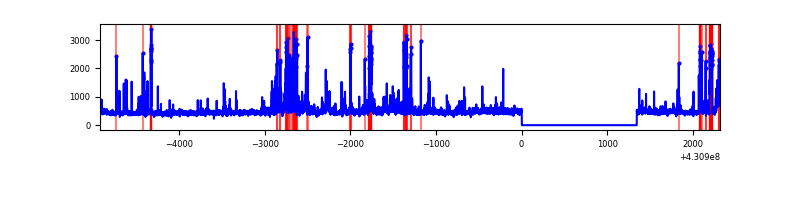 |
Top three noisy pixels from each quadrant. If the there are fewer than three noisy pixels in the level2.evt file, extra rows are filled as -1
| Pixel properties | Quadrant properties | ||||||
|---|---|---|---|---|---|---|---|
| Quadrant | DetID | PixID | Counts | Sigma | Mean | Median | Sigma |
| A | 10 | 83 | 620338 | 4567.53 | 656 | 644 | 135.7 |
| A | 13 | 248 | 207063 | 1521.44 | 656 | 644 | 135.7 |
| A | 2 | 79 | 12095 | 84.4 | 656 | 644 | 135.7 |
| B | 5 | 172 | 52299 | 407.27 | 646 | 627 | 126.9 |
| B | 6 | 235 | 44313 | 344.33 | 646 | 627 | 126.9 |
| B | 5 | 255 | 25181 | 193.53 | 646 | 627 | 126.9 |
| C | 8 | 79 | 251008 | 1655.26 | 642 | 645 | 151.3 |
| C | 15 | 214 | 240026 | 1582.66 | 642 | 645 | 151.3 |
| C | 14 | 254 | 103766 | 681.78 | 642 | 645 | 151.3 |
| D | 12 | 233 | 190617 | 1211.63 | 639 | 623 | 156.8 |
| D | 7 | 96 | 185376 | 1178.21 | 639 | 623 | 156.8 |
| D | 1 | 52 | 172294 | 1094.78 | 639 | 623 | 156.8 |
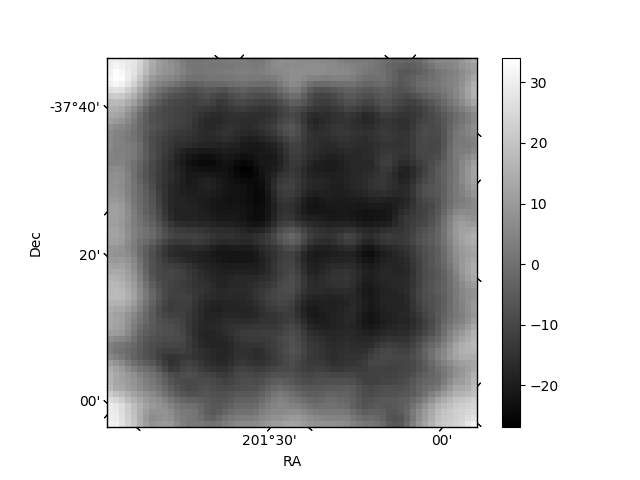
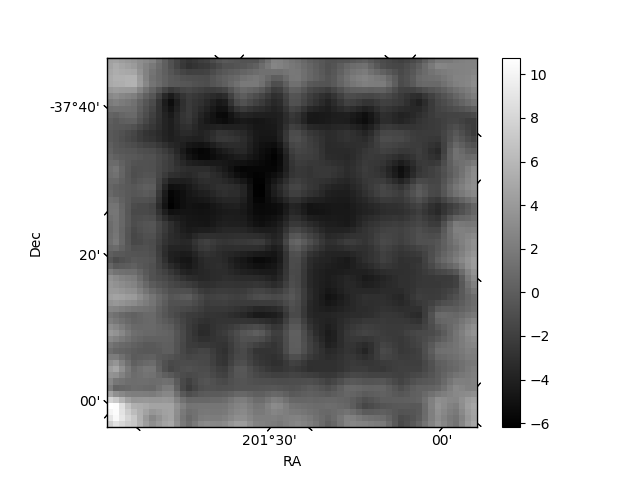
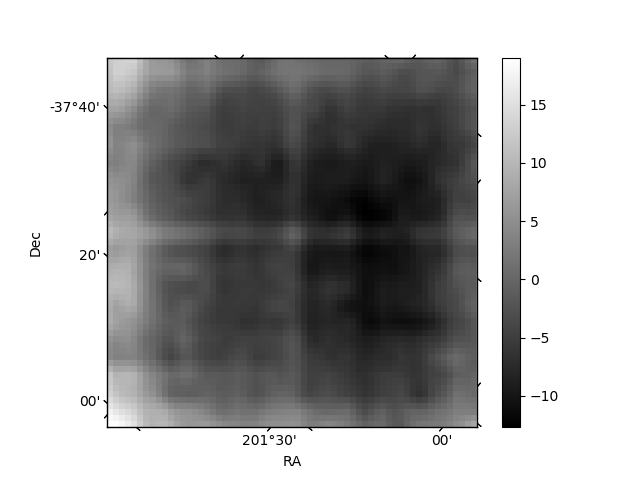
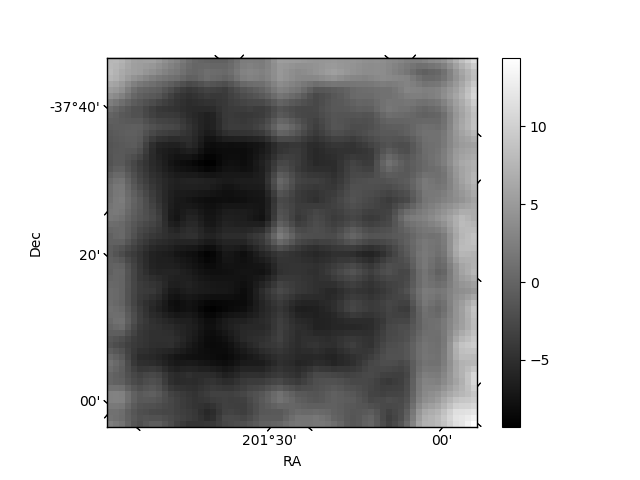
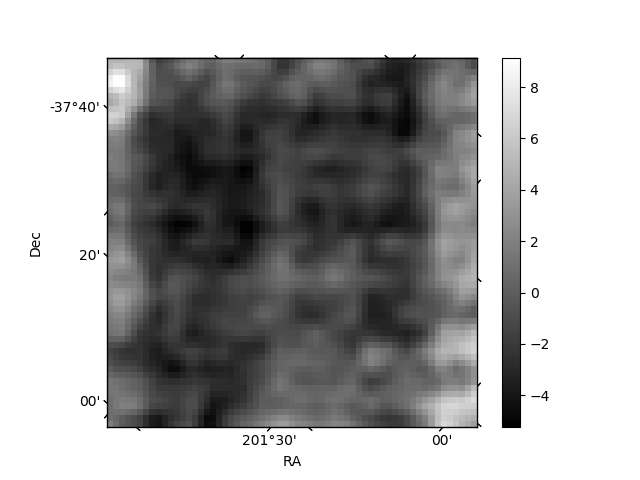
Histogram calculated using DETX and DETY for each event in the final _common_clean file
| Quadrant A | 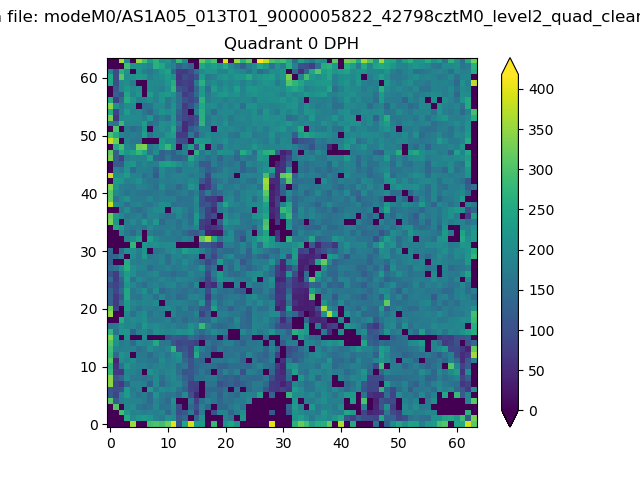 |
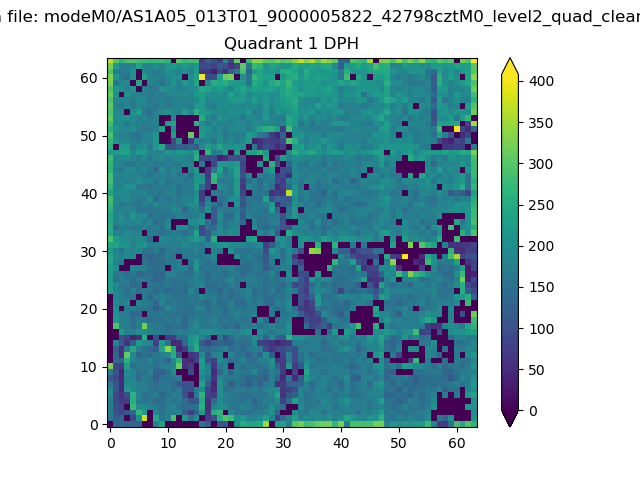 |
Quadrant B |
|---|---|---|---|
| Quadrant D | 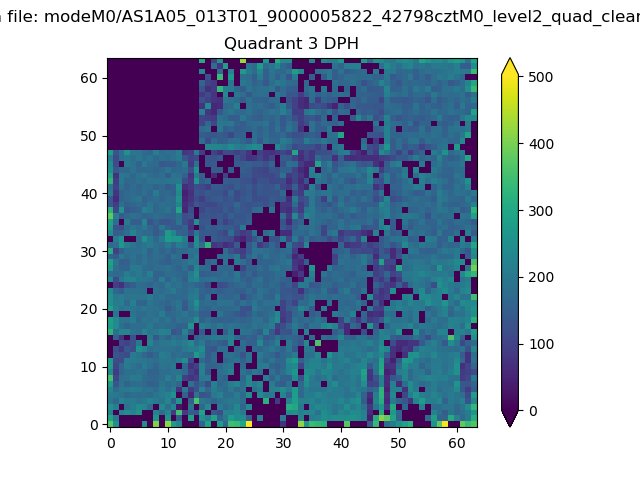 |
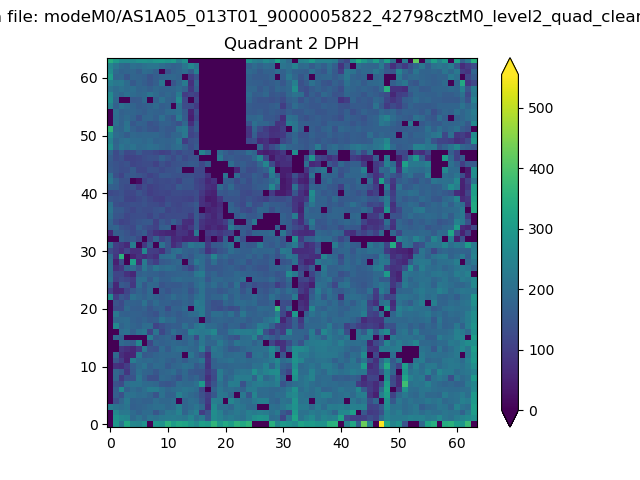 |
Quadrant C |
| Plot type | Count rate plots | Images |
|---|---|---|
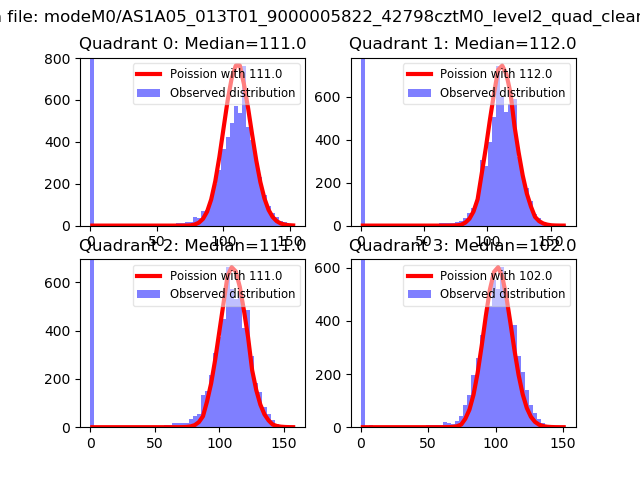
| Comparison with Poisson distribution Blue bars denote a histogram of data divided into 1 sec bins. Red curve is a Poisson curve with rate = median count rate of data. |
 |
 |
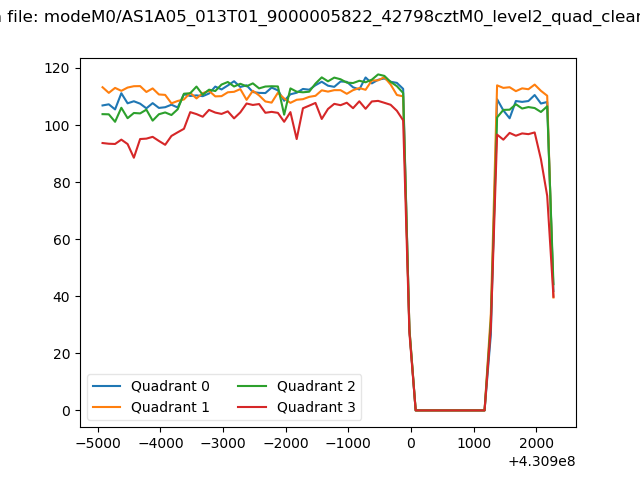
| Quadrant-wise count rates Data is divided into 100 sec bins |
 |
|
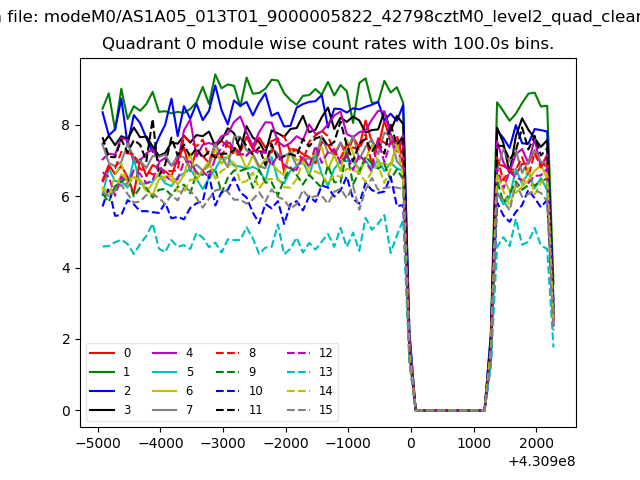
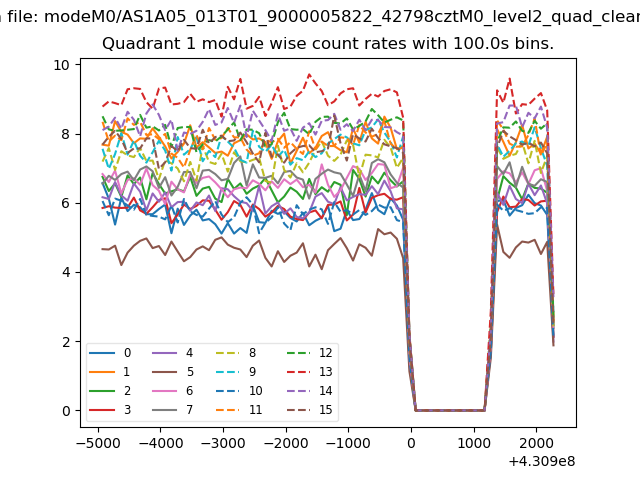
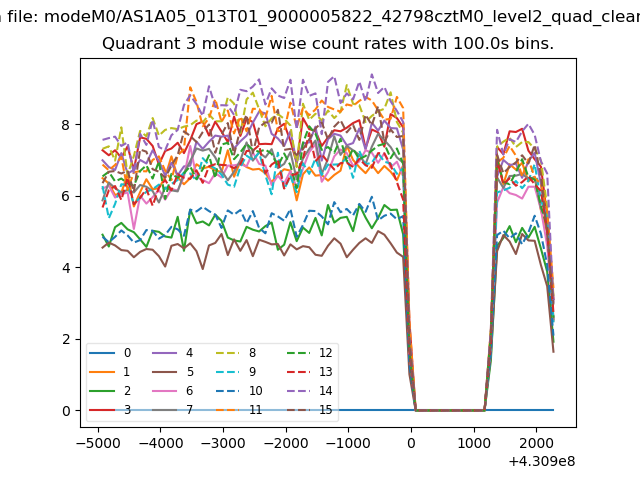
| Module-wise count rates for Quadrant A Data is divided into 100 sec bins |
 |
 |
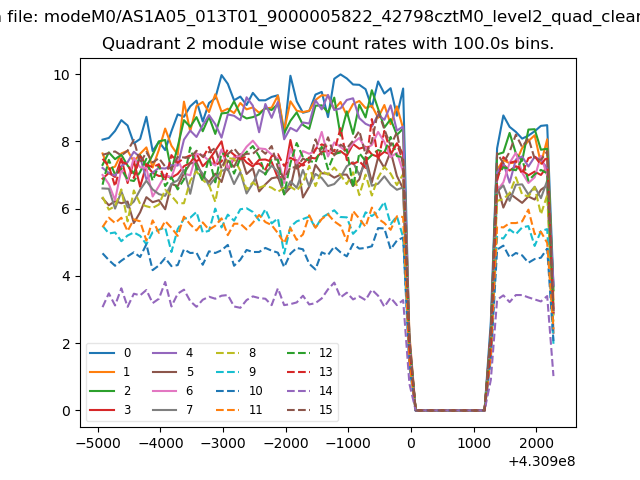
| Module-wise count rates for Quadrant B Data is divided into 100 sec bins |
 |
 |
| Module-wise count rates for Quadrant C Data is divided into 100 sec bins |
 |
 |
| Module-wise count rates for Quadrant D Data is divided into 100 sec bins |
 |
 |
| Parameter | Plot |
|---|---|
| CZT HV Monitor | 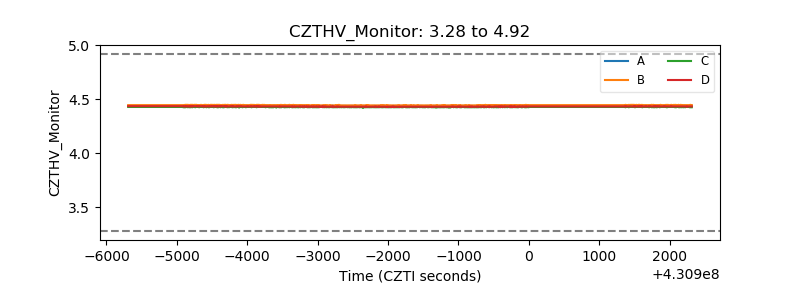 |
| D_VDD | 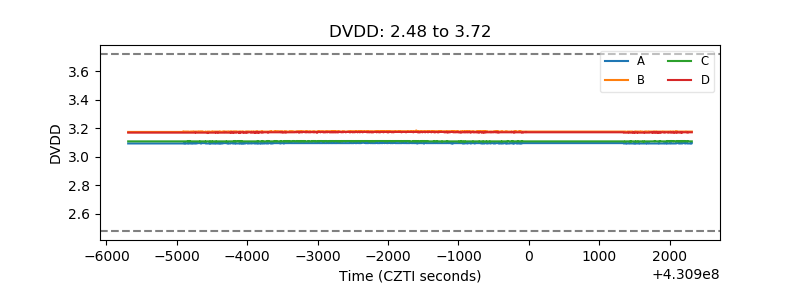 |
| Temperature 1 | 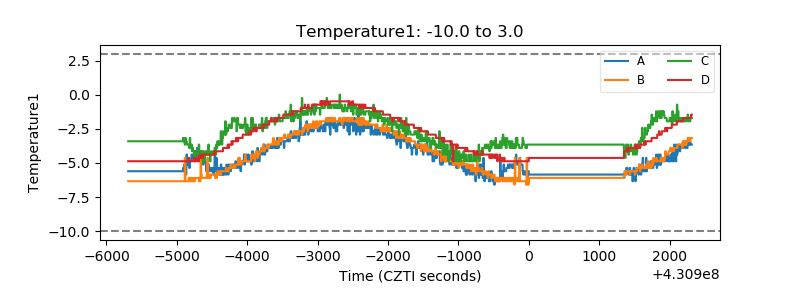 |
| Veto HV Monitor | 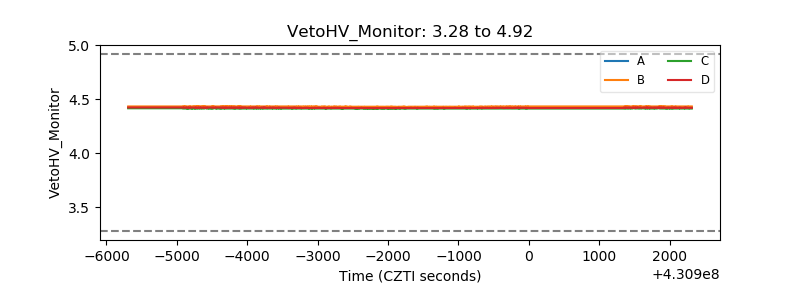 |
| Veto LLD | 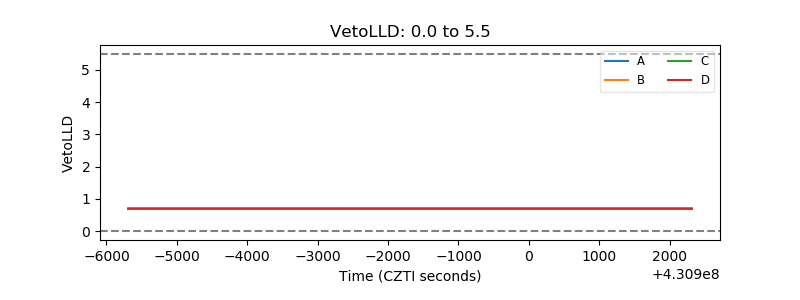 |
| Alpha Counter | 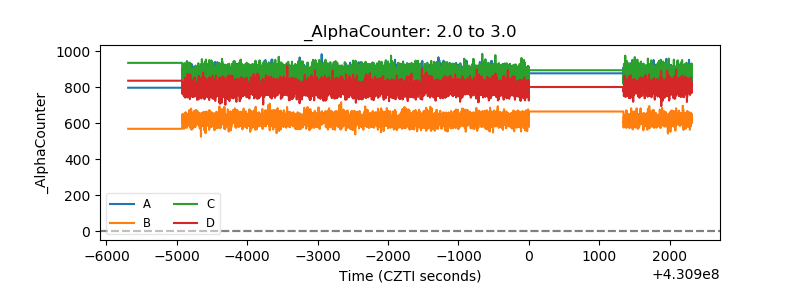 |
| _CPM_Rate |  |
| CZT Counter | 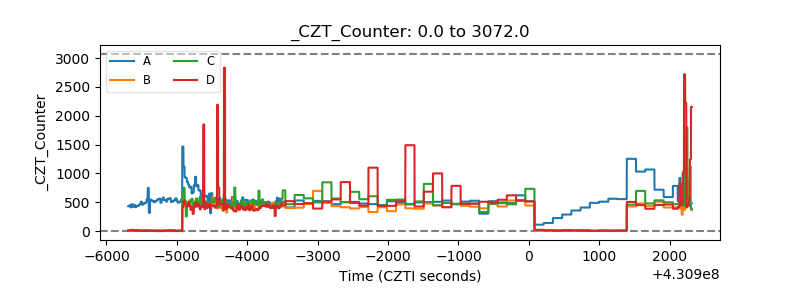 |
| +2.5 Volts monitor | 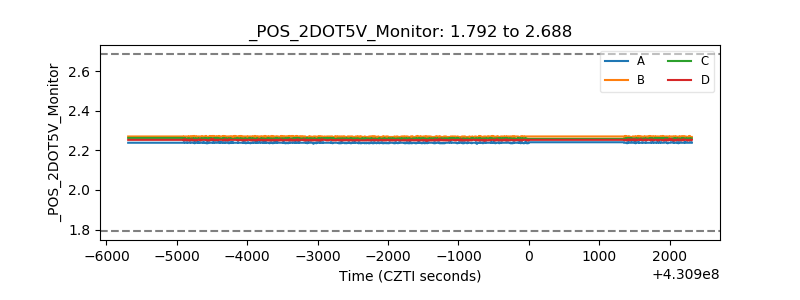 |
| +5 Volts monitor | 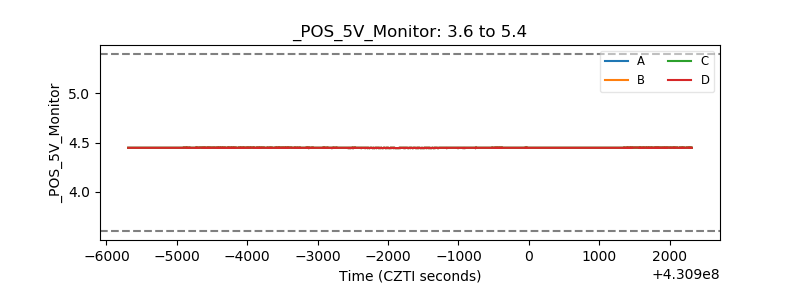 |
| _ROLL_ROT | 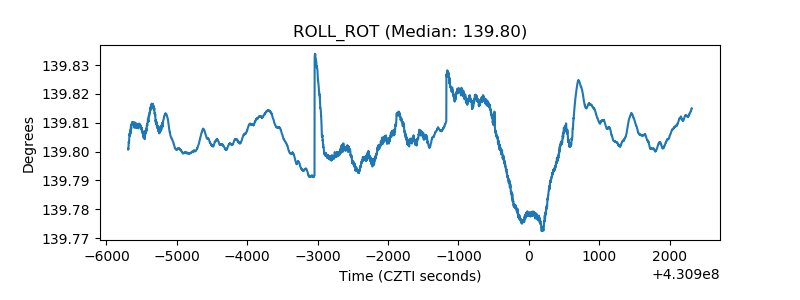 |
| _Roll_DEC | 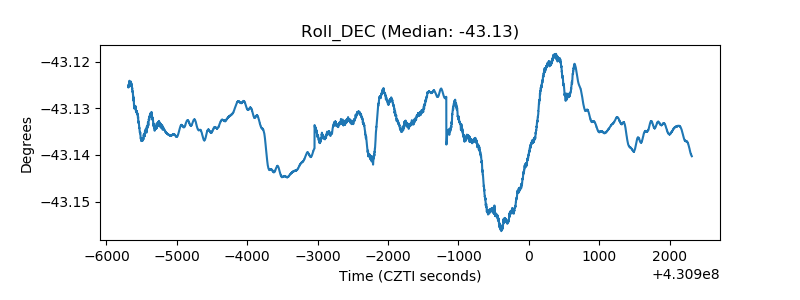 |
| _Roll_RA | 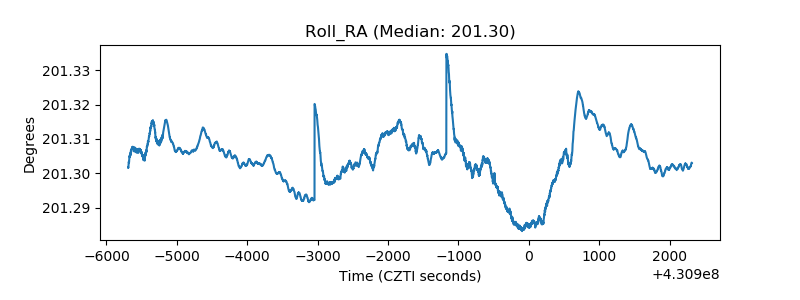 |
| Veto Counter | 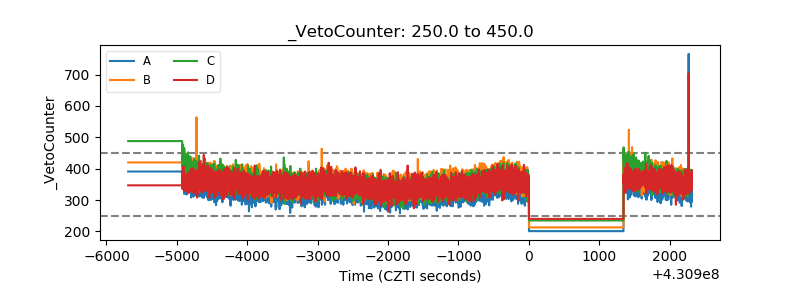 |