| Param | Original file | Final file |
|---|---|---|
| Filename | modeM0/AS1A05_013T01_9000005822_42801cztM0_level2.fits | modeM0/AS1A05_013T01_9000005822_42801cztM0_level2_quad_clean.evt |
| Size (bytes) | 936,783,360 | 254,957,760 |
| Size | 893.4 MB | 243.1 MB |
| Events in quadrant A | 8,665,569 | 1,711,123 |
| Events in quadrant B | 8,032,625 | 1,691,394 |
| Events in quadrant C | 7,756,575 | 1,698,175 |
| Events in quadrant D | 9,016,765 | 1,545,612 |
| Mode M0 | |||
|---|---|---|---|
| Quadrant | BADHDUFLAG | Total packets | Discarded packets |
| A | 0 | 34633 | 3 |
| B | 0 | 34563 | 3 |
| C | 0 | 32382 | 3 |
| D | 0 | 37343 | 4 |
| Mode M9 | |||
|---|---|---|---|
| Quadrant | BADHDUFLAG | Total packets | Discarded packets |
| A | 0 | 42 | 0 |
| B | 0 | 42 | 0 |
| C | 0 | 42 | 0 |
| D | 0 | 42 | 0 |
| Mode SS | |||
|---|---|---|---|
| Quadrant | BADHDUFLAG | Total packets | Discarded packets |
| A | 0 | 316 | 0 |
| B | 0 | 316 | 0 |
| C | 0 | 316 | 0 |
| D | 0 | 316 | 0 |
| Quadrant | Total seconds | Saturated seconds | Saturation percentage |
|---|---|---|---|
| A | 15554 | 73 | 0.469333% |
| B | 15554 | 215 | 1.382281% |
| C | 15555 | 38 | 0.244294% |
| D | 15554 | 445 | 2.861000% |
Noise dominated data is calculated using 1-second bins in cleaned event files. If a bin has >2000 counts, and if more than 50% of those come from <1% of pixels, then it is considered to be noise-dominated and hence unusable.
| Quadrant | # 1 sec bins | Bins with >0 counts | Bins with >2000 counts | High rate bins dominated by noise | Noise dominated (total time) | Noise dominated (detector-on time) | Marked lightcurve |
|---|---|---|---|---|---|---|---|
| A | 19642 | 15557 | 47 | 47 | 0.24% | 0.30% | 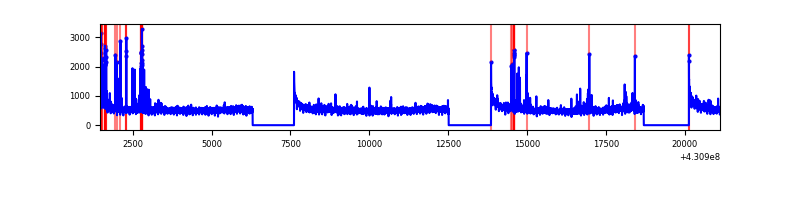 |
| B | 19642 | 15557 | 181 | 181 | 0.92% | 1.16% | 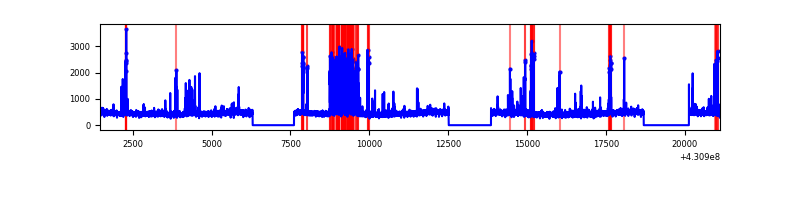 |
| C | 19643 | 15558 | 34 | 34 | 0.17% | 0.22% | 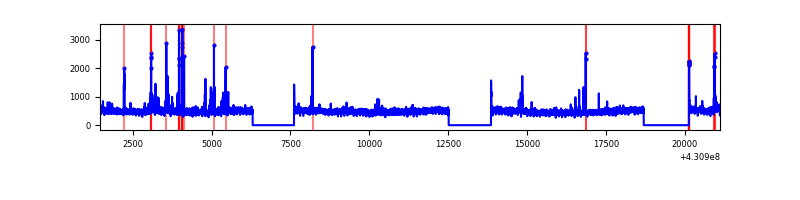 |
| D | 19642 | 15557 | 430 | 430 | 2.19% | 2.76% | 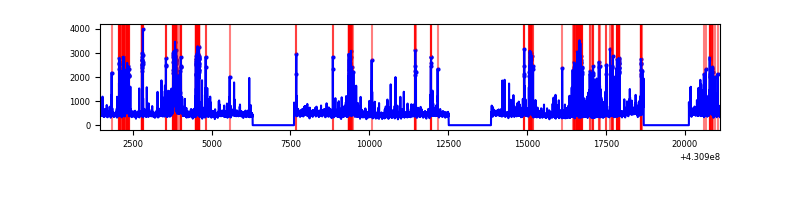 |
Top three noisy pixels from each quadrant. If the there are fewer than three noisy pixels in the level2.evt file, extra rows are filled as -1
| Pixel properties | Quadrant properties | ||||||
|---|---|---|---|---|---|---|---|
| Quadrant | DetID | PixID | Counts | Sigma | Mean | Median | Sigma |
| A | 10 | 83 | 1507290 | 4287.39 | 1729 | 1697 | 351.2 |
| A | 13 | 248 | 386224 | 1094.99 | 1729 | 1697 | 351.2 |
| A | 15 | 223 | 35600 | 96.54 | 1729 | 1697 | 351.2 |
| B | 5 | 255 | 942350 | 2829.87 | 1700 | 1648 | 332.4 |
| B | 5 | 172 | 141621 | 421.07 | 1700 | 1648 | 332.4 |
| B | 15 | 85 | 135387 | 402.32 | 1700 | 1648 | 332.4 |
| C | 15 | 214 | 626414 | 1594.71 | 1685 | 1701 | 391.7 |
| C | 3 | 233 | 255460 | 647.77 | 1685 | 1701 | 391.7 |
| C | 14 | 254 | 211126 | 534.6 | 1685 | 1701 | 391.7 |
| D | 2 | 249 | 752739 | 1832.49 | 1679 | 1635 | 409.9 |
| D | 5 | 171 | 718166 | 1748.14 | 1679 | 1635 | 409.9 |
| D | 13 | 249 | 346601 | 841.62 | 1679 | 1635 | 409.9 |
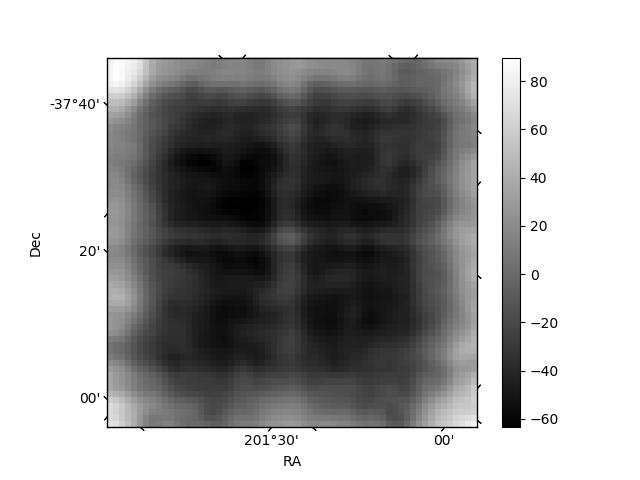
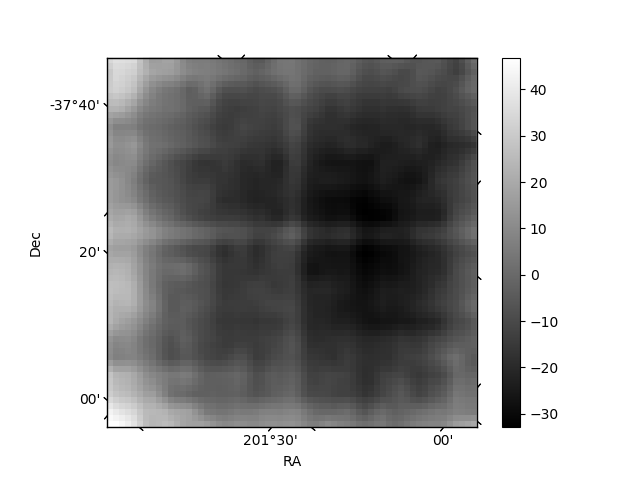
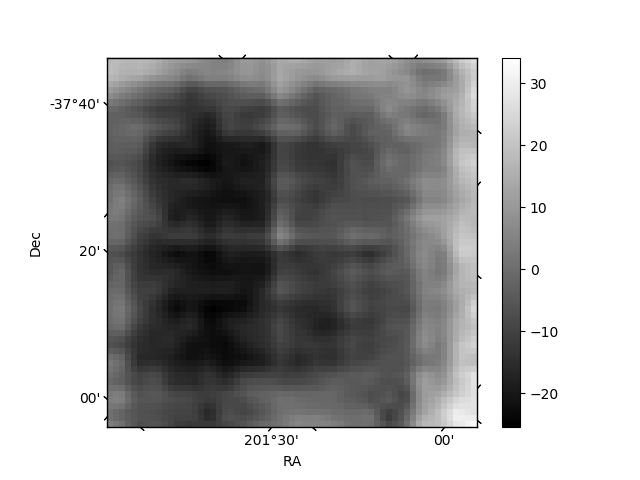
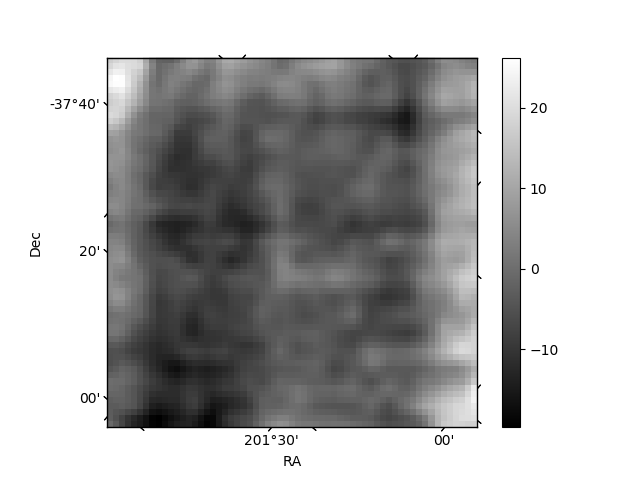
Histogram calculated using DETX and DETY for each event in the final _common_clean file
| Quadrant A | 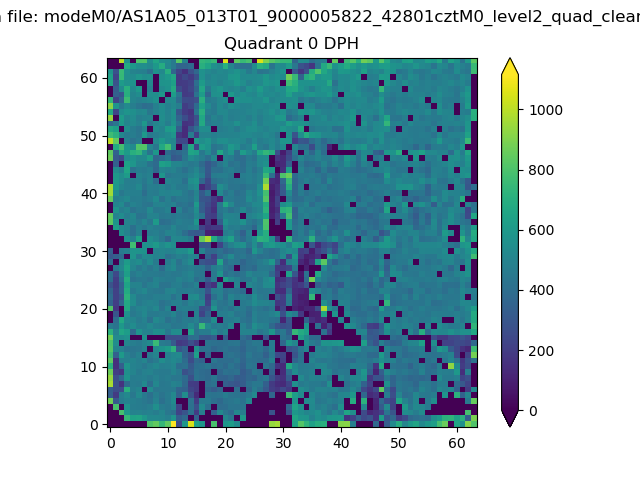 |
 |
Quadrant B |
|---|---|---|---|
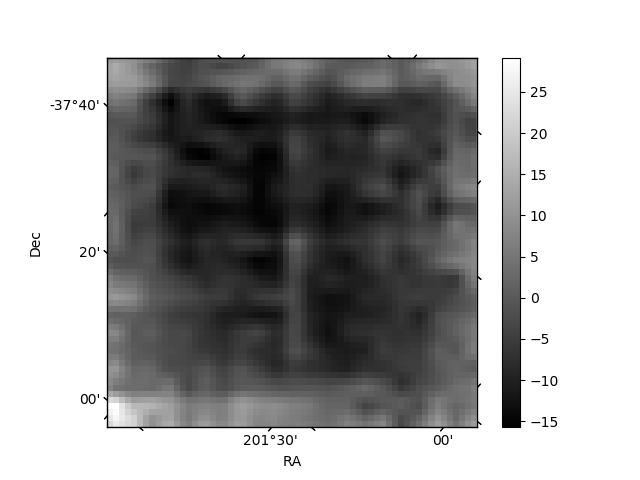
| Quadrant D | 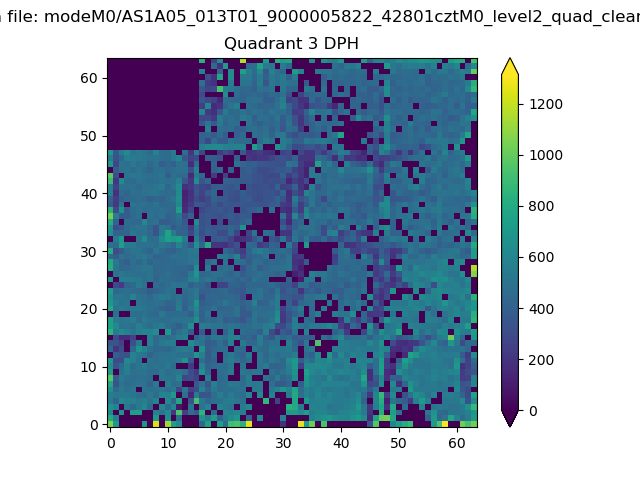 |
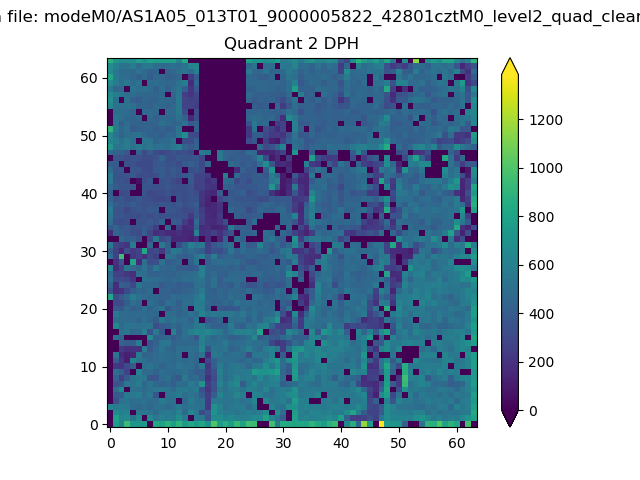 |
Quadrant C |
| Plot type | Count rate plots | Images |
|---|---|---|
| Comparison with Poisson distribution Blue bars denote a histogram of data divided into 1 sec bins. Red curve is a Poisson curve with rate = median count rate of data. |
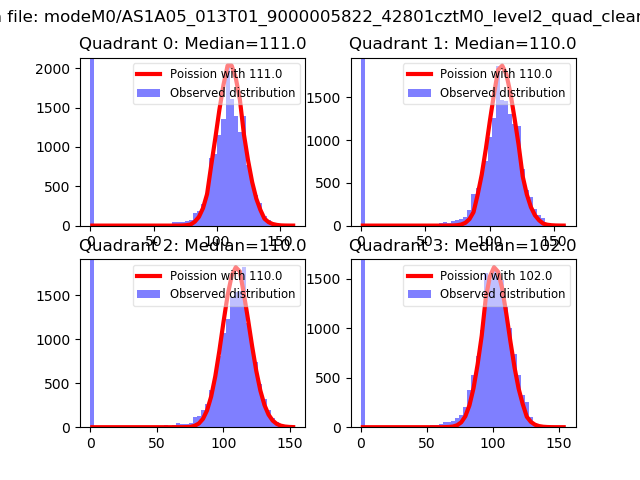 |
 |
| Quadrant-wise count rates Data is divided into 100 sec bins |
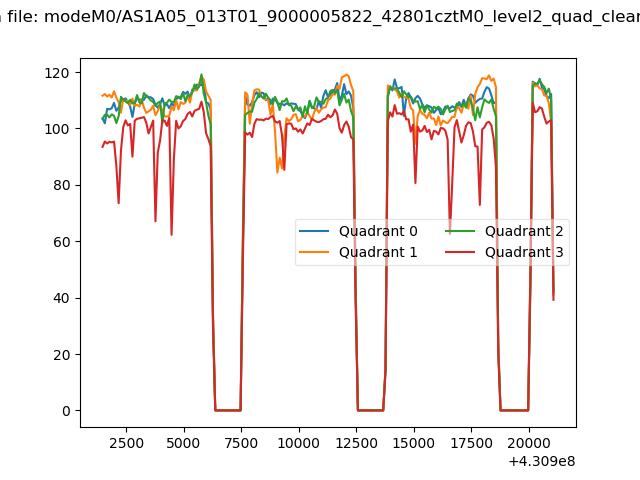 |
|
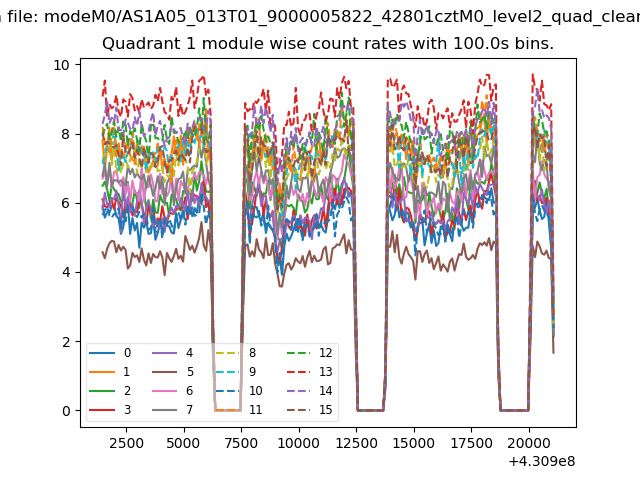
| Module-wise count rates for Quadrant A Data is divided into 100 sec bins |
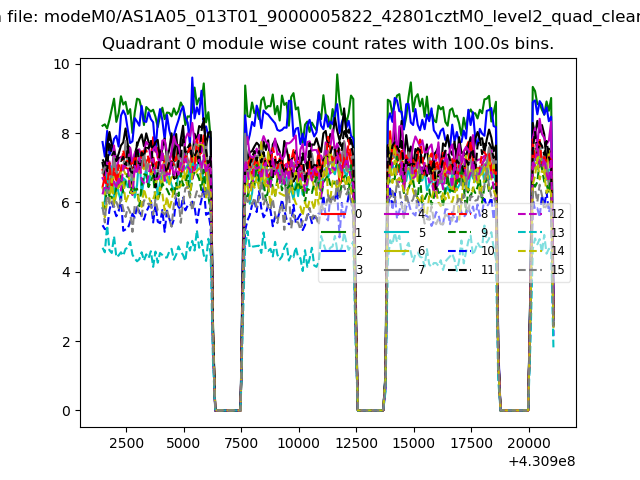 |
 |
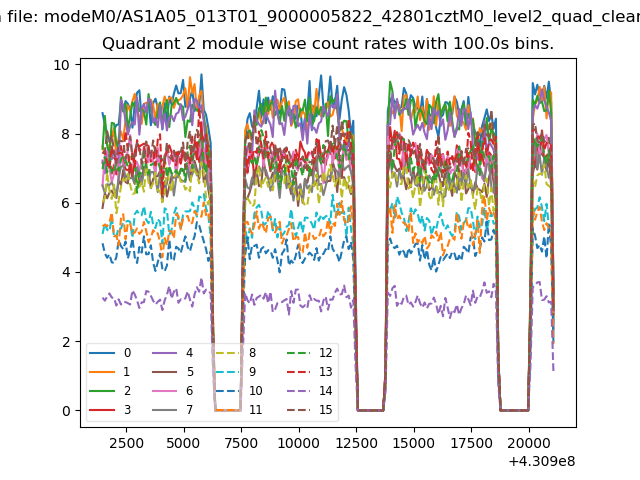
| Module-wise count rates for Quadrant B Data is divided into 100 sec bins |
 |
 |
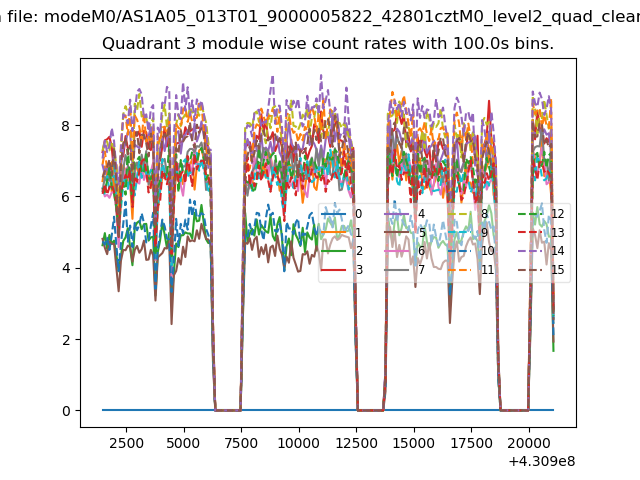
| Module-wise count rates for Quadrant C Data is divided into 100 sec bins |
 |
 |
| Module-wise count rates for Quadrant D Data is divided into 100 sec bins |
 |
 |
| Parameter | Plot |
|---|---|
| CZT HV Monitor | 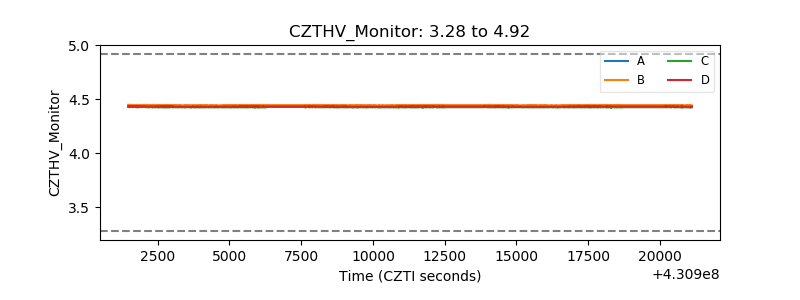 |
| D_VDD | 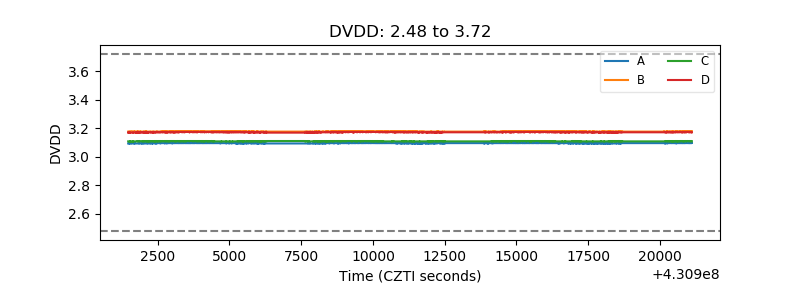 |
| Temperature 1 | 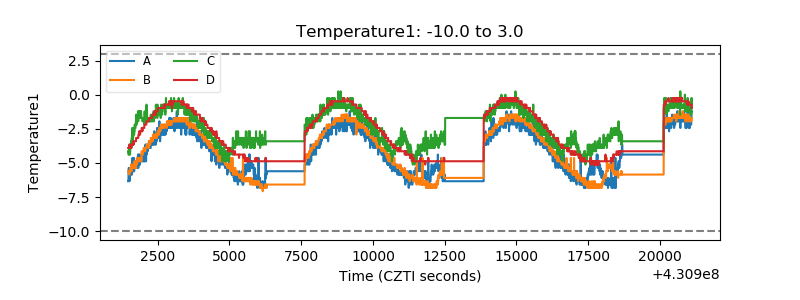 |
| Veto HV Monitor | 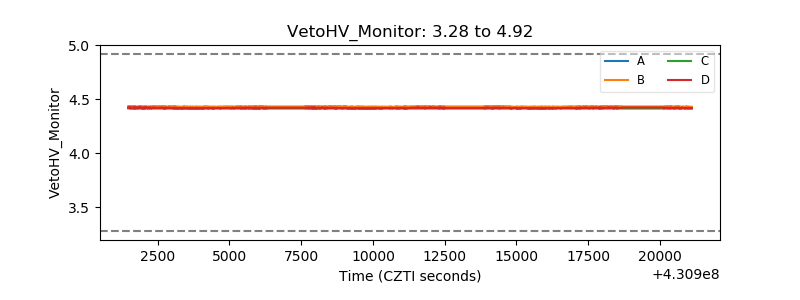 |
| Veto LLD | 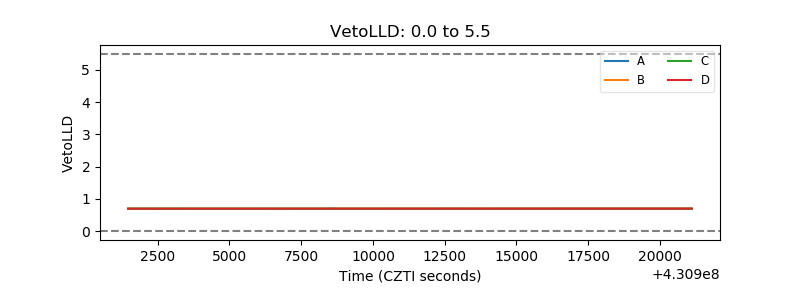 |
| Alpha Counter | 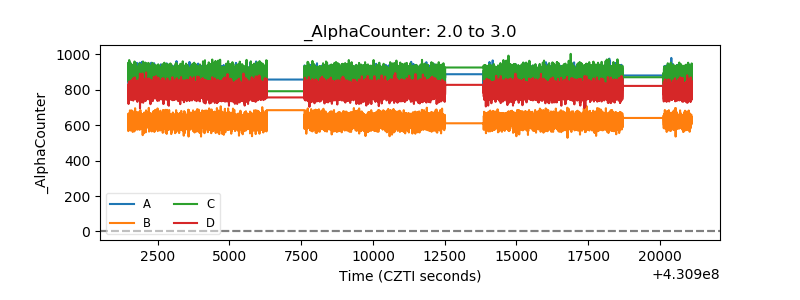 |
| _CPM_Rate | 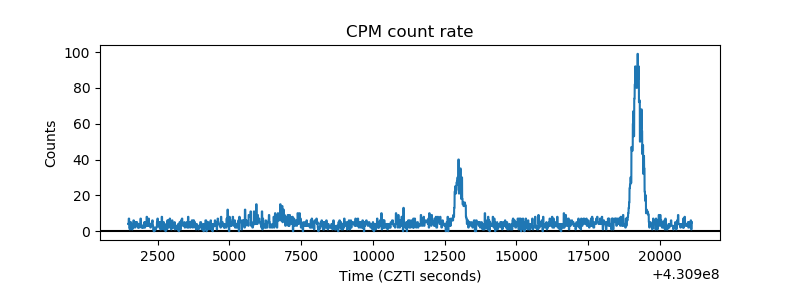 |
| CZT Counter | 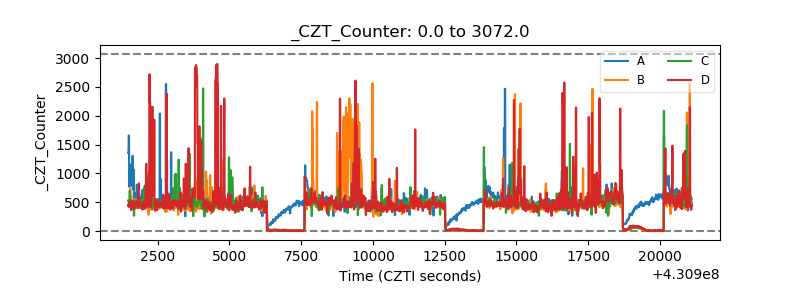 |
| +2.5 Volts monitor | 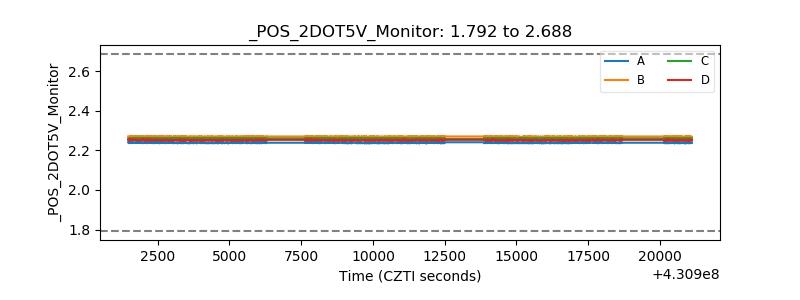 |
| +5 Volts monitor | 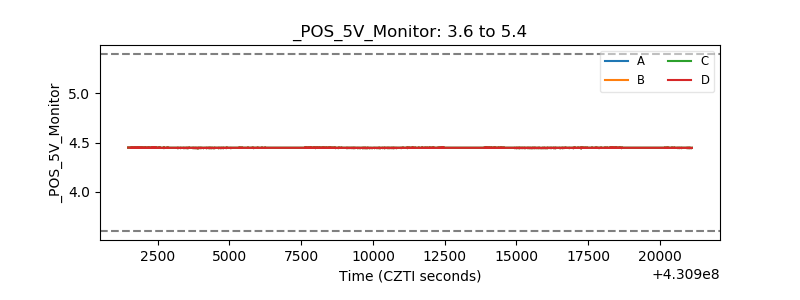 |
| _ROLL_ROT | 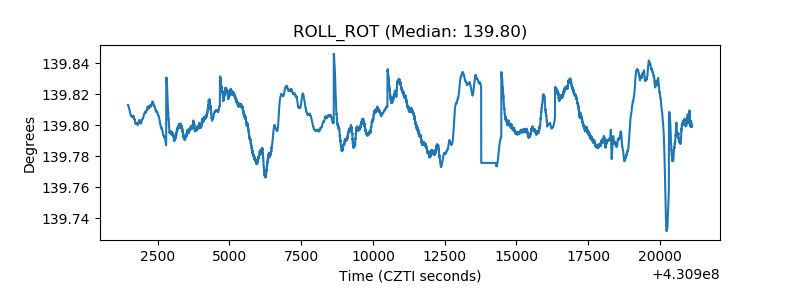 |
| _Roll_DEC | 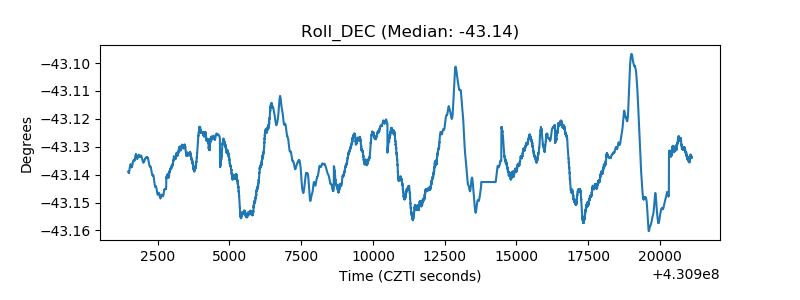 |
| _Roll_RA | 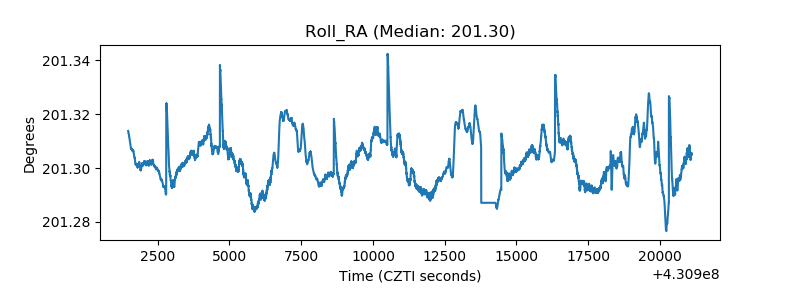 |
| Veto Counter | 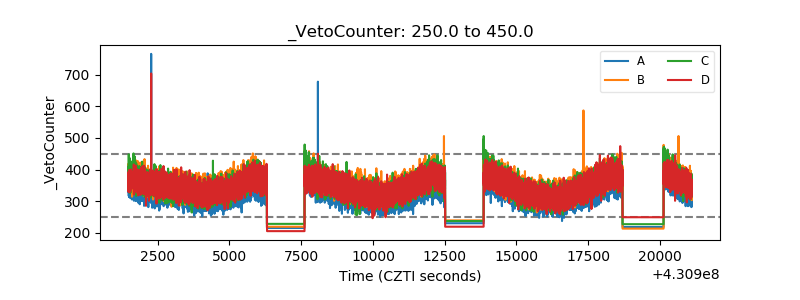 |