| Param | Original file | Final file |
|---|---|---|
| Filename | modeM0/AS1A05_013T01_9000005822_42802cztM0_level2.fits | modeM0/AS1A05_013T01_9000005822_42802cztM0_level2_quad_clean.evt |
| Size (bytes) | 127,082,880 | 35,766,720 |
| Size | 121.2 MB | 34.1 MB |
| Events in quadrant A | 1,247,256 | 237,976 |
| Events in quadrant B | 966,859 | 231,924 |
| Events in quadrant C | 1,087,332 | 238,134 |
| Events in quadrant D | 1,235,214 | 221,730 |
| Mode M0 | |||
|---|---|---|---|
| Quadrant | BADHDUFLAG | Total packets | Discarded packets |
| A | 0 | 5009 | 1 |
| B | 0 | 4421 | 1 |
| C | 0 | 4556 | 1 |
| D | 0 | 5122 | 1 |
| Mode M9 | |||
|---|---|---|---|
| Quadrant | BADHDUFLAG | Total packets | Discarded packets |
| A | 1 | 139778384570408 | 139775415681070 |
| B | 1 | -1 | -1 |
| C | 1 | -1 | -1 |
| D | 1 | -1 | -1 |
| Mode SS | |||
|---|---|---|---|
| Quadrant | BADHDUFLAG | Total packets | Discarded packets |
| A | 0 | 42 | 0 |
| B | 0 | 42 | 0 |
| C | 0 | 42 | 0 |
| D | 0 | 42 | 0 |
| Quadrant | Total seconds | Saturated seconds | Saturation percentage |
|---|---|---|---|
| A | 2118 | 16 | 0.755430% |
| B | 2118 | 10 | 0.472144% |
| C | 2118 | 13 | 0.613787% |
| D | 2118 | 12 | 0.566572% |
Noise dominated data is calculated using 1-second bins in cleaned event files. If a bin has >2000 counts, and if more than 50% of those come from <1% of pixels, then it is considered to be noise-dominated and hence unusable.
| Quadrant | # 1 sec bins | Bins with >0 counts | Bins with >2000 counts | High rate bins dominated by noise | Noise dominated (total time) | Noise dominated (detector-on time) | Marked lightcurve |
|---|---|---|---|---|---|---|---|
| A | 2118 | 2118 | 15 | 15 | 0.71% | 0.71% | 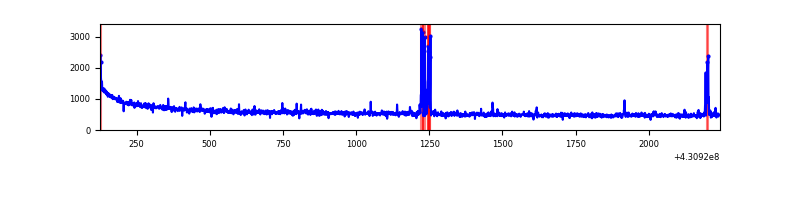 |
| B | 2118 | 2118 | 7 | 7 | 0.33% | 0.33% | 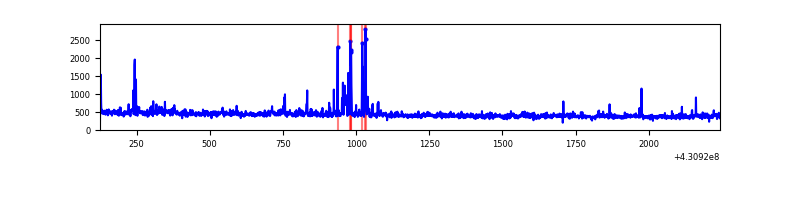 |
| C | 2118 | 2118 | 16 | 16 | 0.76% | 0.76% | 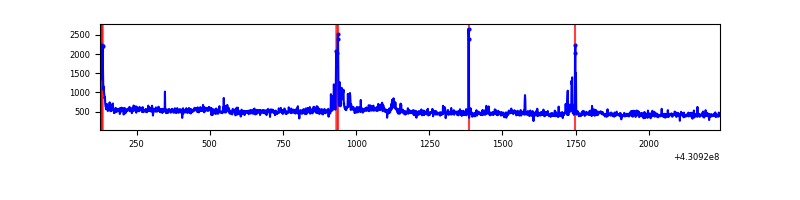 |
| D | 2118 | 2118 | 16 | 16 | 0.76% | 0.76% | 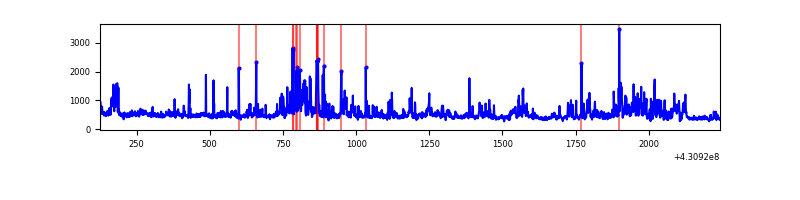 |
Top three noisy pixels from each quadrant. If the there are fewer than three noisy pixels in the level2.evt file, extra rows are filled as -1
| Pixel properties | Quadrant properties | ||||||
|---|---|---|---|---|---|---|---|
| Quadrant | DetID | PixID | Counts | Sigma | Mean | Median | Sigma |
| A | 10 | 83 | 281831 | 5764.0 | 230 | 225 | 48.9 |
| A | 13 | 248 | 66853 | 1363.76 | 230 | 225 | 48.9 |
| A | 13 | 6 | 4791 | 93.46 | 230 | 225 | 48.9 |
| B | 15 | 85 | 30345 | 659.93 | 222 | 216 | 45.7 |
| B | 0 | 245 | 17550 | 379.67 | 222 | 216 | 45.7 |
| B | 5 | 172 | 15209 | 328.4 | 222 | 216 | 45.7 |
| C | 15 | 214 | 87681 | 1635.52 | 220 | 221 | 53.5 |
| C | 3 | 233 | 76715 | 1430.45 | 220 | 221 | 53.5 |
| C | 14 | 254 | 61590 | 1147.61 | 220 | 221 | 53.5 |
| D | 2 | 249 | 150146 | 2643.17 | 224 | 218 | 56.7 |
| D | 1 | 52 | 104345 | 1835.72 | 224 | 218 | 56.7 |
| D | 5 | 171 | 61486 | 1080.13 | 224 | 218 | 56.7 |
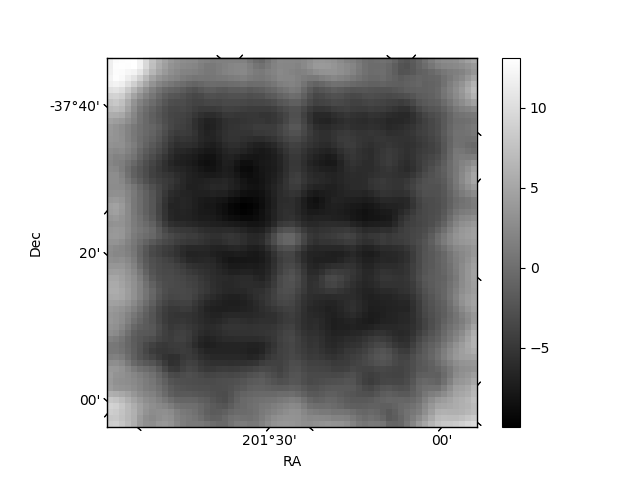
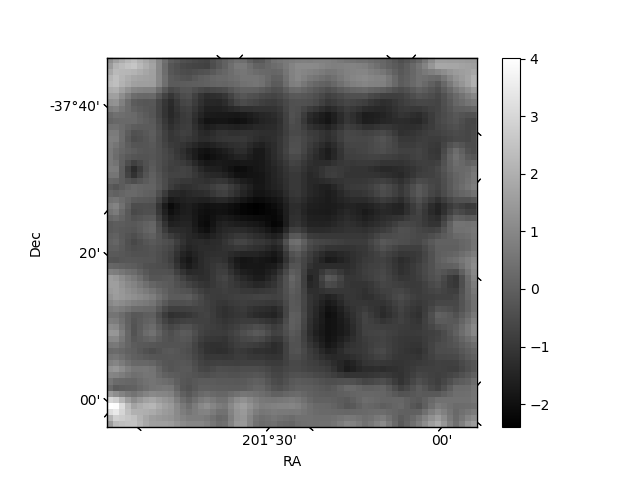
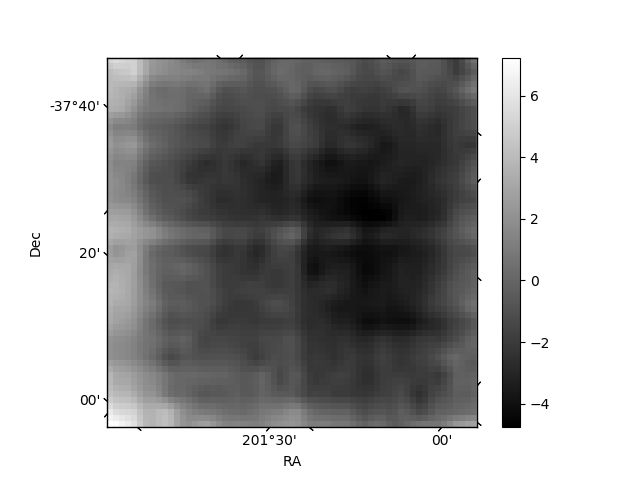
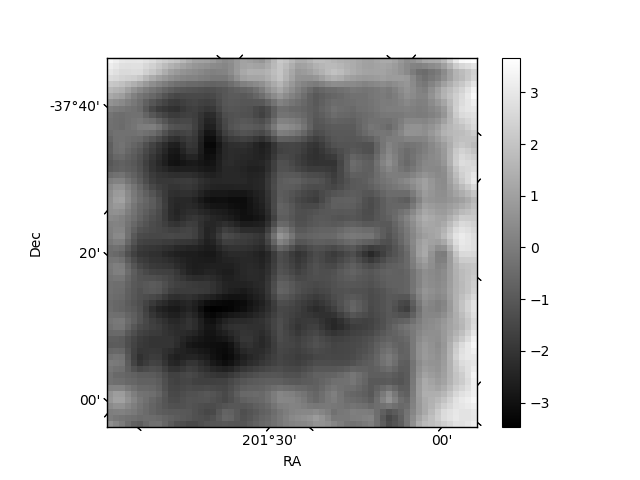
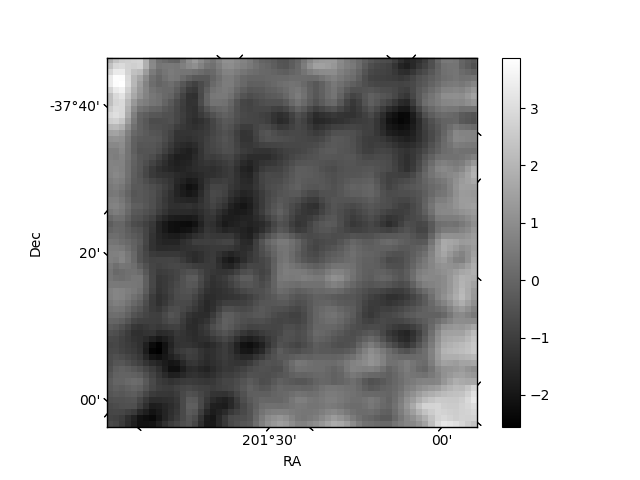
Histogram calculated using DETX and DETY for each event in the final _common_clean file
| Quadrant A | 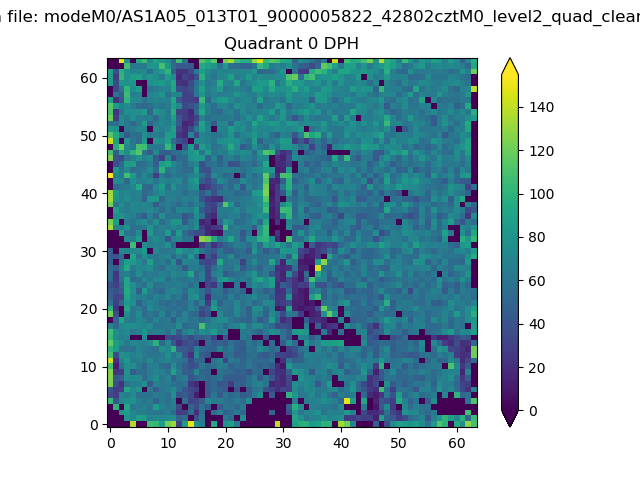 |
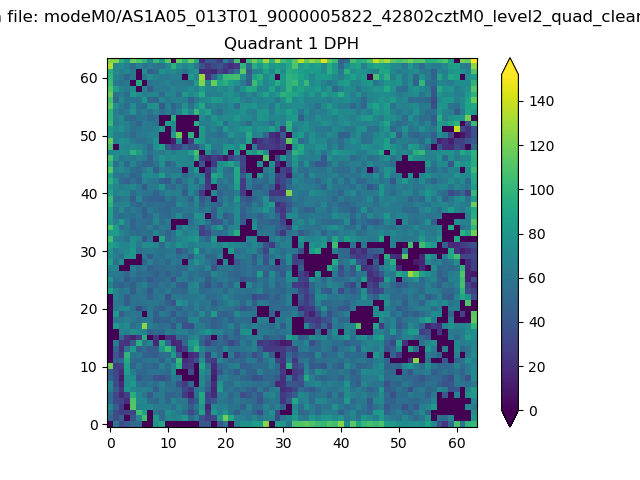 |
Quadrant B |
|---|---|---|---|
| Quadrant D | 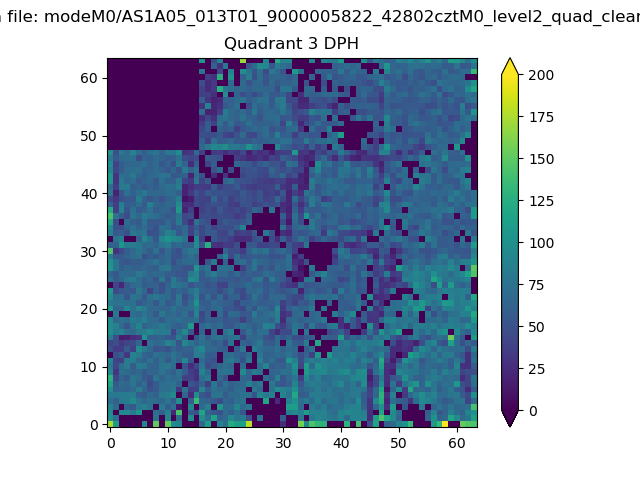 |
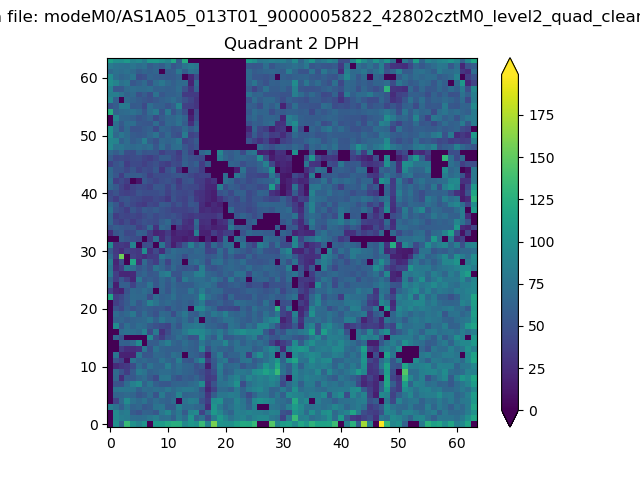 |
Quadrant C |
| Plot type | Count rate plots | Images |
|---|---|---|
| Comparison with Poisson distribution Blue bars denote a histogram of data divided into 1 sec bins. Red curve is a Poisson curve with rate = median count rate of data. |
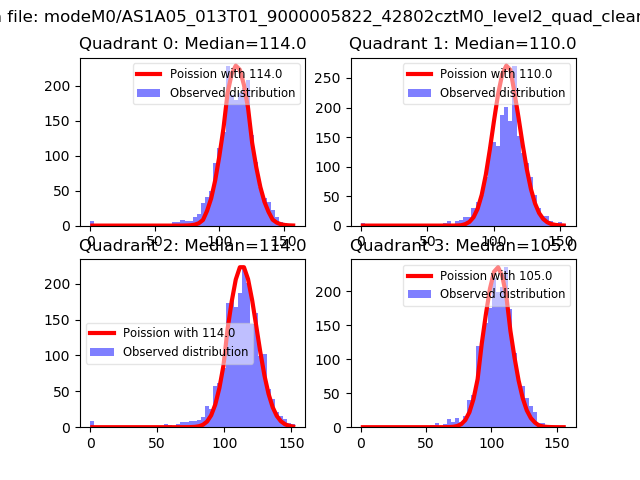 |
 |
| Quadrant-wise count rates Data is divided into 100 sec bins |
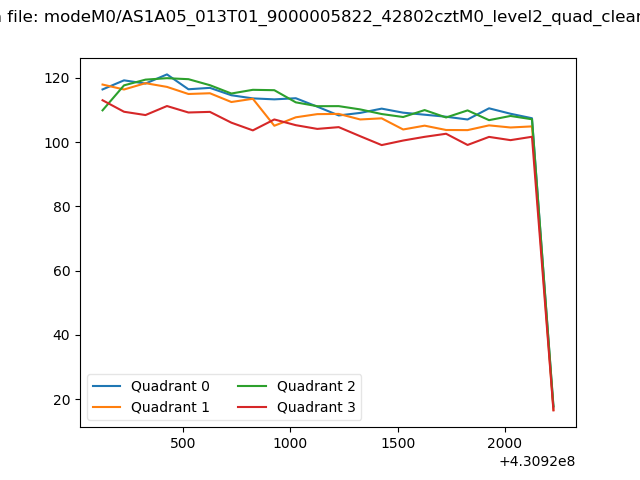 |
|
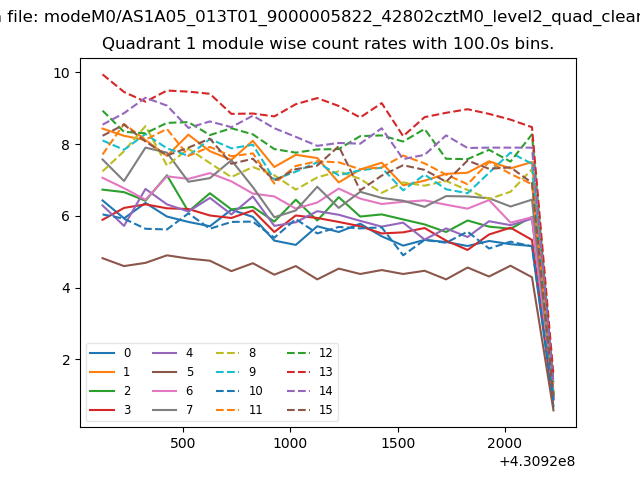
| Module-wise count rates for Quadrant A Data is divided into 100 sec bins |
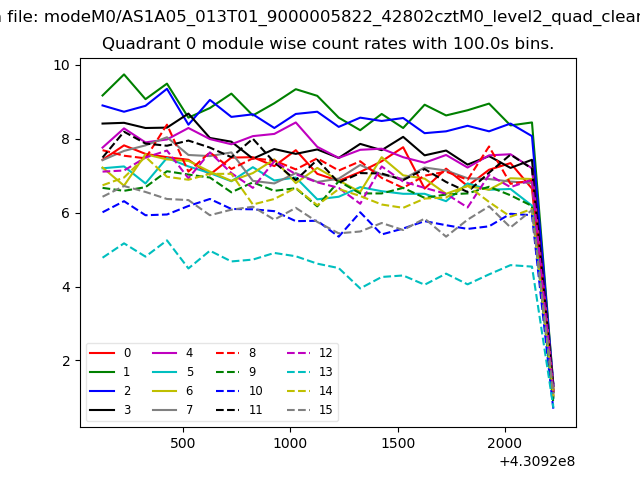 |
 |
| Module-wise count rates for Quadrant B Data is divided into 100 sec bins |
 |
 |
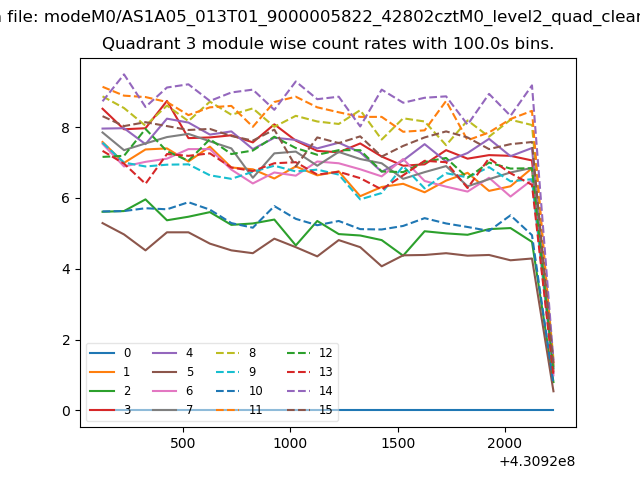
| Module-wise count rates for Quadrant C Data is divided into 100 sec bins |
 |
 |
| Module-wise count rates for Quadrant D Data is divided into 100 sec bins |
 |
 |
| Parameter | Plot |
|---|---|
| CZT HV Monitor | 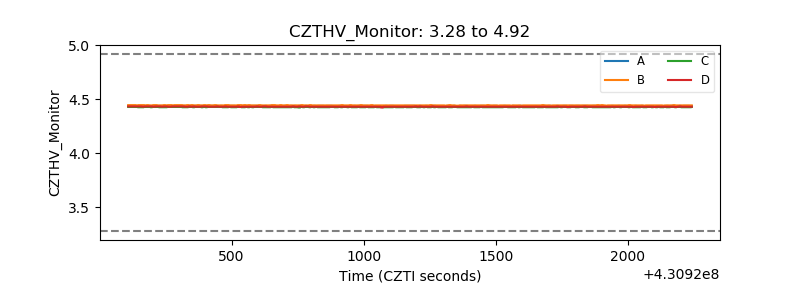 |
| D_VDD | 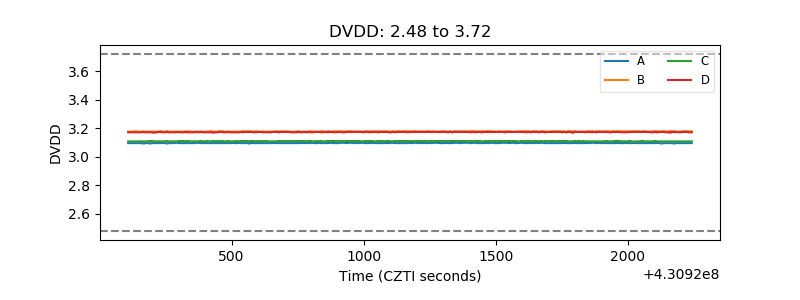 |
| Temperature 1 | 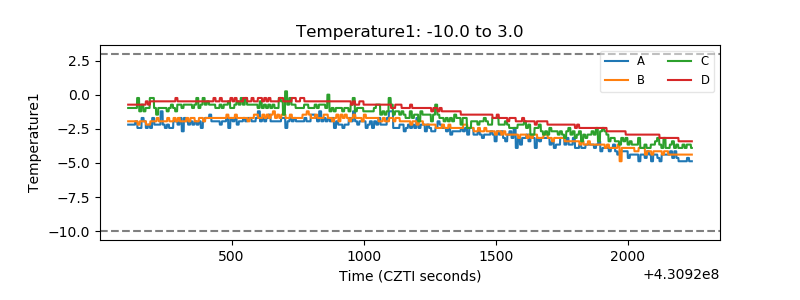 |
| Veto HV Monitor | 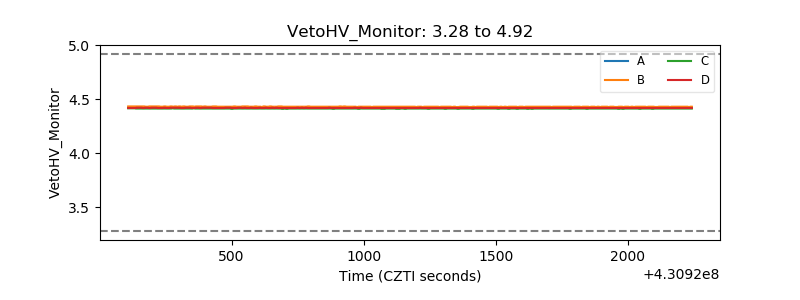 |
| Veto LLD | 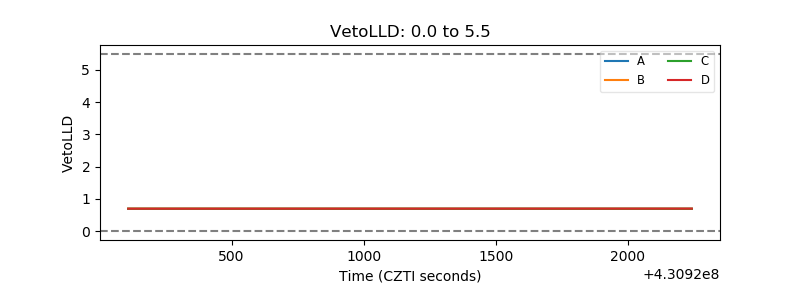 |
| Alpha Counter | 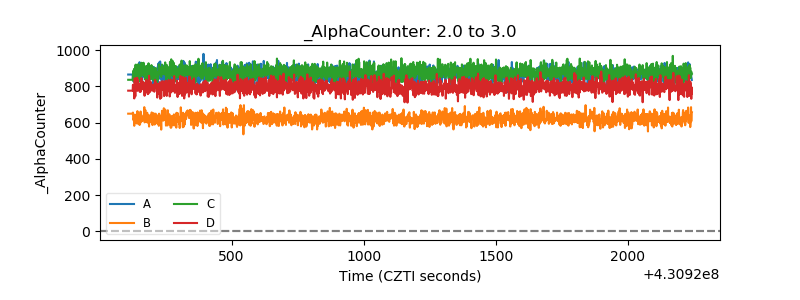 |
| _CPM_Rate | 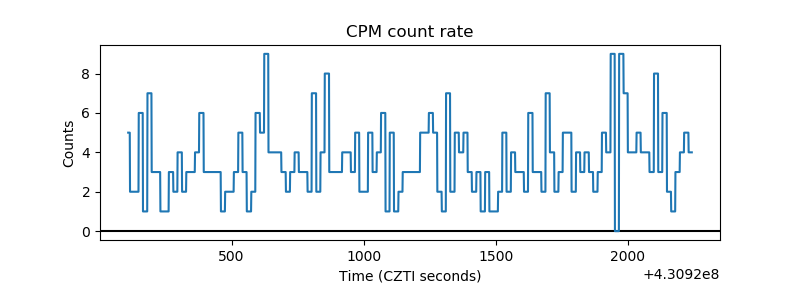 |
| CZT Counter | 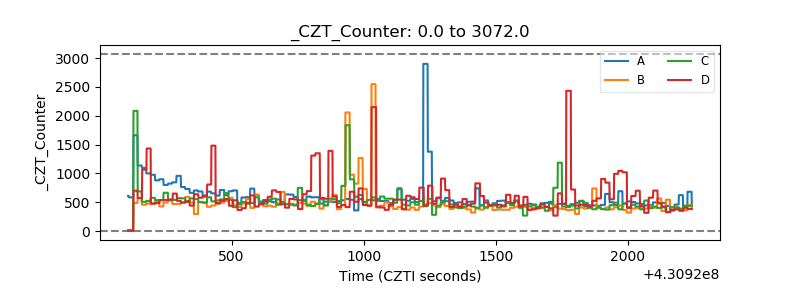 |
| +2.5 Volts monitor | 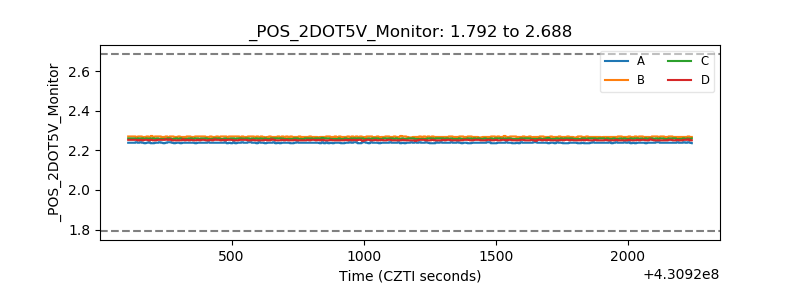 |
| +5 Volts monitor | 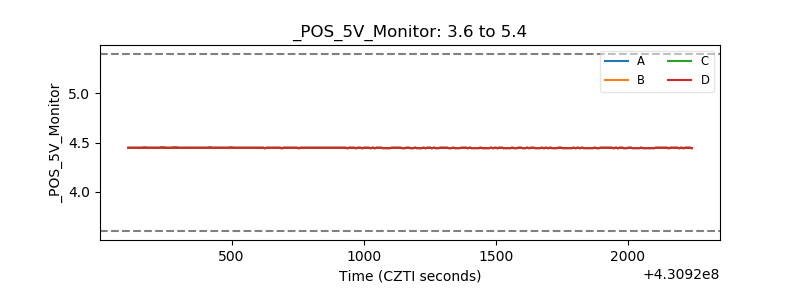 |
| _ROLL_ROT | 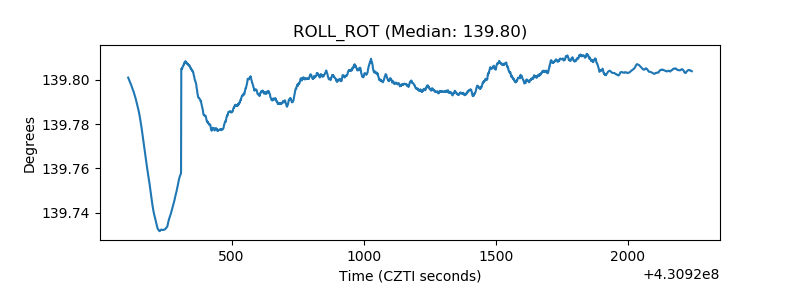 |
| _Roll_DEC | 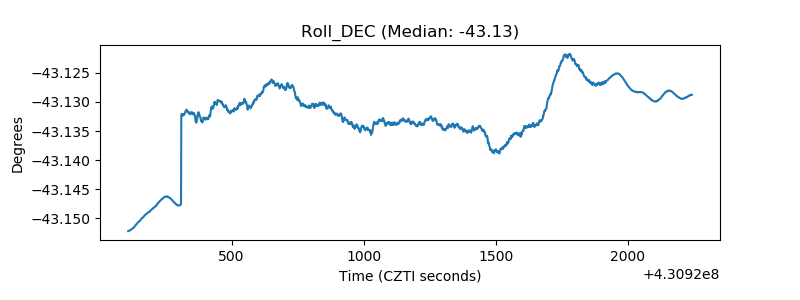 |
| _Roll_RA | 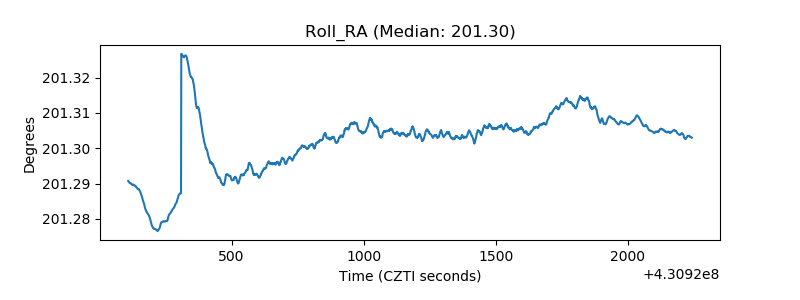 |
| Veto Counter | 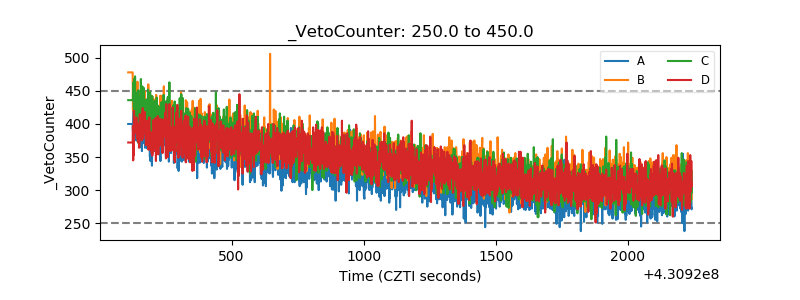 |