| Param | Original file | Final file |
|---|---|---|
| Filename | modeM0/AS1C06_010T01_9000005824_42802cztM0_level2.fits | modeM0/AS1C06_010T01_9000005824_42802cztM0_level2_quad_clean.evt |
| Size (bytes) | 144,688,320 | 36,443,520 |
| Size | 138.0 MB | 34.8 MB |
| Events in quadrant A | 1,242,678 | 244,733 |
| Events in quadrant B | 1,097,294 | 251,963 |
| Events in quadrant C | 1,151,007 | 234,787 |
| Events in quadrant D | 1,693,350 | 214,571 |
| Mode M9 | |||
|---|---|---|---|
| Quadrant | BADHDUFLAG | Total packets | Discarded packets |
| A | 0 | 15 | 0 |
| B | 0 | 15 | 0 |
| C | 0 | 15 | 0 |
| D | 0 | 15 | 0 |
| Mode M0 | |||
|---|---|---|---|
| Quadrant | BADHDUFLAG | Total packets | Discarded packets |
| A | 0 | 5030 | 1 |
| B | 0 | 4677 | 1 |
| C | 0 | 4714 | 1 |
| D | 0 | 6532 | 1 |
| Mode SS | |||
|---|---|---|---|
| Quadrant | BADHDUFLAG | Total packets | Discarded packets |
| A | 0 | 46 | 0 |
| B | 0 | 46 | 0 |
| C | 0 | 46 | 0 |
| D | 0 | 46 | 0 |
| Quadrant | Total seconds | Saturated seconds | Saturation percentage |
|---|---|---|---|
| A | 2174 | 17 | 0.781969% |
| B | 2174 | 15 | 0.689972% |
| C | 2174 | 11 | 0.505980% |
| D | 2174 | 103 | 4.737810% |
Noise dominated data is calculated using 1-second bins in cleaned event files. If a bin has >2000 counts, and if more than 50% of those come from <1% of pixels, then it is considered to be noise-dominated and hence unusable.
| Quadrant | # 1 sec bins | Bins with >0 counts | Bins with >2000 counts | High rate bins dominated by noise | Noise dominated (total time) | Noise dominated (detector-on time) | Marked lightcurve |
|---|---|---|---|---|---|---|---|
| A | 3757 | 2175 | 3 | 3 | 0.08% | 0.14% | 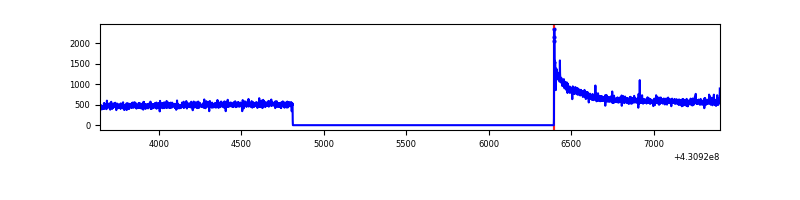 |
| B | 3757 | 2175 | 6 | 6 | 0.16% | 0.28% | 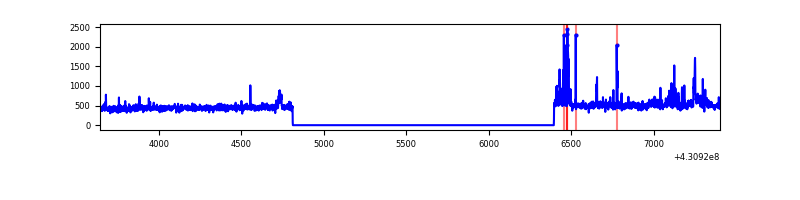 |
| C | 3757 | 2175 | 9 | 9 | 0.24% | 0.41% | 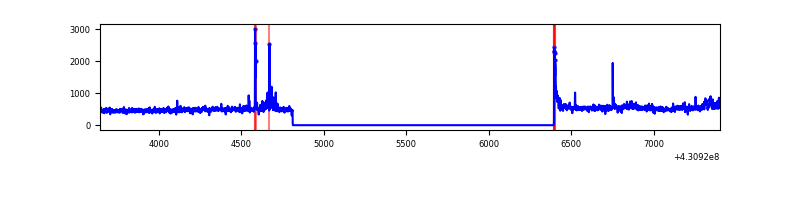 |
| D | 3757 | 2175 | 84 | 84 | 2.24% | 3.86% | 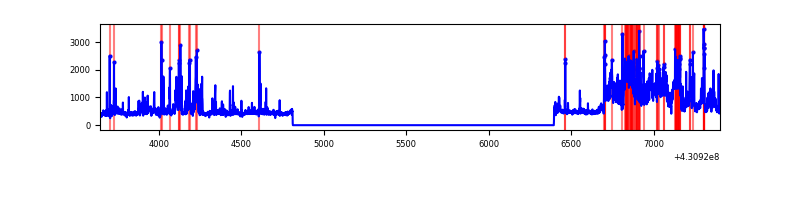 |
Top three noisy pixels from each quadrant. If the there are fewer than three noisy pixels in the level2.evt file, extra rows are filled as -1
| Pixel properties | Quadrant properties | ||||||
|---|---|---|---|---|---|---|---|
| Quadrant | DetID | PixID | Counts | Sigma | Mean | Median | Sigma |
| A | 10 | 83 | 272888 | 5170.73 | 247 | 242 | 52.7 |
| A | 12 | 189 | 2901 | 50.43 | 247 | 242 | 52.7 |
| A | 3 | 137 | 2738 | 47.34 | 247 | 242 | 52.7 |
| B | 5 | 172 | 38658 | 769.54 | 247 | 240 | 49.9 |
| B | 0 | 245 | 30003 | 596.17 | 247 | 240 | 49.9 |
| B | 0 | 230 | 11209 | 219.72 | 247 | 240 | 49.9 |
| C | 3 | 233 | 102377 | 1792.84 | 238 | 239 | 57.0 |
| C | 15 | 214 | 89227 | 1562.02 | 238 | 239 | 57.0 |
| C | 14 | 254 | 29620 | 515.73 | 238 | 239 | 57.0 |
| D | 1 | 52 | 422337 | 7084.06 | 235 | 228 | 59.6 |
| D | 2 | 249 | 208137 | 3489.24 | 235 | 228 | 59.6 |
| D | 10 | 118 | 44154 | 737.19 | 235 | 228 | 59.6 |
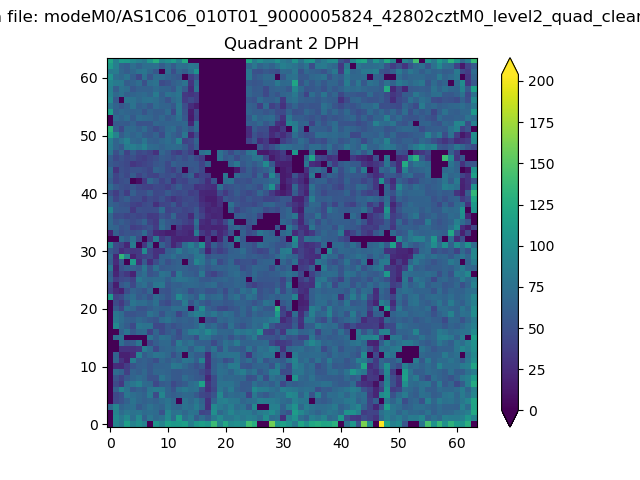
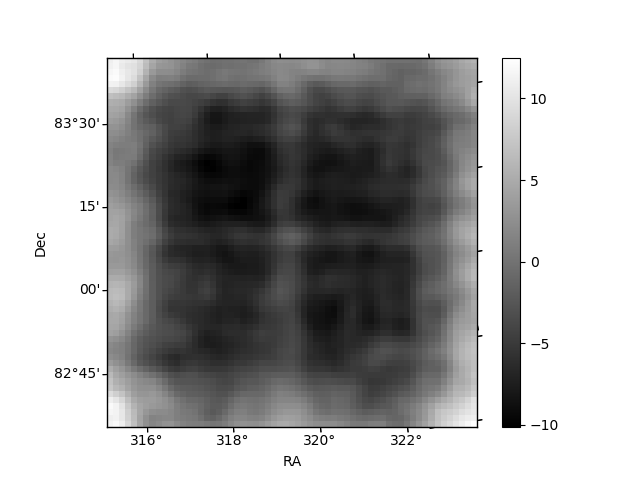
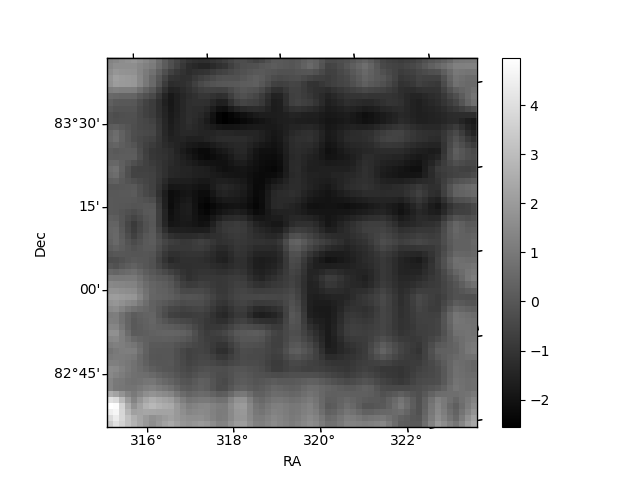
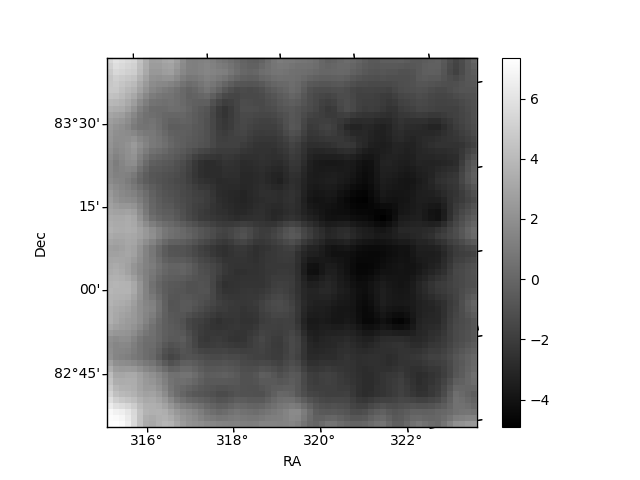
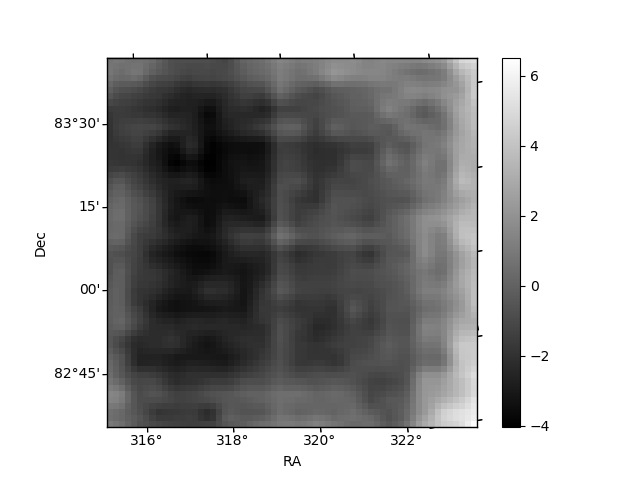
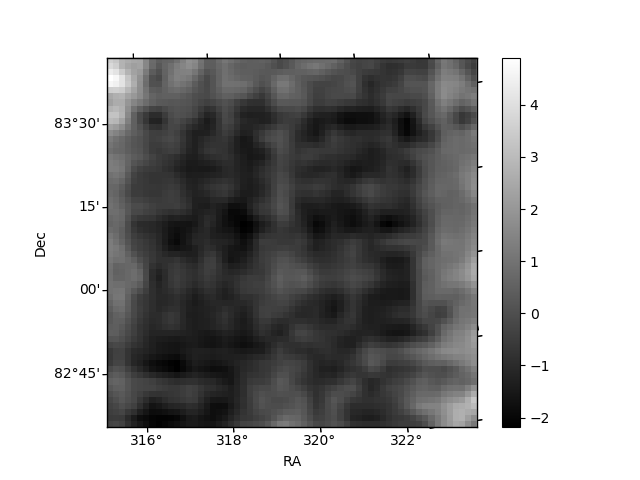
Histogram calculated using DETX and DETY for each event in the final _common_clean file
| Quadrant A | 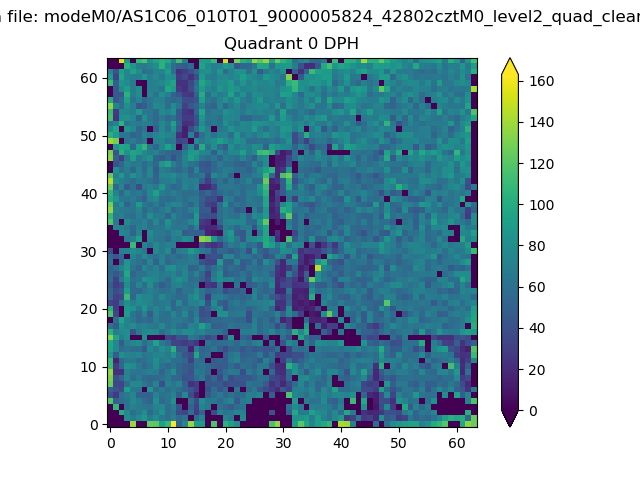 |
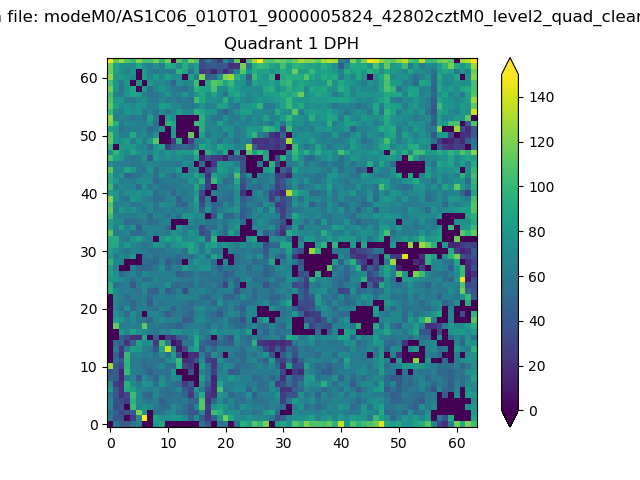 |
Quadrant B |
|---|---|---|---|
| Quadrant D | 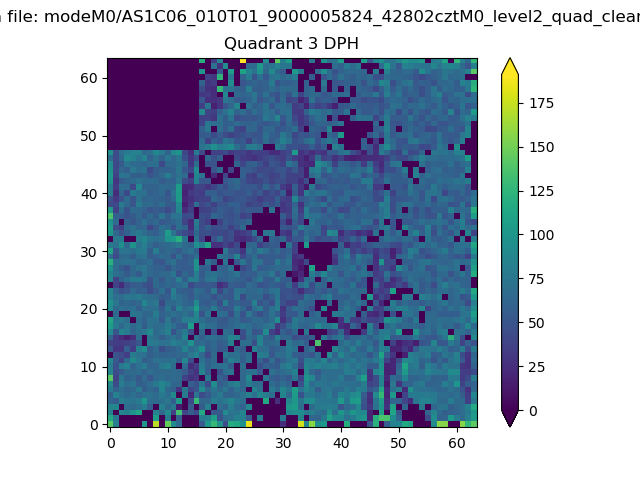 |
 |
Quadrant C |
| Plot type | Count rate plots | Images |
|---|---|---|
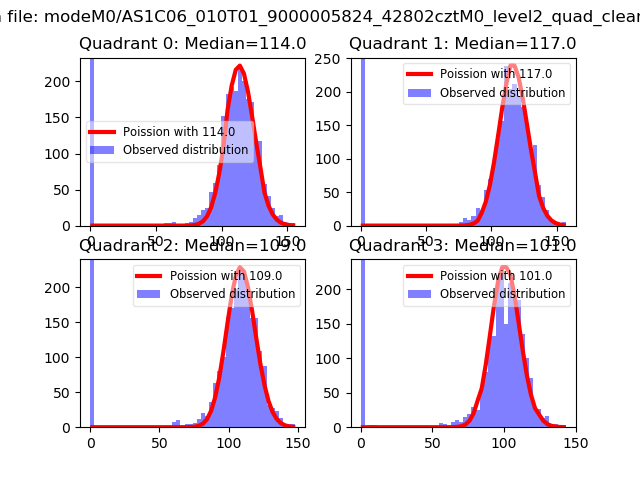
| Comparison with Poisson distribution Blue bars denote a histogram of data divided into 1 sec bins. Red curve is a Poisson curve with rate = median count rate of data. |
 |
 |
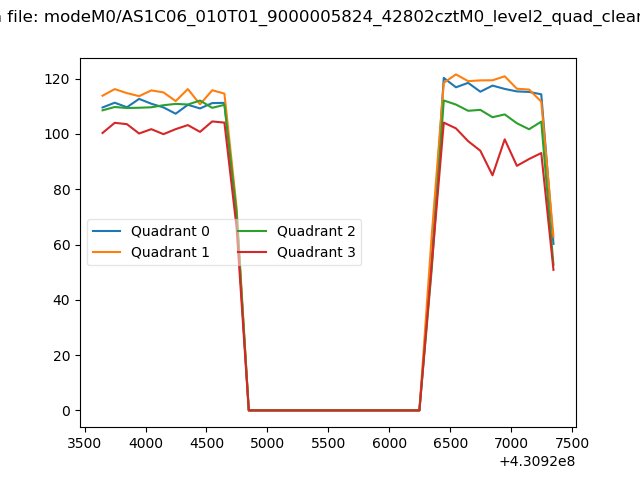
| Quadrant-wise count rates Data is divided into 100 sec bins |
 |
|
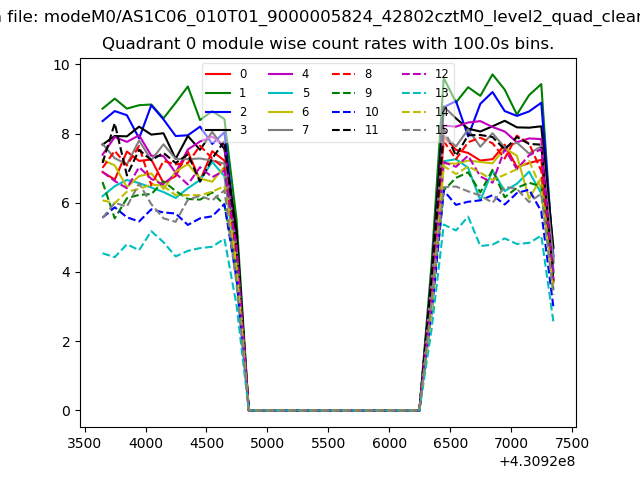
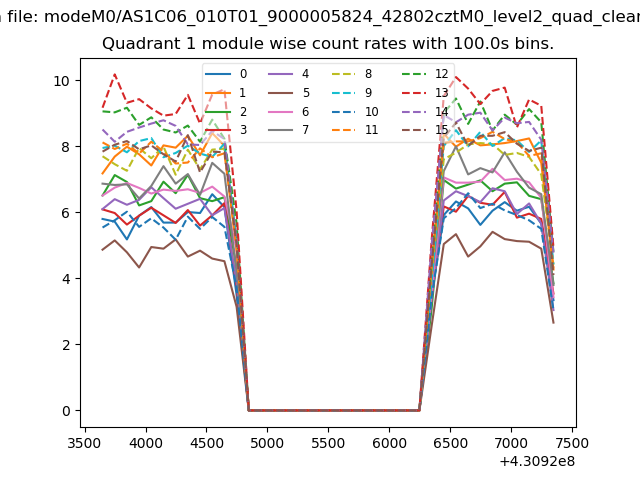
| Module-wise count rates for Quadrant A Data is divided into 100 sec bins |
 |
 |
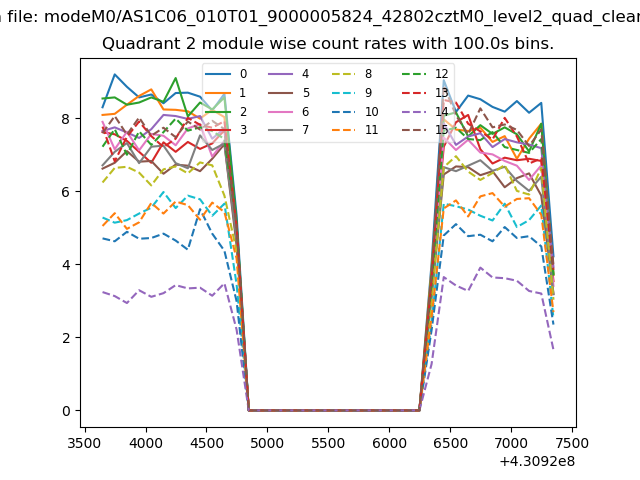
| Module-wise count rates for Quadrant B Data is divided into 100 sec bins |
 |
 |
| Module-wise count rates for Quadrant C Data is divided into 100 sec bins |
 |
 |
| Module-wise count rates for Quadrant D Data is divided into 100 sec bins |
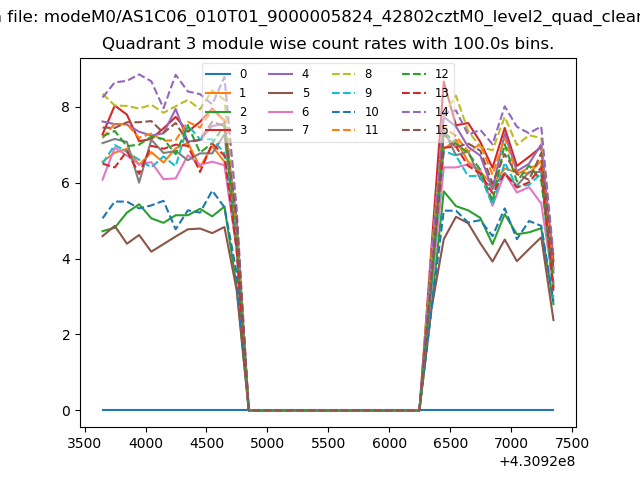 |
 |
| Parameter | Plot |
|---|---|
| CZT HV Monitor | 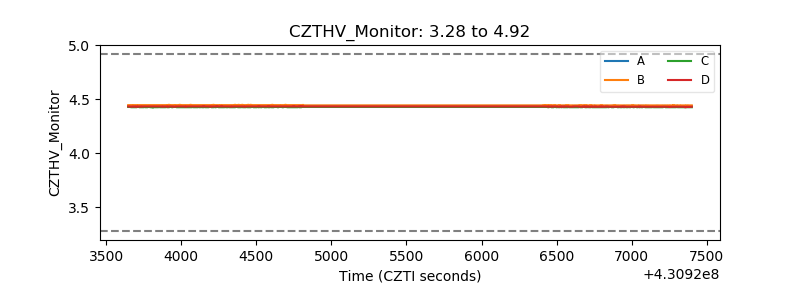 |
| D_VDD | 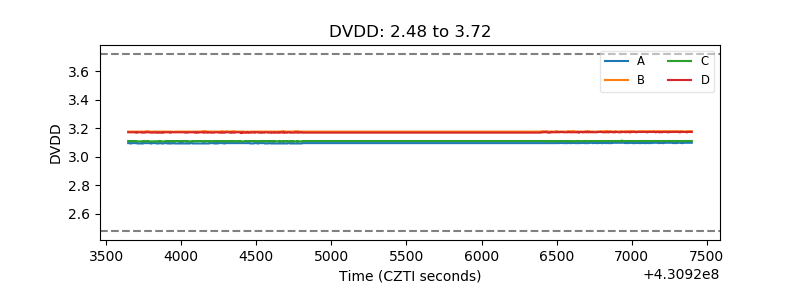 |
| Temperature 1 | 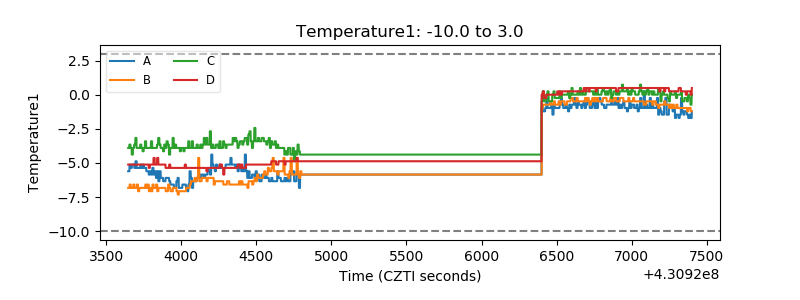 |
| Veto HV Monitor | 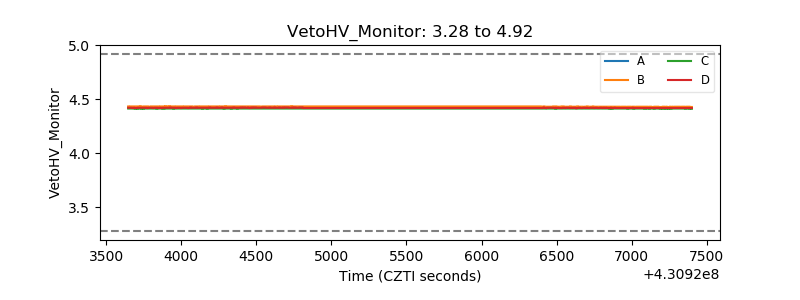 |
| Veto LLD | 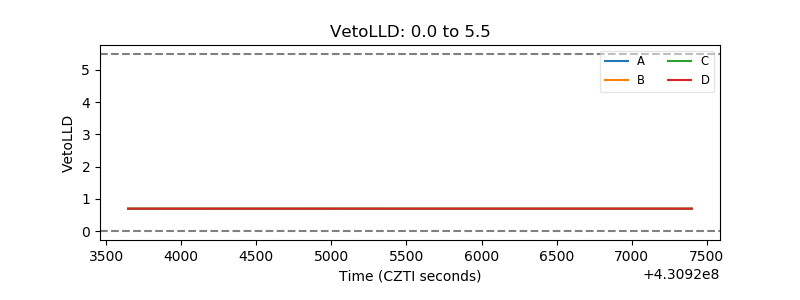 |
| Alpha Counter | 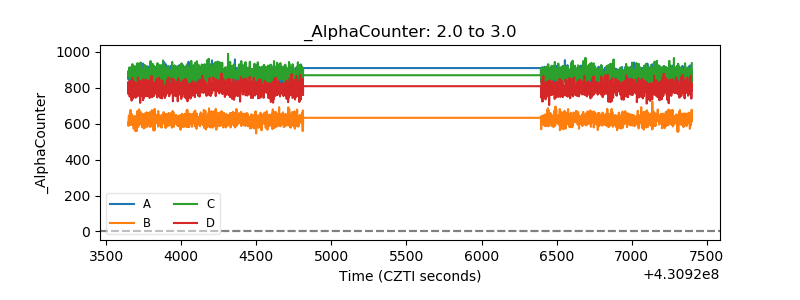 |
| _CPM_Rate | 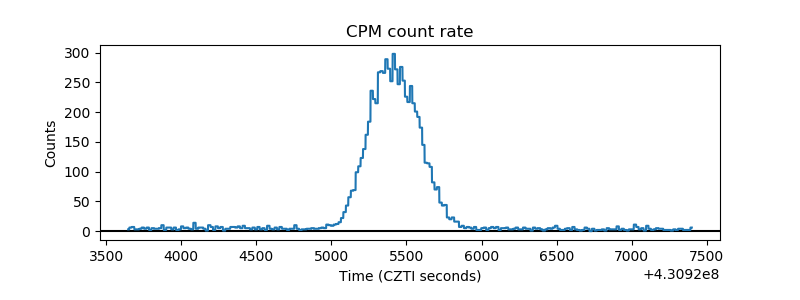 |
| CZT Counter | 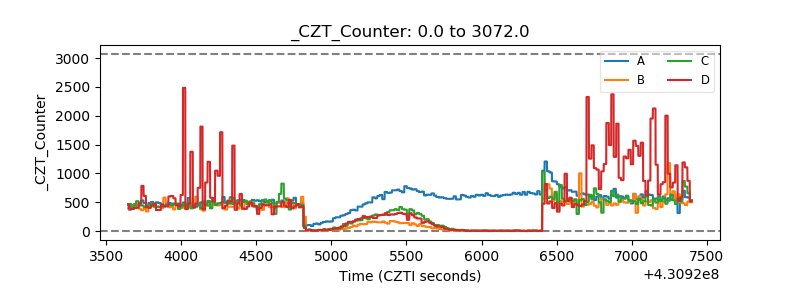 |
| +2.5 Volts monitor |  |
| +5 Volts monitor | 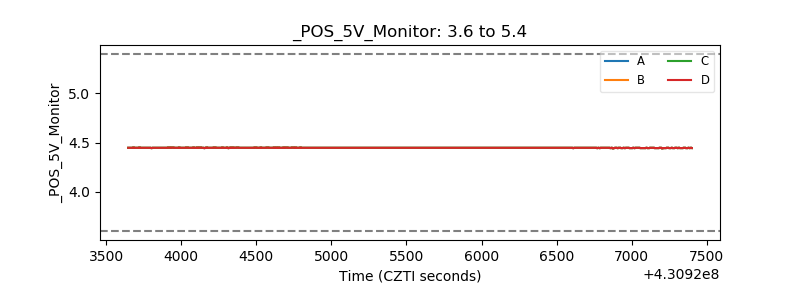 |
| _ROLL_ROT | 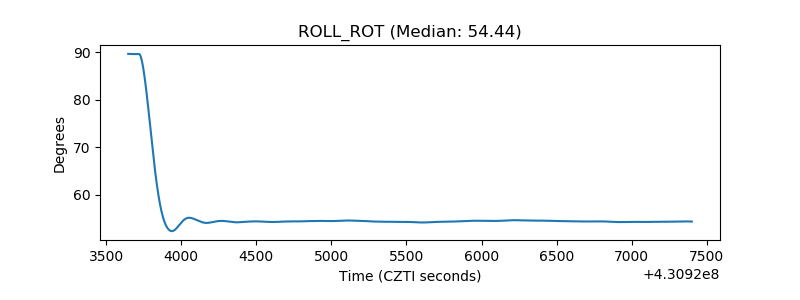 |
| _Roll_DEC | 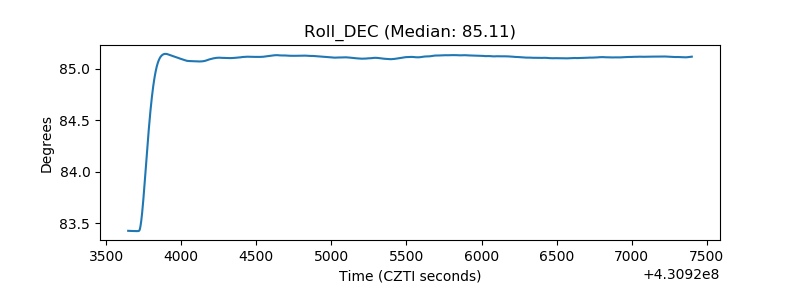 |
| _Roll_RA | 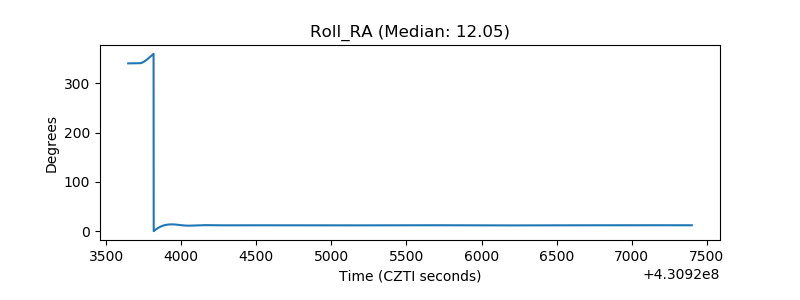 |
| Veto Counter | 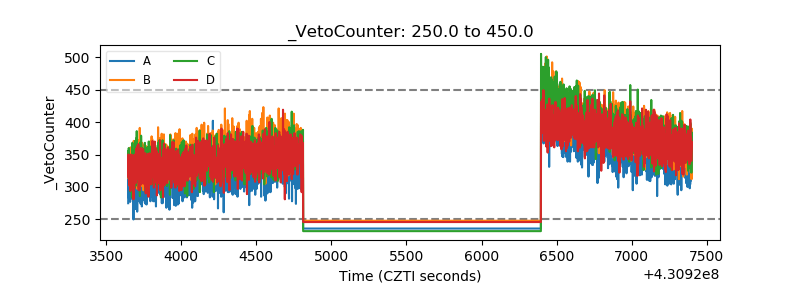 |