| Param | Original file | Final file |
|---|---|---|
| Filename | modeM0/AS1C06_010T01_9000005824_42803cztM0_level2.fits | modeM0/AS1C06_010T01_9000005824_42803cztM0_level2_quad_clean.evt |
| Size (bytes) | 379,696,320 | 84,231,360 |
| Size | 362.1 MB | 80.3 MB |
| Events in quadrant A | 2,834,656 | 584,968 |
| Events in quadrant B | 4,199,897 | 530,536 |
| Events in quadrant C | 2,900,632 | 556,220 |
| Events in quadrant D | 3,714,447 | 513,559 |
| Mode M9 | |||
|---|---|---|---|
| Quadrant | BADHDUFLAG | Total packets | Discarded packets |
| A | 0 | 17 | 0 |
| B | 0 | 17 | 0 |
| C | 0 | 17 | 0 |
| D | 0 | 17 | 0 |
| Mode M0 | |||
|---|---|---|---|
| Quadrant | BADHDUFLAG | Total packets | Discarded packets |
| A | 0 | 11664 | 1 |
| B | 0 | 15986 | 1 |
| C | 0 | 11962 | 1 |
| D | 0 | 14788 | 1 |
| Mode SS | |||
|---|---|---|---|
| Quadrant | BADHDUFLAG | Total packets | Discarded packets |
| A | 0 | 106 | 0 |
| B | 0 | 106 | 0 |
| C | 0 | 106 | 0 |
| D | 0 | 106 | 0 |
| Quadrant | Total seconds | Saturated seconds | Saturation percentage |
|---|---|---|---|
| A | 5210 | 18 | 0.345489% |
| B | 5211 | 656 | 12.588755% |
| C | 5211 | 19 | 0.364613% |
| D | 5211 | 185 | 3.550182% |
Noise dominated data is calculated using 1-second bins in cleaned event files. If a bin has >2000 counts, and if more than 50% of those come from <1% of pixels, then it is considered to be noise-dominated and hence unusable.
| Quadrant | # 1 sec bins | Bins with >0 counts | Bins with >2000 counts | High rate bins dominated by noise | Noise dominated (total time) | Noise dominated (detector-on time) | Marked lightcurve |
|---|---|---|---|---|---|---|---|
| A | 6914 | 5211 | 8 | 8 | 0.12% | 0.15% | 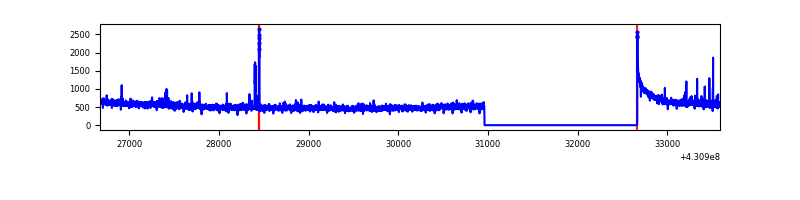 |
| B | 6915 | 5211 | 640 | 640 | 9.26% | 12.28% | 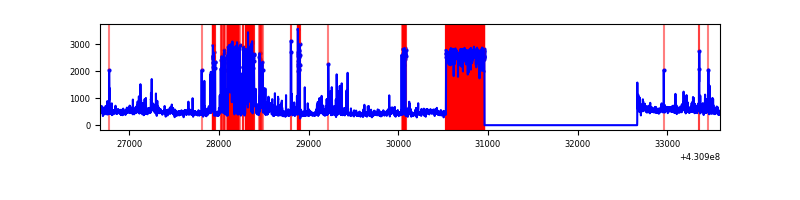 |
| C | 6915 | 5212 | 12 | 12 | 0.17% | 0.23% | 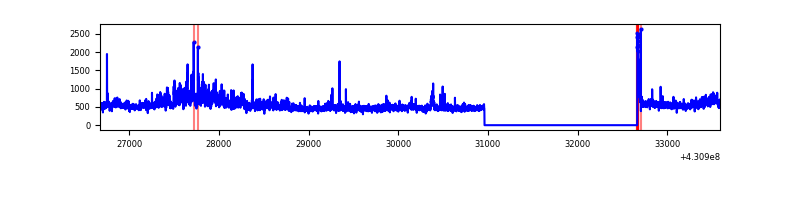 |
| D | 6915 | 5212 | 164 | 164 | 2.37% | 3.15% | 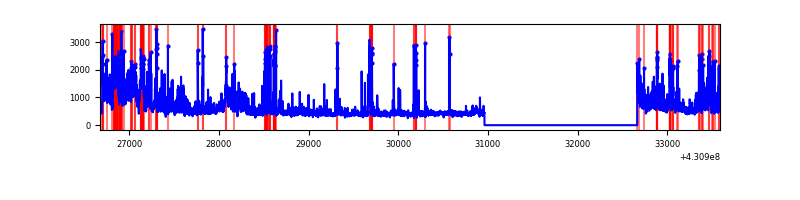 |
Top three noisy pixels from each quadrant. If the there are fewer than three noisy pixels in the level2.evt file, extra rows are filled as -1
| Pixel properties | Quadrant properties | ||||||
|---|---|---|---|---|---|---|---|
| Quadrant | DetID | PixID | Counts | Sigma | Mean | Median | Sigma |
| A | 10 | 83 | 570075 | 4910.13 | 565 | 554 | 116.0 |
| A | 15 | 223 | 36165 | 307.02 | 565 | 554 | 116.0 |
| A | 12 | 189 | 15854 | 131.91 | 565 | 554 | 116.0 |
| B | 0 | 229 | 1933717 | 19599.21 | 520 | 507 | 98.6 |
| B | 0 | 245 | 66755 | 671.63 | 520 | 507 | 98.6 |
| B | 5 | 172 | 50329 | 505.1 | 520 | 507 | 98.6 |
| C | 3 | 233 | 478030 | 3678.08 | 551 | 553 | 129.8 |
| C | 15 | 214 | 209551 | 1609.94 | 551 | 553 | 129.8 |
| C | 14 | 254 | 49876 | 379.94 | 551 | 553 | 129.8 |
| D | 1 | 52 | 889421 | 6625.69 | 548 | 531 | 134.2 |
| D | 10 | 118 | 195582 | 1453.89 | 548 | 531 | 134.2 |
| D | 13 | 249 | 145071 | 1077.39 | 548 | 531 | 134.2 |
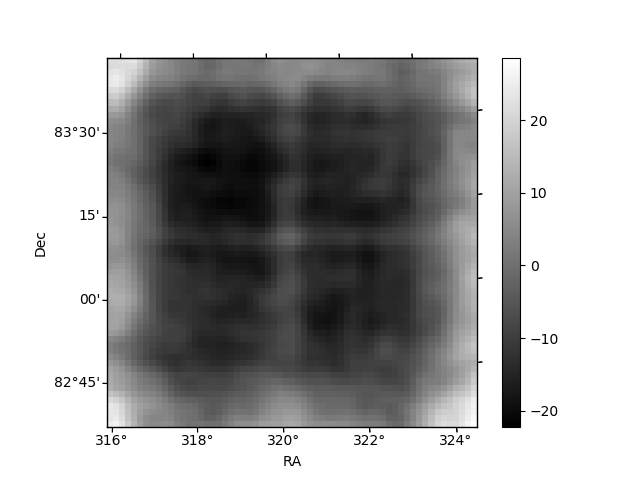
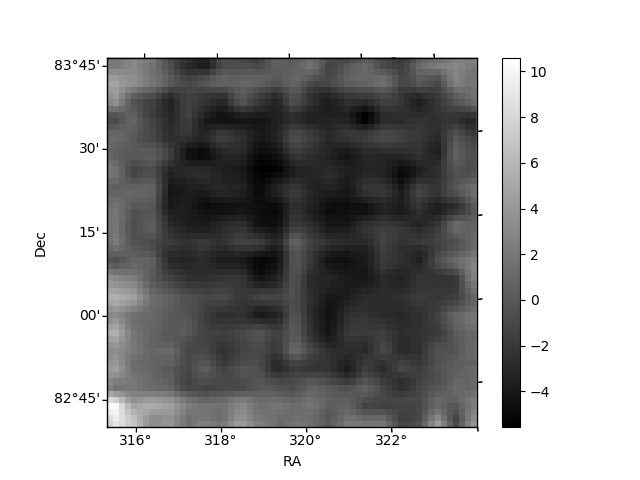
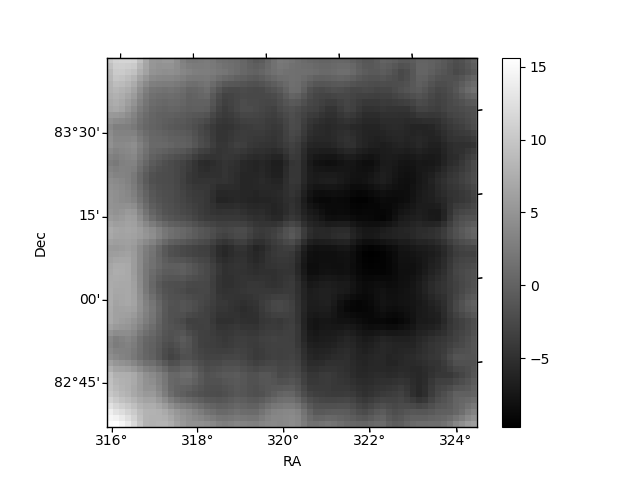
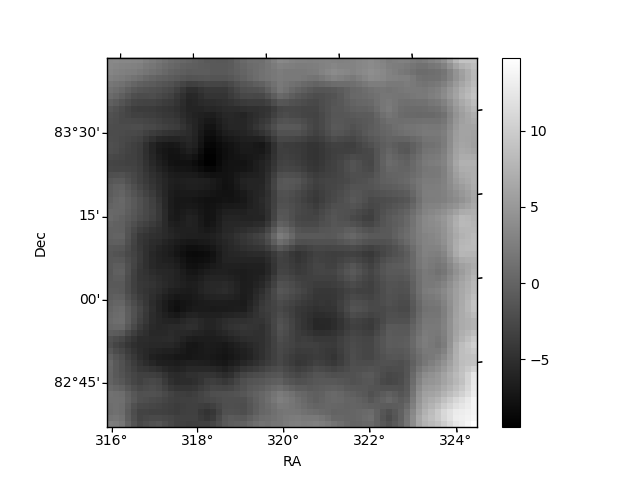
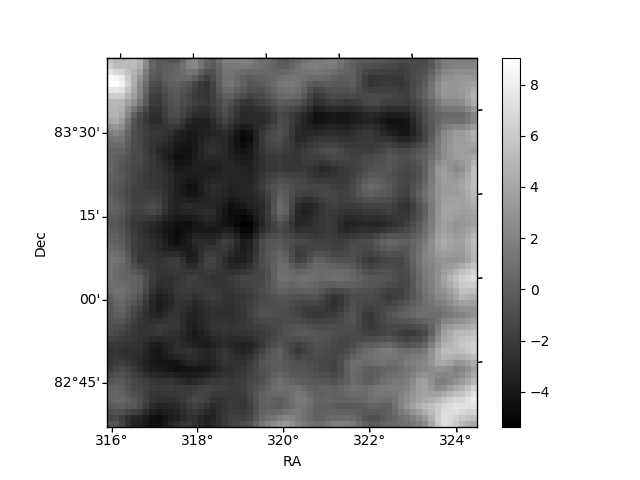
Histogram calculated using DETX and DETY for each event in the final _common_clean file
| Quadrant A | 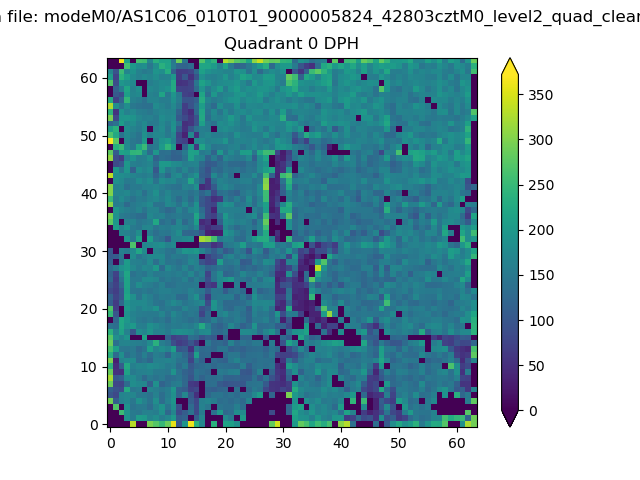 |
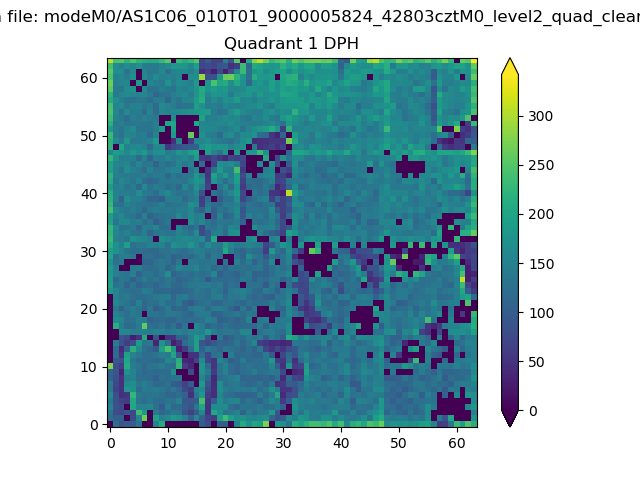 |
Quadrant B |
|---|---|---|---|
| Quadrant D | 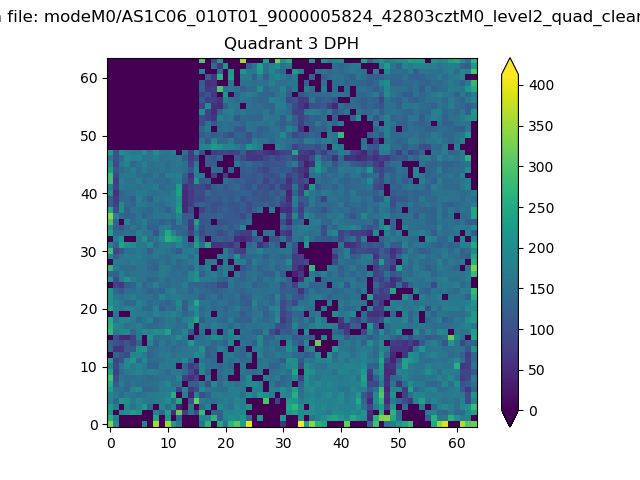 |
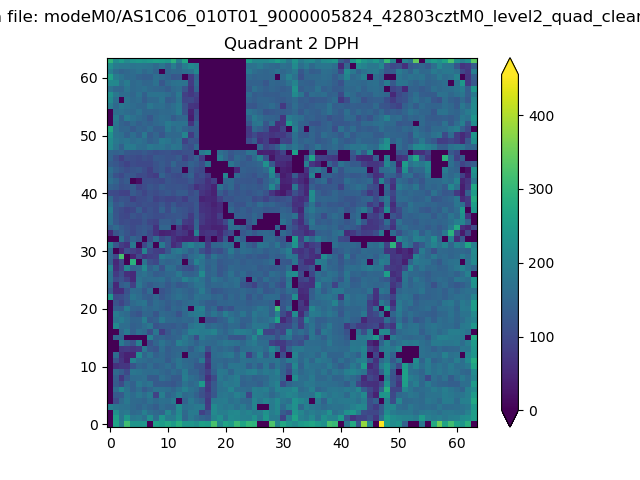 |
Quadrant C |
| Plot type | Count rate plots | Images |
|---|---|---|
| Comparison with Poisson distribution Blue bars denote a histogram of data divided into 1 sec bins. Red curve is a Poisson curve with rate = median count rate of data. |
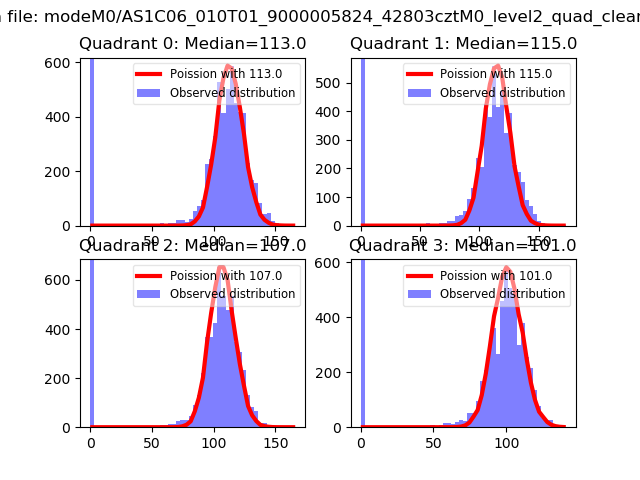 |
 |
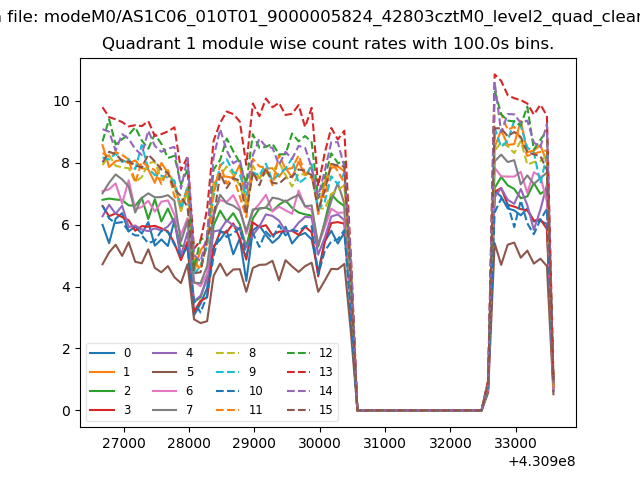
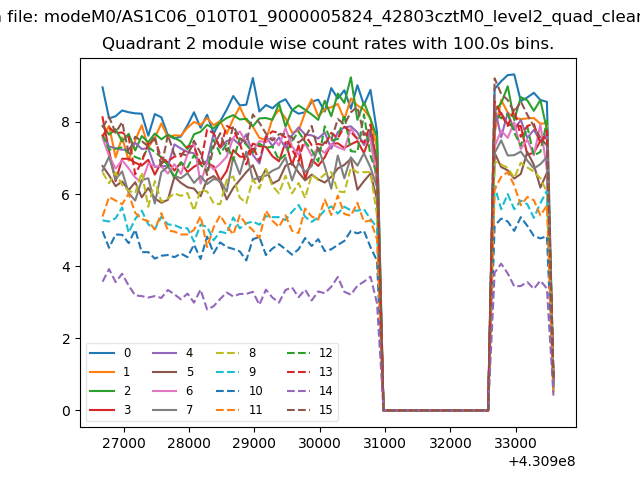
| Quadrant-wise count rates Data is divided into 100 sec bins |
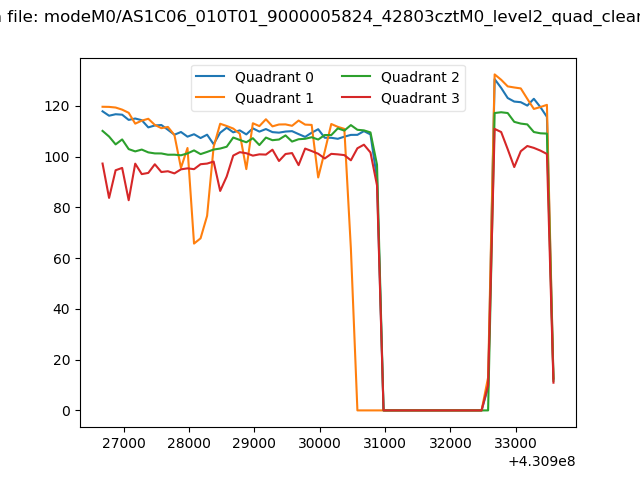 |
|
| Module-wise count rates for Quadrant A Data is divided into 100 sec bins |
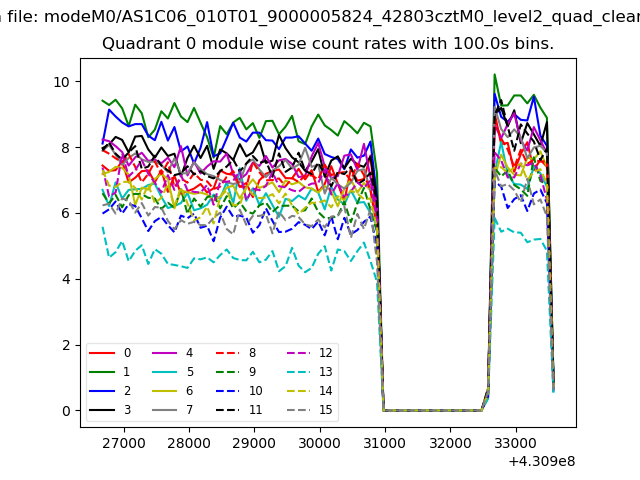 |
 |
| Module-wise count rates for Quadrant B Data is divided into 100 sec bins |
 |
 |
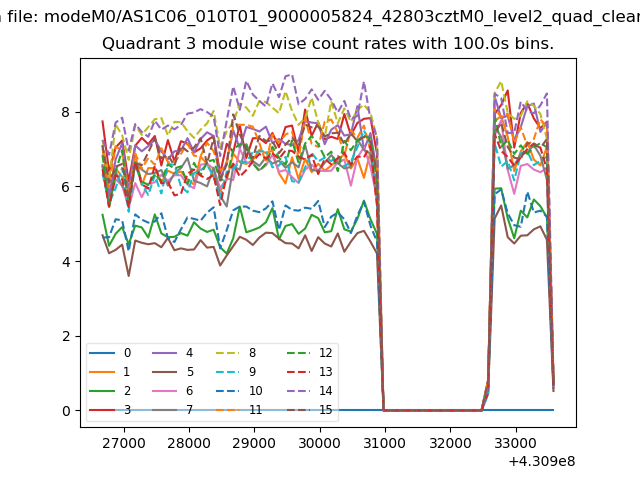
| Module-wise count rates for Quadrant C Data is divided into 100 sec bins |
 |
 |
| Module-wise count rates for Quadrant D Data is divided into 100 sec bins |
 |
 |
| Parameter | Plot |
|---|---|
| CZT HV Monitor | 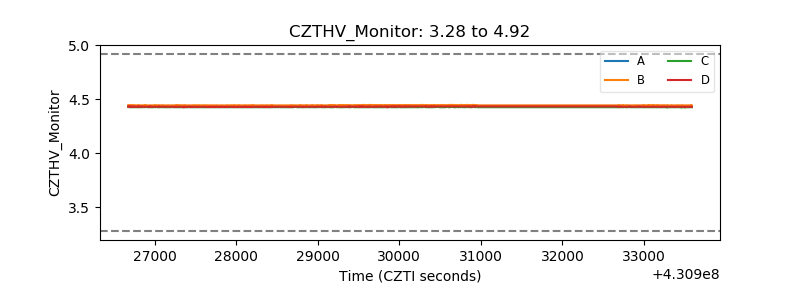 |
| D_VDD | 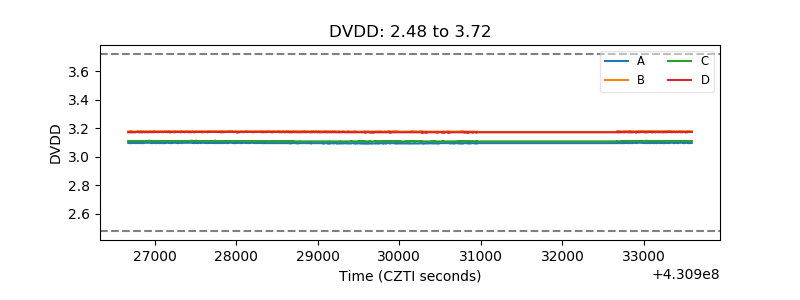 |
| Temperature 1 | 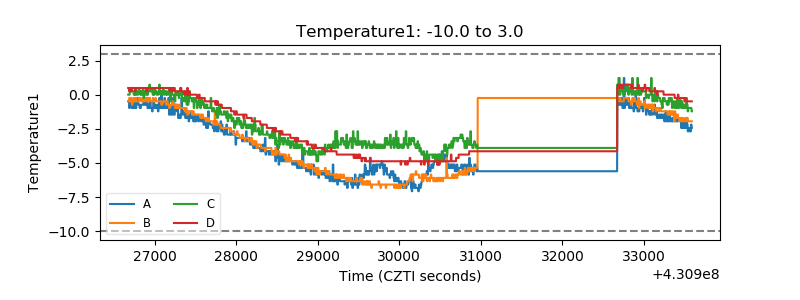 |
| Veto HV Monitor | 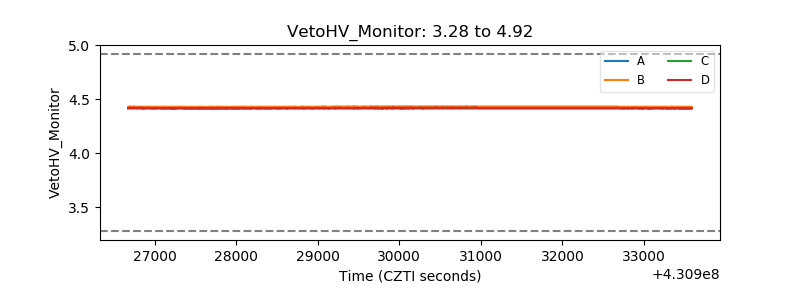 |
| Veto LLD | 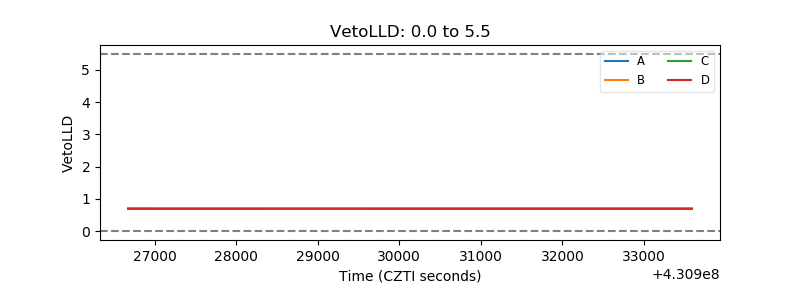 |
| Alpha Counter | 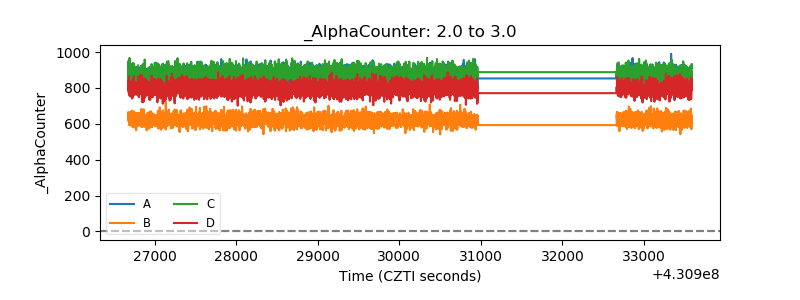 |
| _CPM_Rate | 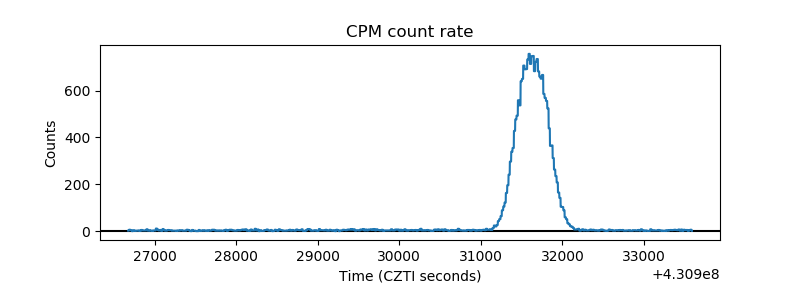 |
| CZT Counter | 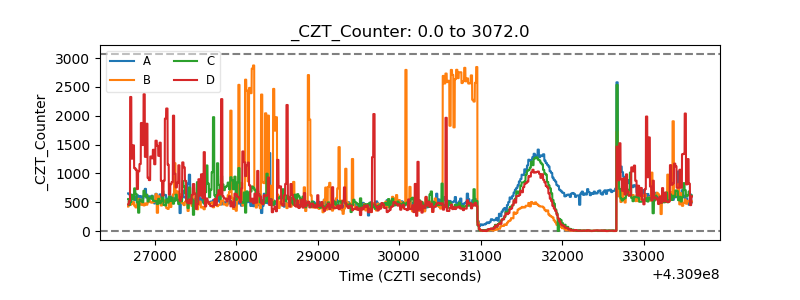 |
| +2.5 Volts monitor | 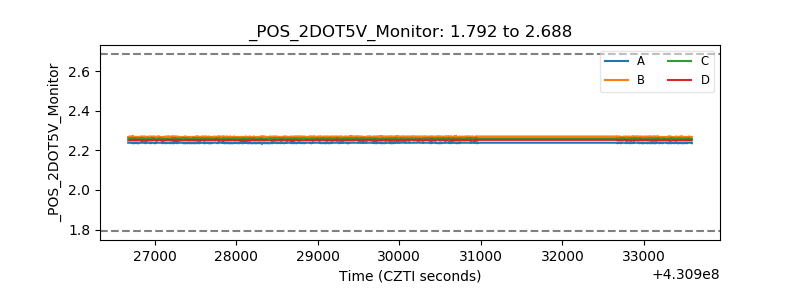 |
| +5 Volts monitor | 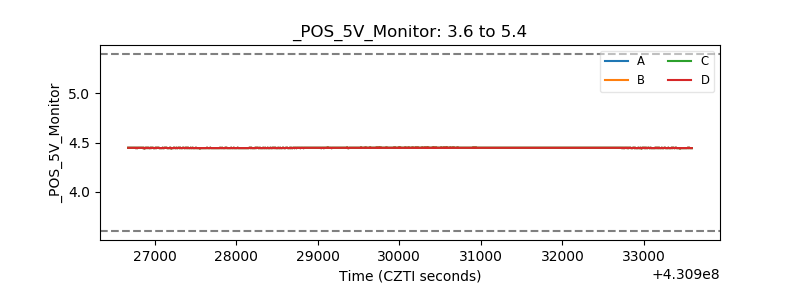 |
| _ROLL_ROT | 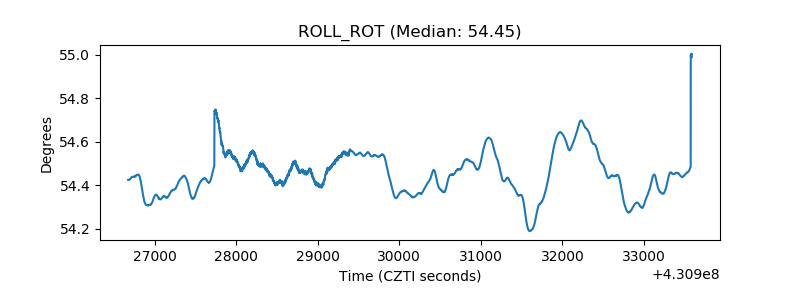 |
| _Roll_DEC | 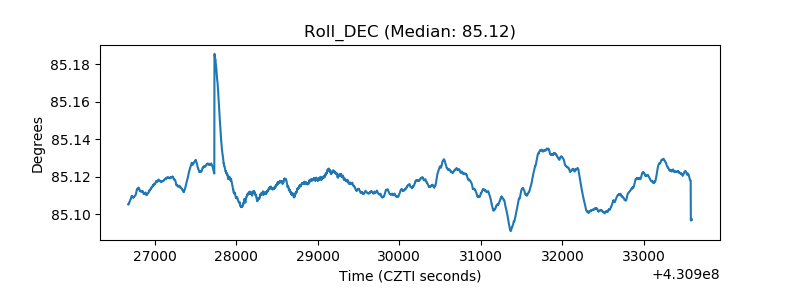 |
| _Roll_RA | 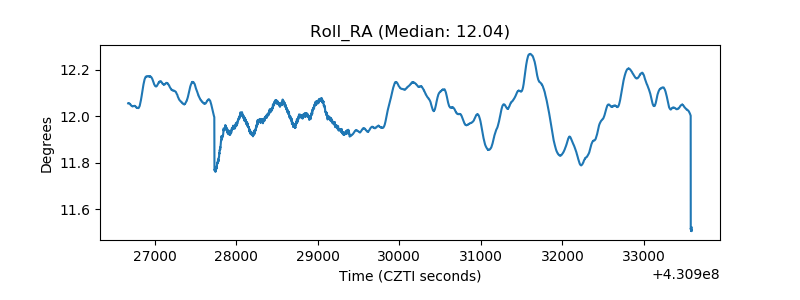 |
| Veto Counter | 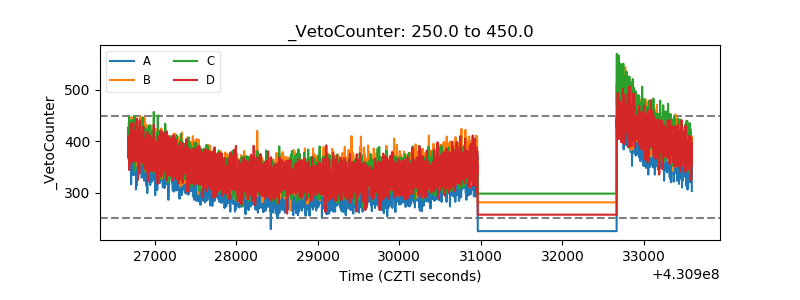 |