| Param | Original file | Final file |
|---|---|---|
| Filename | modeM0/AS1C06_010T01_9000005824_42805cztM0_level2.fits | modeM0/AS1C06_010T01_9000005824_42805cztM0_level2_quad_clean.evt |
| Size (bytes) | 353,350,080 | 88,776,000 |
| Size | 337.0 MB | 84.7 MB |
| Events in quadrant A | 2,967,320 | 602,197 |
| Events in quadrant B | 3,493,133 | 598,204 |
| Events in quadrant C | 2,939,347 | 582,384 |
| Events in quadrant D | 3,274,012 | 539,205 |
| Mode M9 | |||
|---|---|---|---|
| Quadrant | BADHDUFLAG | Total packets | Discarded packets |
| A | 0 | 18 | 0 |
| B | 0 | 18 | 0 |
| C | 0 | 18 | 0 |
| D | 0 | 18 | 0 |
| Mode M0 | |||
|---|---|---|---|
| Quadrant | BADHDUFLAG | Total packets | Discarded packets |
| A | 0 | 12102 | 3 |
| B | 0 | 13991 | 2 |
| C | 0 | 12326 | 2 |
| D | 0 | 13569 | 2 |
| Mode SS | |||
|---|---|---|---|
| Quadrant | BADHDUFLAG | Total packets | Discarded packets |
| A | 0 | 108 | 0 |
| B | 0 | 108 | 0 |
| C | 0 | 108 | 0 |
| D | 0 | 108 | 0 |
| Quadrant | Total seconds | Saturated seconds | Saturation percentage |
|---|---|---|---|
| A | 5217 | 16 | 0.306690% |
| B | 5217 | 273 | 5.232892% |
| C | 5217 | 31 | 0.594211% |
| D | 5217 | 101 | 1.935979% |
Noise dominated data is calculated using 1-second bins in cleaned event files. If a bin has >2000 counts, and if more than 50% of those come from <1% of pixels, then it is considered to be noise-dominated and hence unusable.
| Quadrant | # 1 sec bins | Bins with >0 counts | Bins with >2000 counts | High rate bins dominated by noise | Noise dominated (total time) | Noise dominated (detector-on time) | Marked lightcurve |
|---|---|---|---|---|---|---|---|
| A | 7039 | 5218 | 2 | 2 | 0.03% | 0.04% | 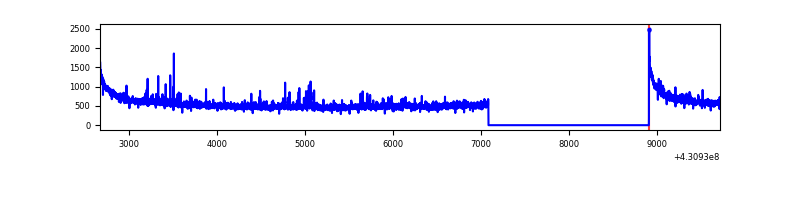 |
| B | 7039 | 5218 | 204 | 204 | 2.90% | 3.91% | 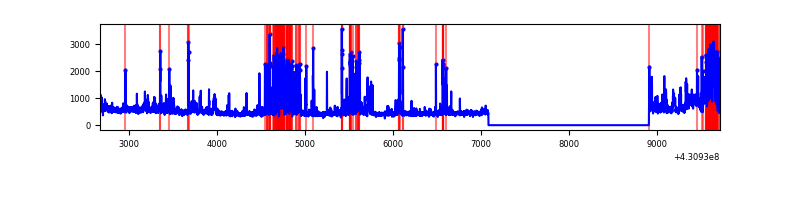 |
| C | 7039 | 5218 | 23 | 23 | 0.33% | 0.44% | 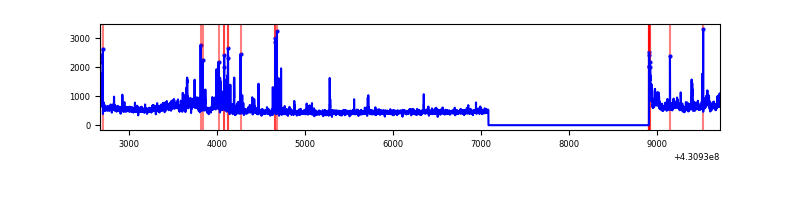 |
| D | 7039 | 5218 | 98 | 98 | 1.39% | 1.88% | 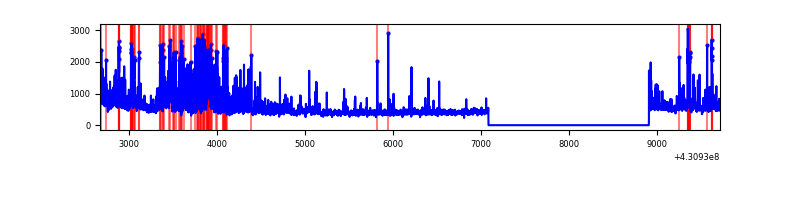 |
Top three noisy pixels from each quadrant. If the there are fewer than three noisy pixels in the level2.evt file, extra rows are filled as -1
| Pixel properties | Quadrant properties | ||||||
|---|---|---|---|---|---|---|---|
| Quadrant | DetID | PixID | Counts | Sigma | Mean | Median | Sigma |
| A | 10 | 83 | 636511 | 5433.43 | 572 | 559 | 117.0 |
| A | 12 | 189 | 77084 | 653.81 | 572 | 559 | 117.0 |
| A | 13 | 248 | 14940 | 122.87 | 572 | 559 | 117.0 |
| B | 0 | 229 | 597919 | 5524.55 | 567 | 552 | 108.1 |
| B | 4 | 171 | 376471 | 3476.56 | 567 | 552 | 108.1 |
| B | 0 | 245 | 78603 | 721.83 | 567 | 552 | 108.1 |
| C | 3 | 233 | 367070 | 2779.84 | 562 | 564 | 131.8 |
| C | 15 | 214 | 212911 | 1610.59 | 562 | 564 | 131.8 |
| C | 14 | 254 | 107617 | 811.97 | 562 | 564 | 131.8 |
| D | 1 | 52 | 691034 | 5067.65 | 560 | 543 | 136.3 |
| D | 10 | 118 | 192306 | 1407.39 | 560 | 543 | 136.3 |
| D | 13 | 249 | 71421 | 520.19 | 560 | 543 | 136.3 |
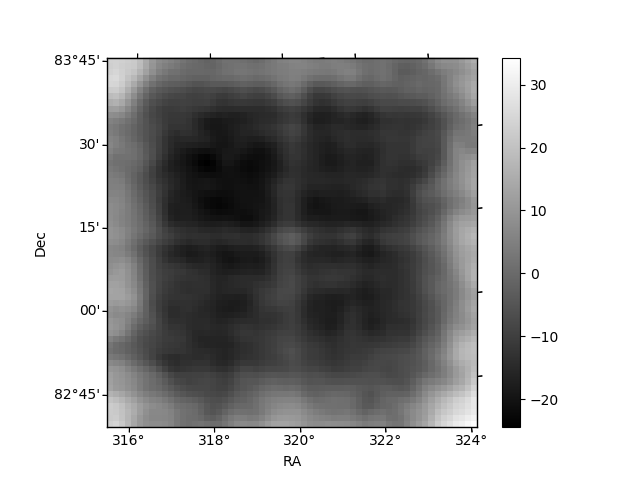
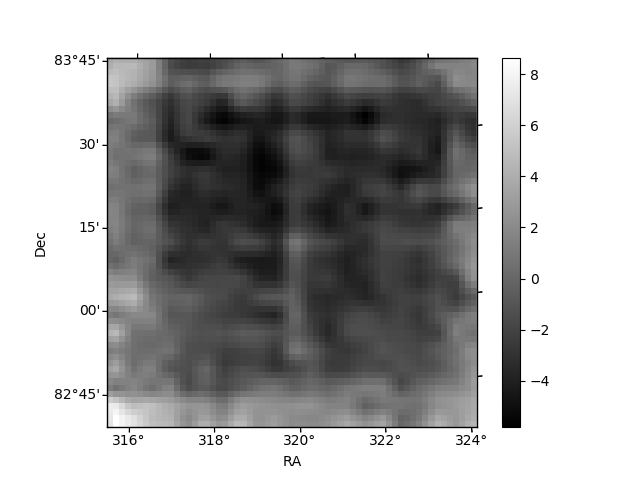
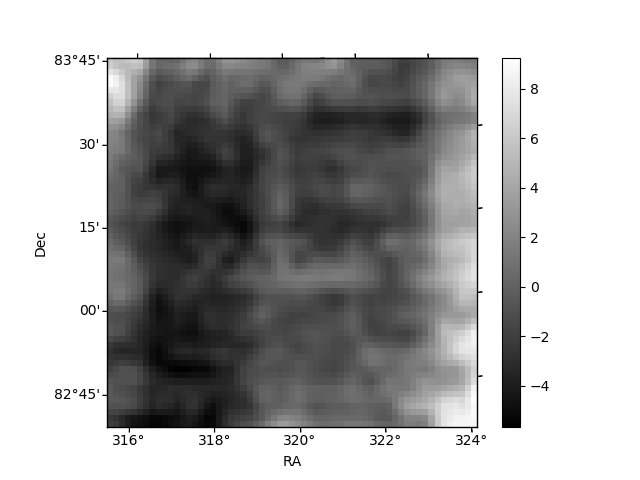
Histogram calculated using DETX and DETY for each event in the final _common_clean file
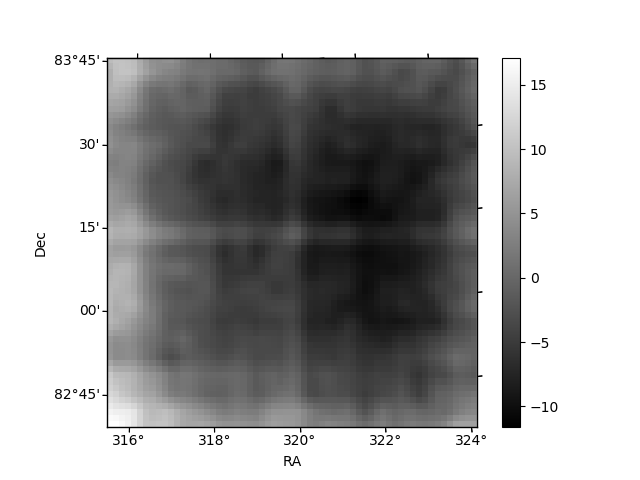
| Quadrant A | 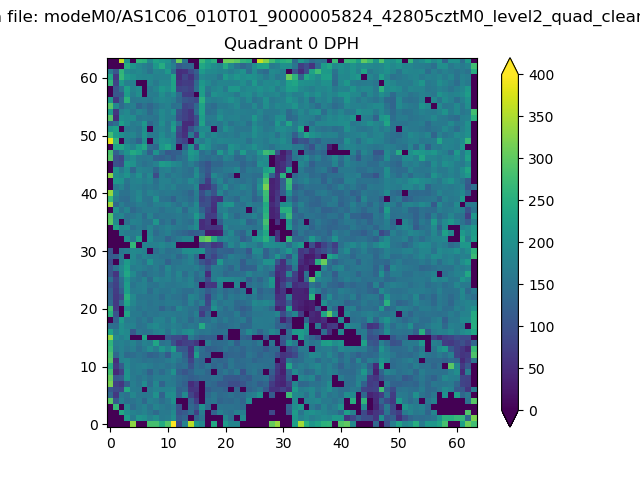 |
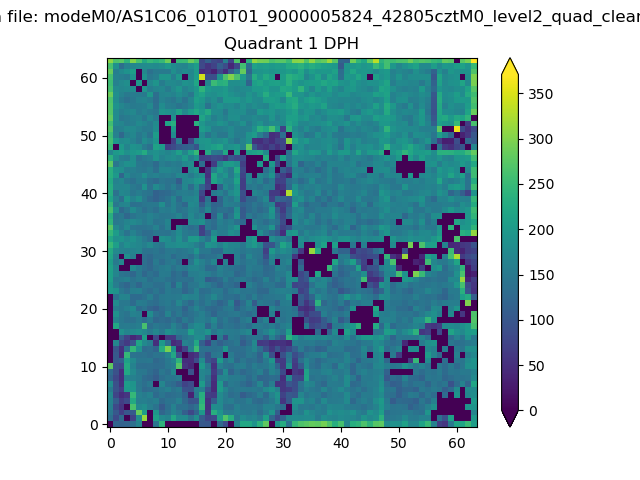 |
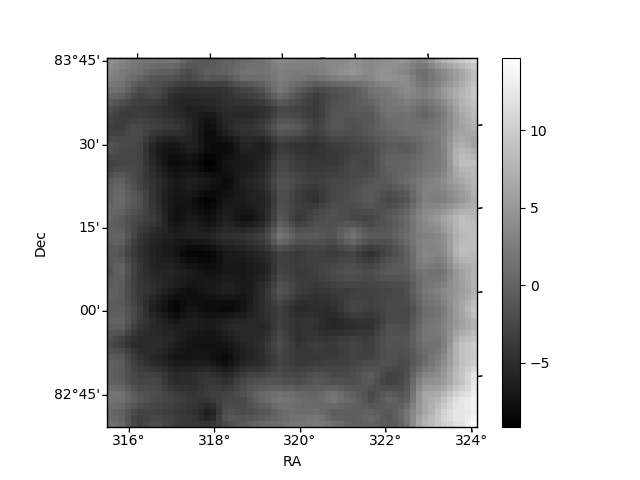
Quadrant B |
|---|---|---|---|
| Quadrant D | 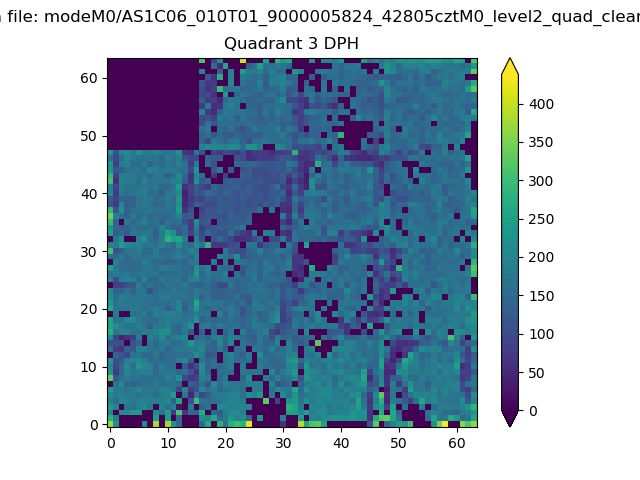 |
 |
Quadrant C |
| Plot type | Count rate plots | Images |
|---|---|---|
| Comparison with Poisson distribution Blue bars denote a histogram of data divided into 1 sec bins. Red curve is a Poisson curve with rate = median count rate of data. |
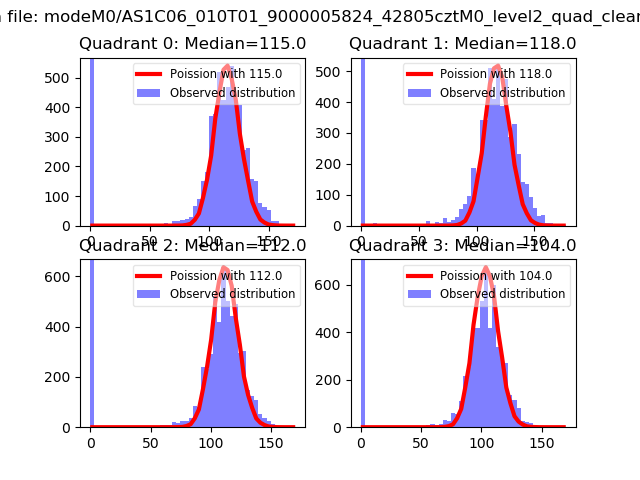 |
 |
| Quadrant-wise count rates Data is divided into 100 sec bins |
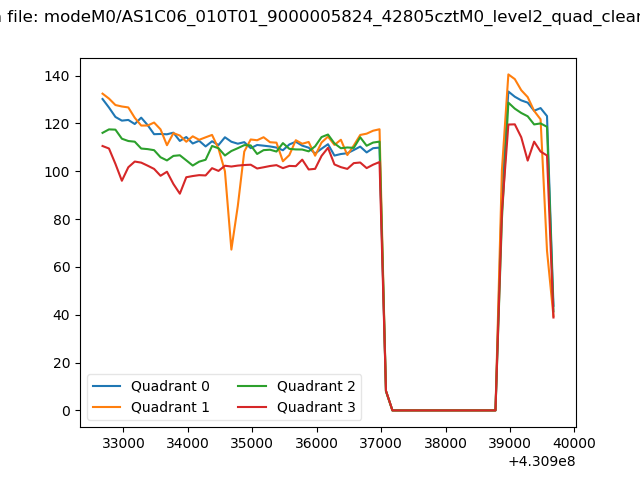 |
|
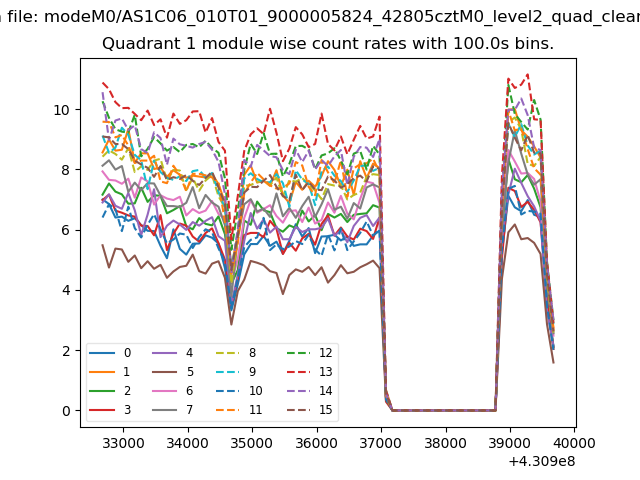
| Module-wise count rates for Quadrant A Data is divided into 100 sec bins |
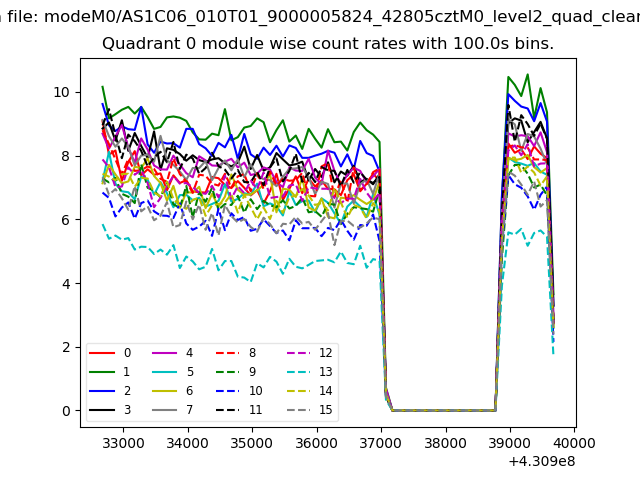 |
 |
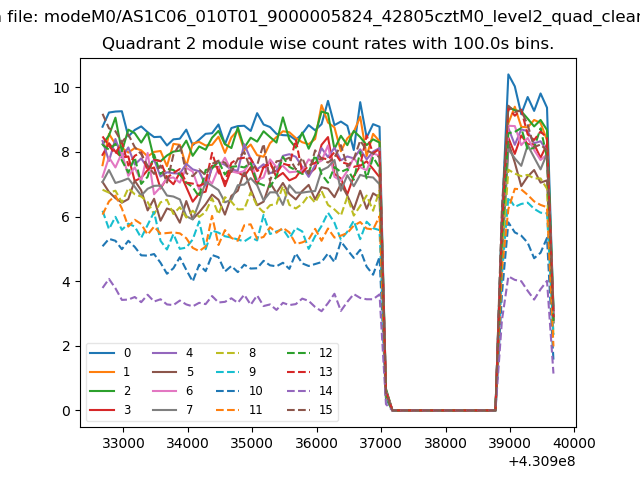
| Module-wise count rates for Quadrant B Data is divided into 100 sec bins |
 |
 |
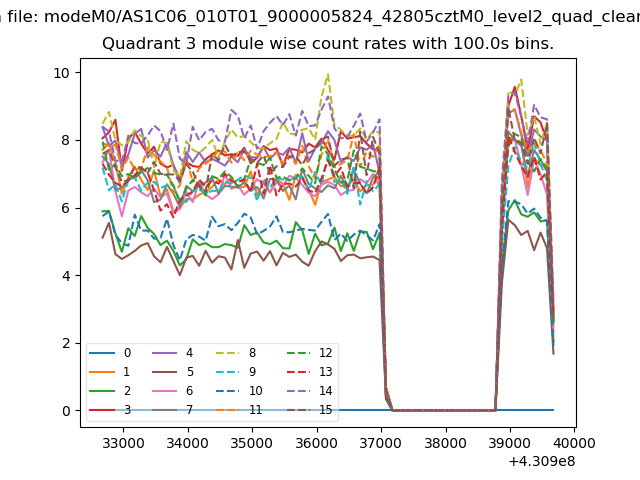
| Module-wise count rates for Quadrant C Data is divided into 100 sec bins |
 |
 |
| Module-wise count rates for Quadrant D Data is divided into 100 sec bins |
 |
 |
| Parameter | Plot |
|---|---|
| CZT HV Monitor | 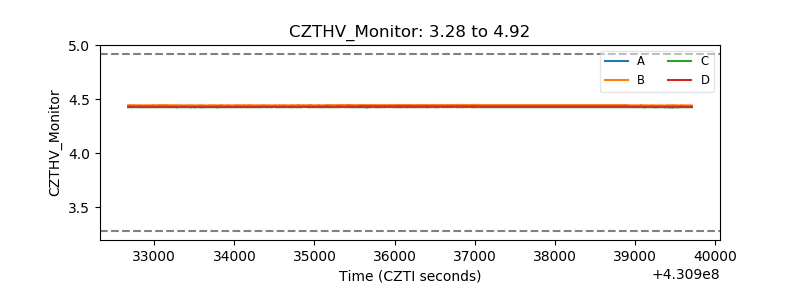 |
| D_VDD | 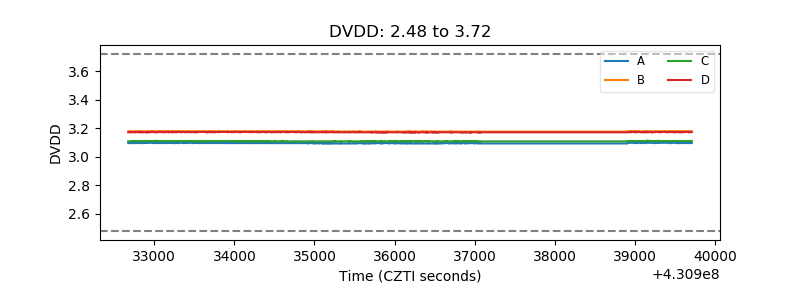 |
| Temperature 1 | 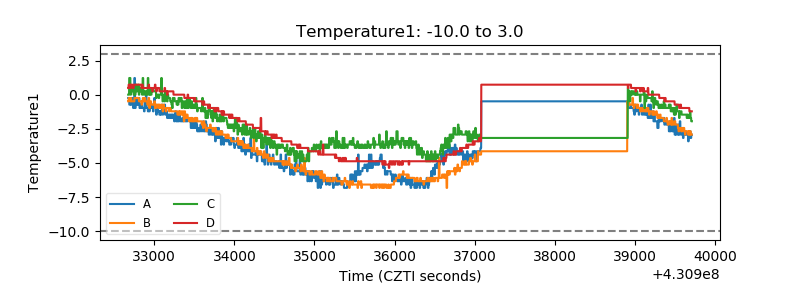 |
| Veto HV Monitor | 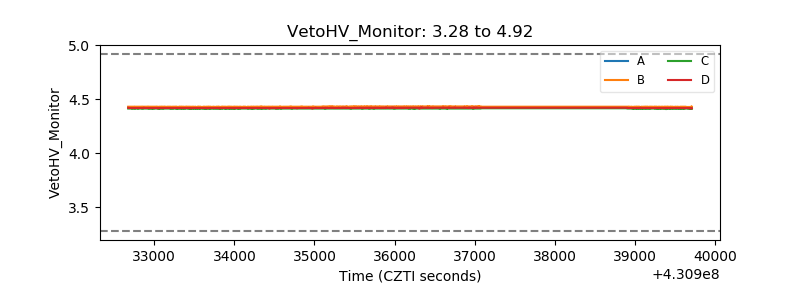 |
| Veto LLD | 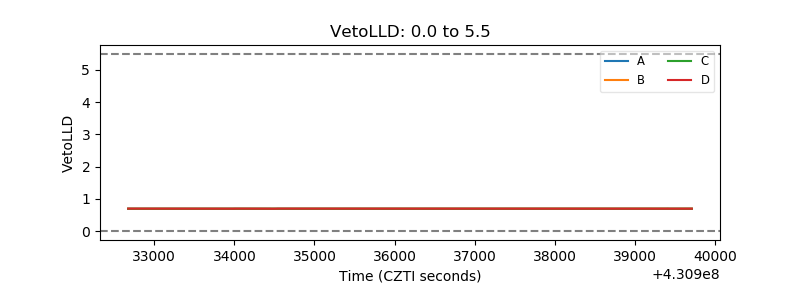 |
| Alpha Counter | 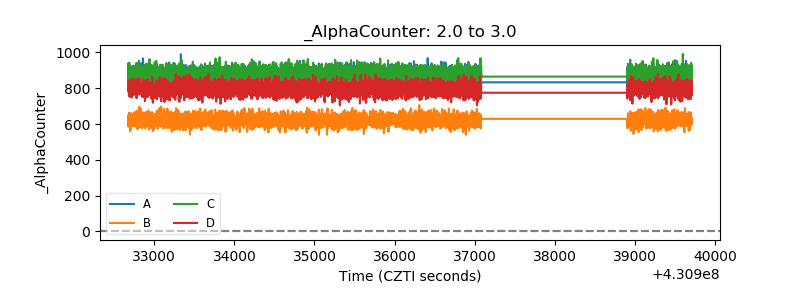 |
| _CPM_Rate | 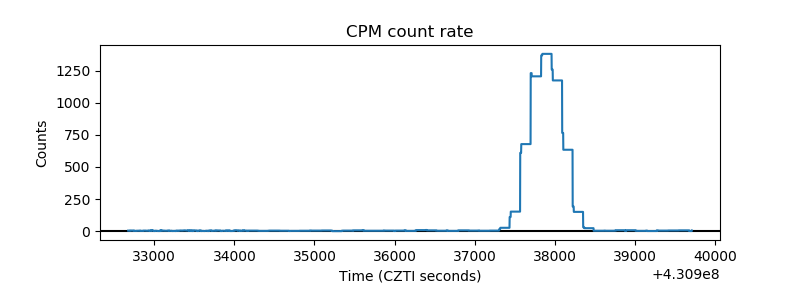 |
| CZT Counter | 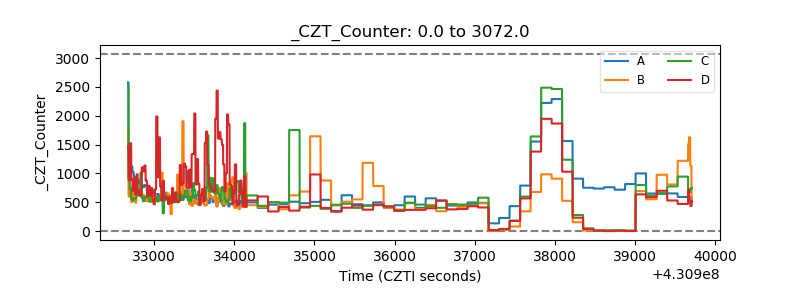 |
| +2.5 Volts monitor | 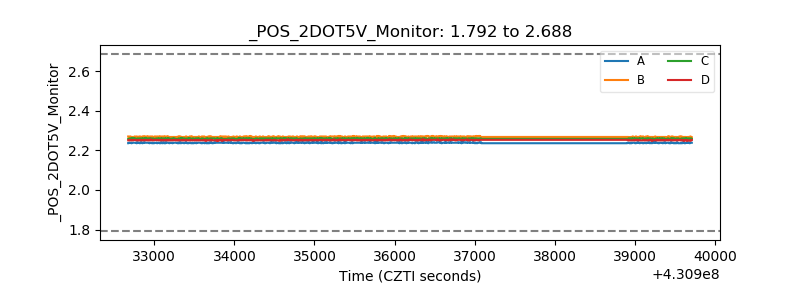 |
| +5 Volts monitor | 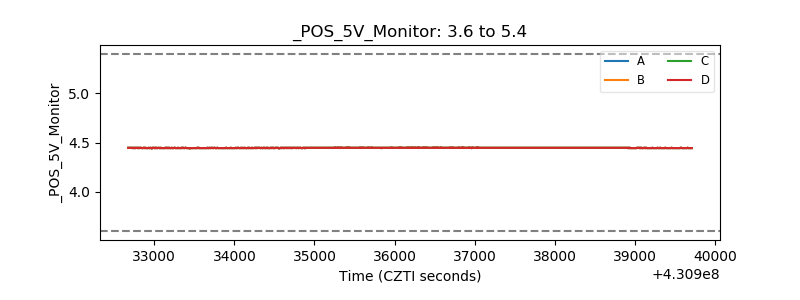 |
| _ROLL_ROT | 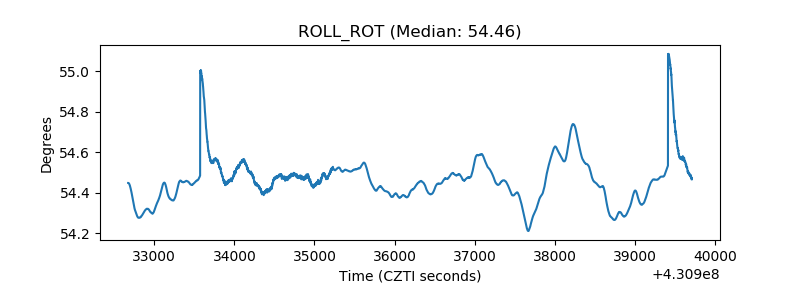 |
| _Roll_DEC | 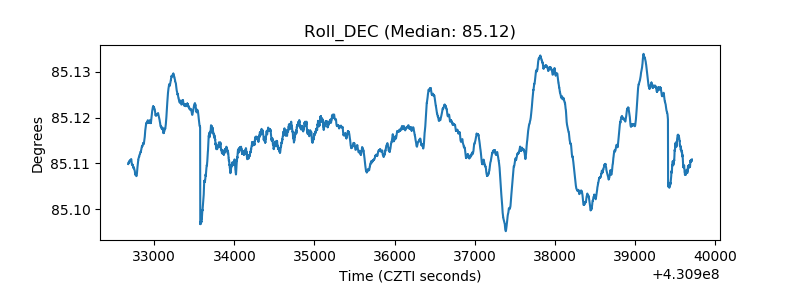 |
| _Roll_RA | 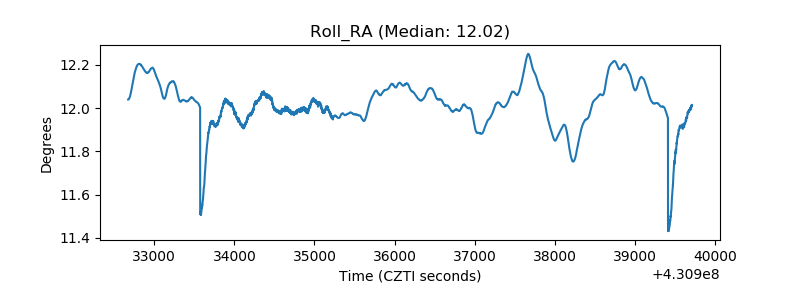 |
| Veto Counter | 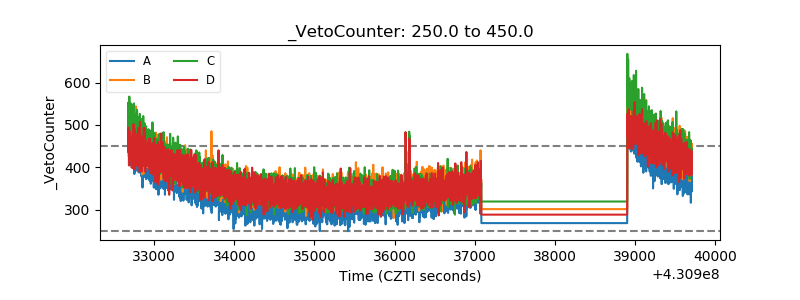 |