| Param | Original file | Final file |
|---|---|---|
| Filename | modeM0/AS1C06_010T01_9000005824_42806cztM0_level2.fits | modeM0/AS1C06_010T01_9000005824_42806cztM0_level2_quad_clean.evt |
| Size (bytes) | 345,421,440 | 88,974,720 |
| Size | 329.4 MB | 84.9 MB |
| Events in quadrant A | 2,884,695 | 601,854 |
| Events in quadrant B | 3,710,582 | 598,721 |
| Events in quadrant C | 2,830,689 | 595,303 |
| Events in quadrant D | 2,963,574 | 540,640 |
| Mode M9 | |||
|---|---|---|---|
| Quadrant | BADHDUFLAG | Total packets | Discarded packets |
| A | 0 | 19 | 0 |
| B | 0 | 20 | 0 |
| C | 0 | 20 | 0 |
| D | 0 | 20 | 0 |
| Mode M0 | |||
|---|---|---|---|
| Quadrant | BADHDUFLAG | Total packets | Discarded packets |
| A | 0 | 11800 | 2 |
| B | 0 | 14489 | 2 |
| C | 0 | 11903 | 2 |
| D | 0 | 12543 | 3 |
| Mode SS | |||
|---|---|---|---|
| Quadrant | BADHDUFLAG | Total packets | Discarded packets |
| A | 0 | 106 | 0 |
| B | 0 | 106 | 0 |
| C | 0 | 106 | 0 |
| D | 0 | 106 | 0 |
| Quadrant | Total seconds | Saturated seconds | Saturation percentage |
|---|---|---|---|
| A | 5097 | 18 | 0.353149% |
| B | 5097 | 297 | 5.826957% |
| C | 5097 | 21 | 0.412007% |
| D | 5096 | 134 | 2.629513% |
Noise dominated data is calculated using 1-second bins in cleaned event files. If a bin has >2000 counts, and if more than 50% of those come from <1% of pixels, then it is considered to be noise-dominated and hence unusable.
| Quadrant | # 1 sec bins | Bins with >0 counts | Bins with >2000 counts | High rate bins dominated by noise | Noise dominated (total time) | Noise dominated (detector-on time) | Marked lightcurve |
|---|---|---|---|---|---|---|---|
| A | 7040 | 5098 | 5 | 5 | 0.07% | 0.10% | 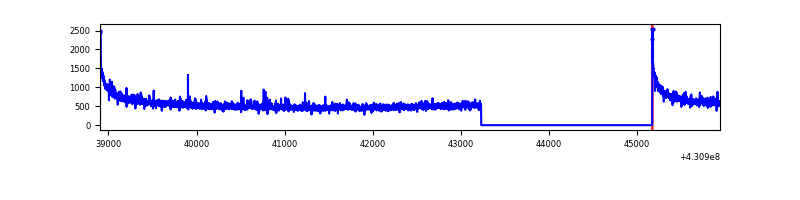 |
| B | 7040 | 5098 | 261 | 261 | 3.71% | 5.12% | 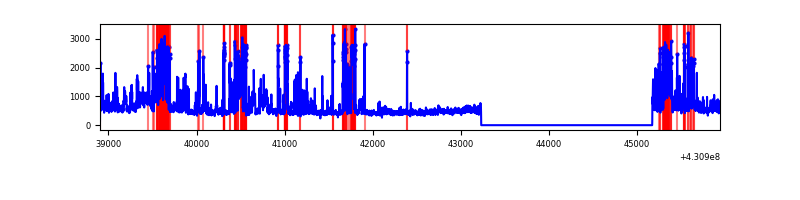 |
| C | 7040 | 5098 | 13 | 13 | 0.18% | 0.26% | 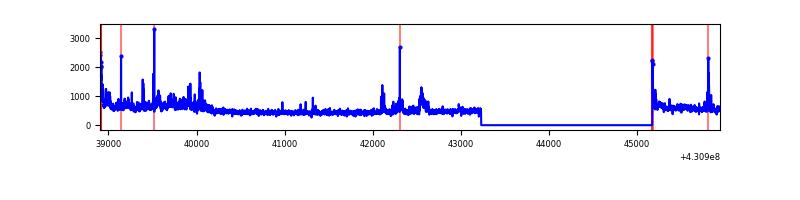 |
| D | 7039 | 5097 | 115 | 115 | 1.63% | 2.26% | 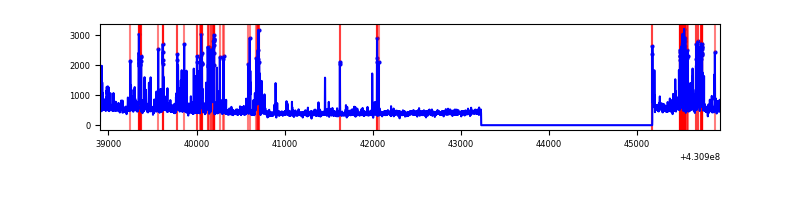 |
Top three noisy pixels from each quadrant. If the there are fewer than three noisy pixels in the level2.evt file, extra rows are filled as -1
| Pixel properties | Quadrant properties | ||||||
|---|---|---|---|---|---|---|---|
| Quadrant | DetID | PixID | Counts | Sigma | Mean | Median | Sigma |
| A | 10 | 83 | 629439 | 5473.78 | 561 | 549 | 114.9 |
| A | 12 | 189 | 47729 | 410.65 | 561 | 549 | 114.9 |
| A | 13 | 6 | 17782 | 149.99 | 561 | 549 | 114.9 |
| B | 0 | 229 | 1235737 | 11984.31 | 554 | 541 | 103.1 |
| B | 4 | 171 | 114654 | 1107.17 | 554 | 541 | 103.1 |
| B | 15 | 35 | 50016 | 480.02 | 554 | 541 | 103.1 |
| C | 3 | 233 | 282795 | 2193.52 | 556 | 561 | 128.7 |
| C | 15 | 214 | 207603 | 1609.13 | 556 | 561 | 128.7 |
| C | 7 | 220 | 82708 | 638.44 | 556 | 561 | 128.7 |
| D | 12 | 233 | 275048 | 2064.02 | 550 | 533 | 133.0 |
| D | 13 | 249 | 186637 | 1399.28 | 550 | 533 | 133.0 |
| D | 10 | 118 | 137526 | 1030.02 | 550 | 533 | 133.0 |
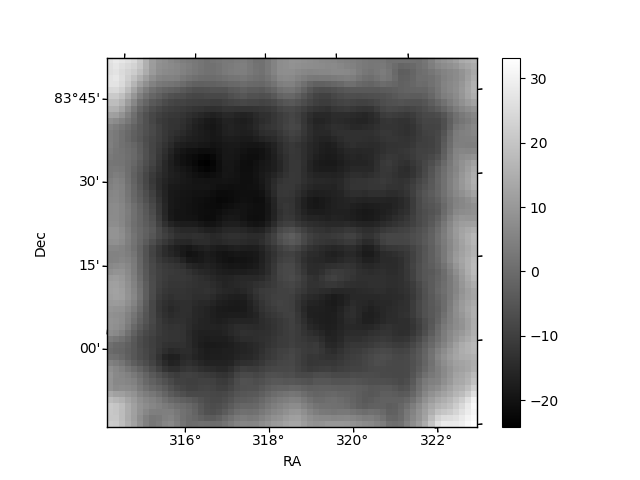
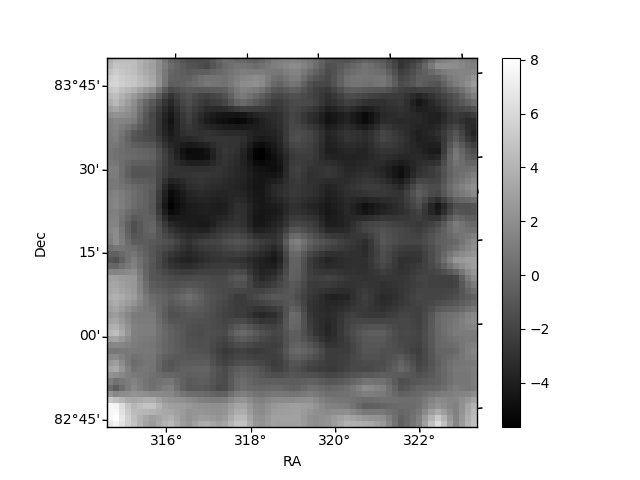
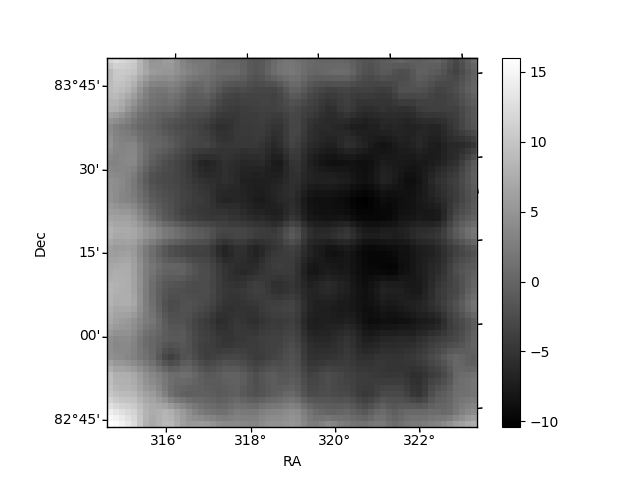
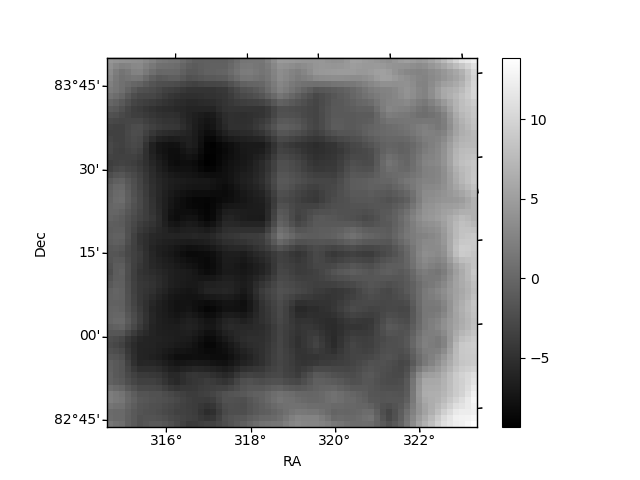
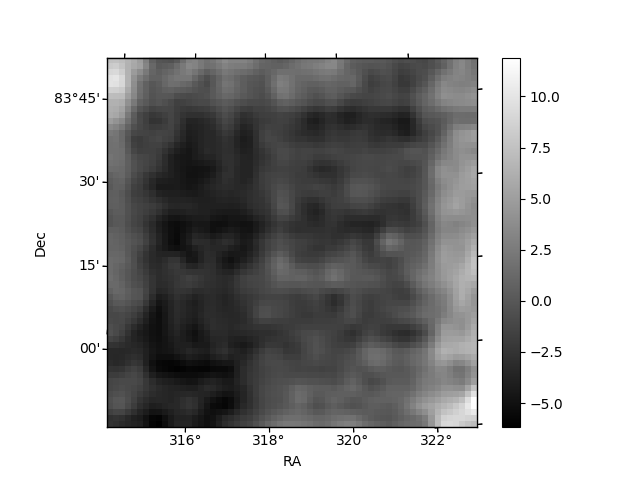
Histogram calculated using DETX and DETY for each event in the final _common_clean file
| Quadrant A | 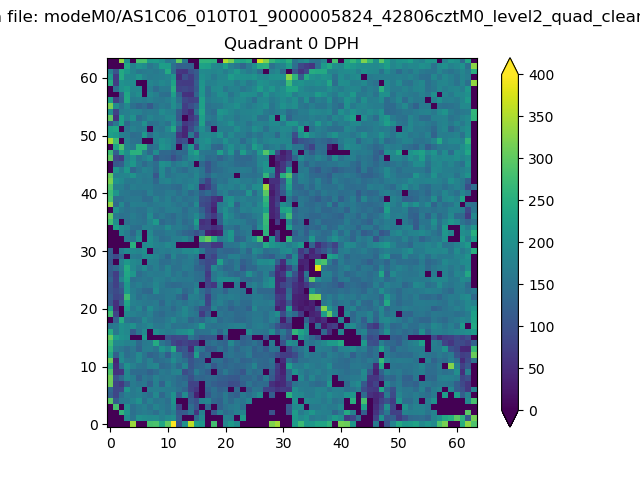 |
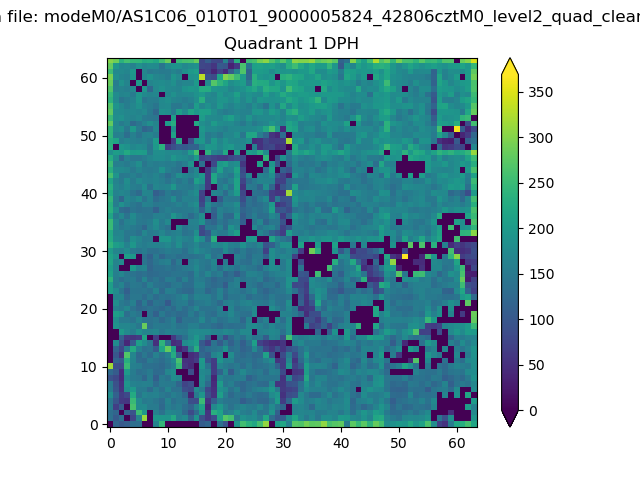 |
Quadrant B |
|---|---|---|---|
| Quadrant D | 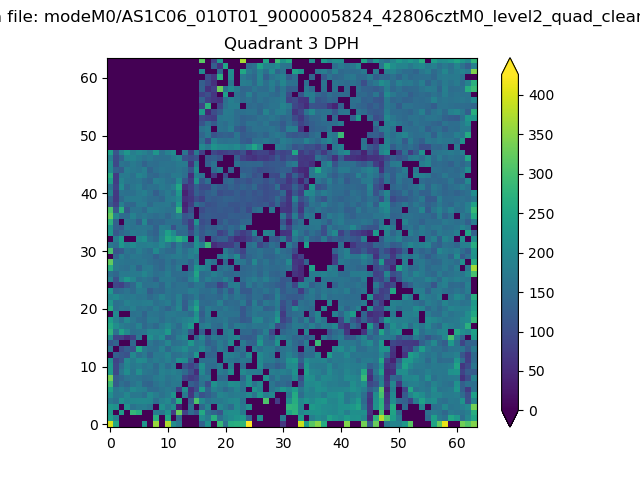 |
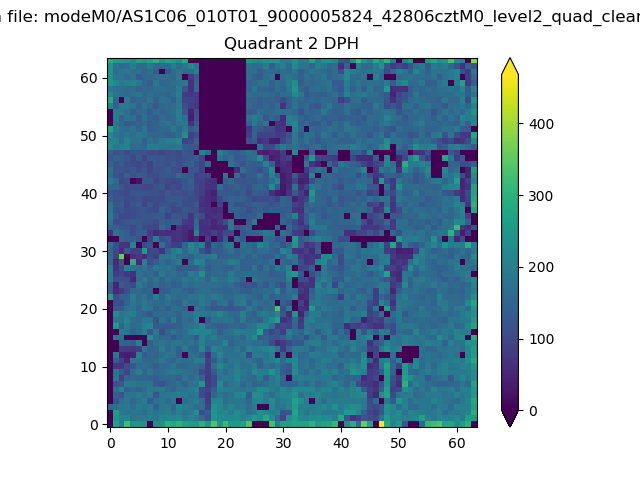 |
Quadrant C |
| Plot type | Count rate plots | Images |
|---|---|---|
| Comparison with Poisson distribution Blue bars denote a histogram of data divided into 1 sec bins. Red curve is a Poisson curve with rate = median count rate of data. |
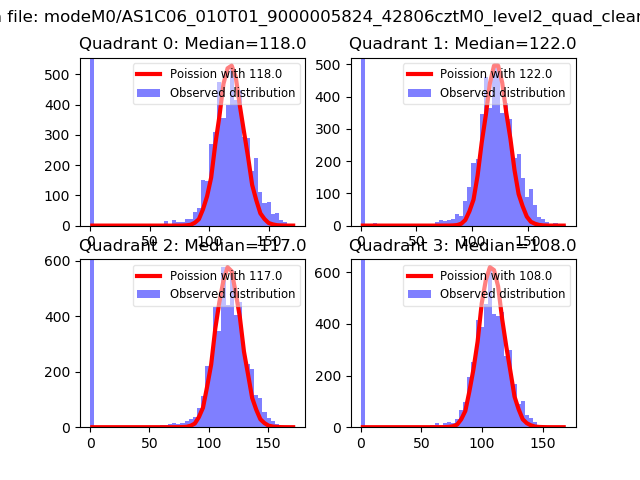 |
 |
| Quadrant-wise count rates Data is divided into 100 sec bins |
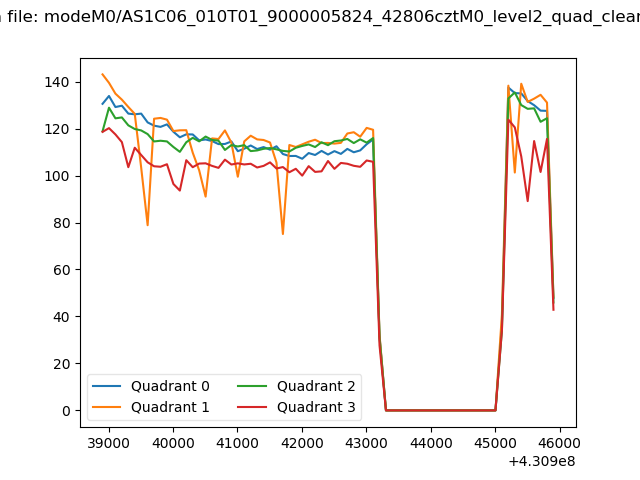 |
|
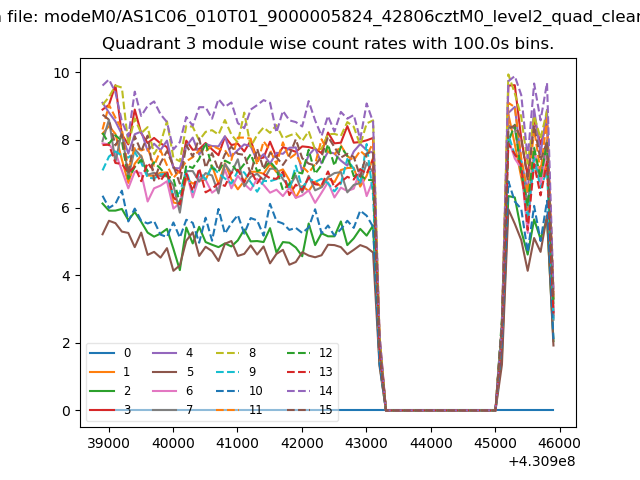
| Module-wise count rates for Quadrant A Data is divided into 100 sec bins |
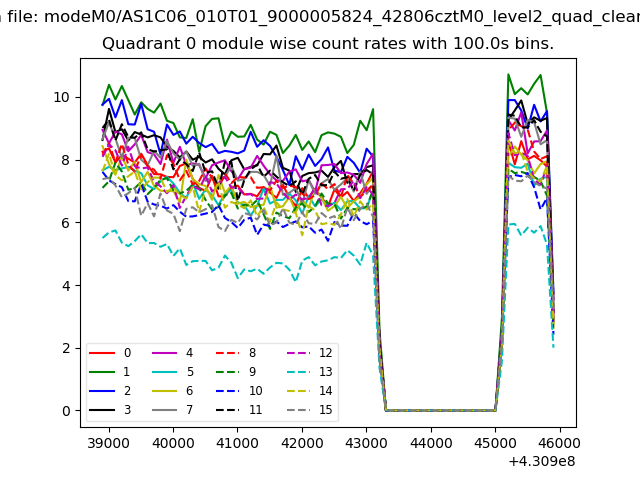 |
 |
| Module-wise count rates for Quadrant B Data is divided into 100 sec bins |
 |
 |
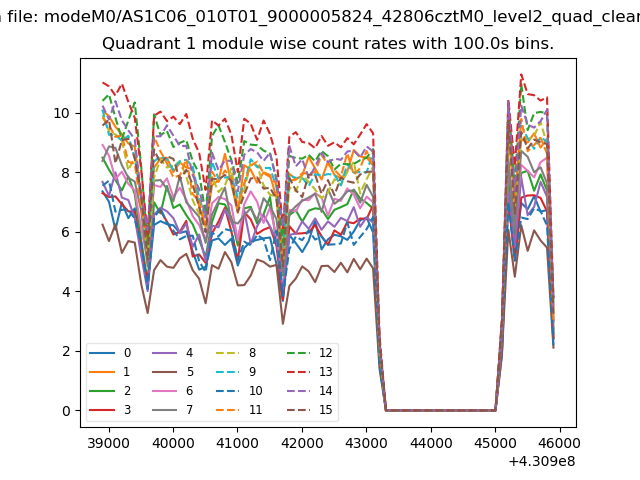
| Module-wise count rates for Quadrant C Data is divided into 100 sec bins |
 |
 |
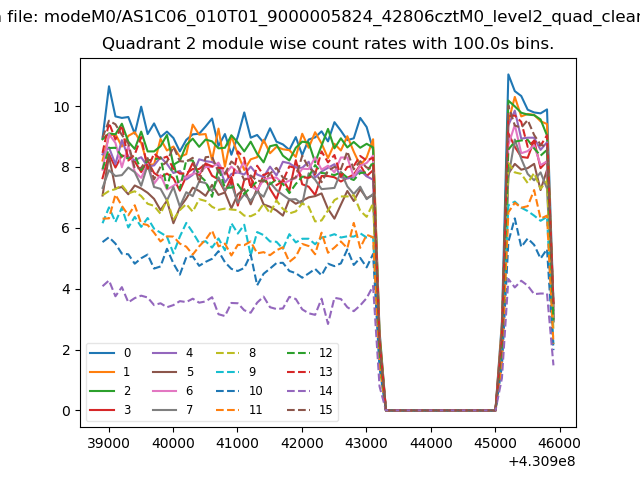
| Module-wise count rates for Quadrant D Data is divided into 100 sec bins |
 |
 |
| Parameter | Plot |
|---|---|
| CZT HV Monitor |  |
| D_VDD | 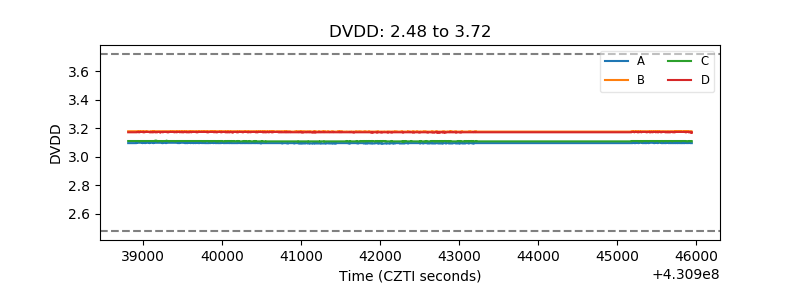 |
| Temperature 1 | 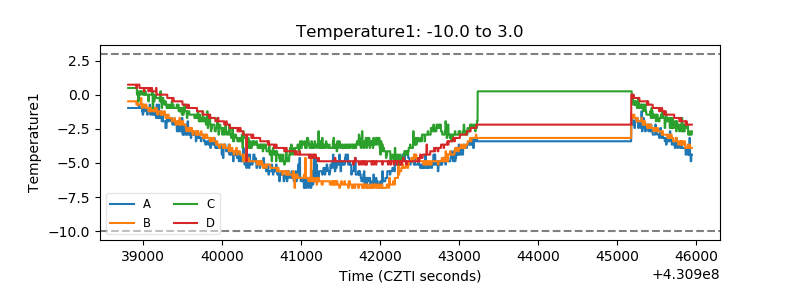 |
| Veto HV Monitor | 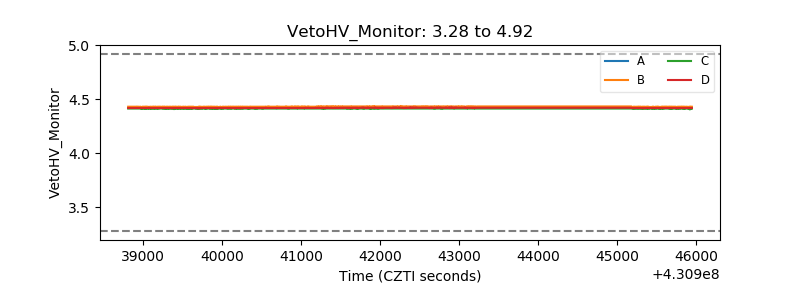 |
| Veto LLD | 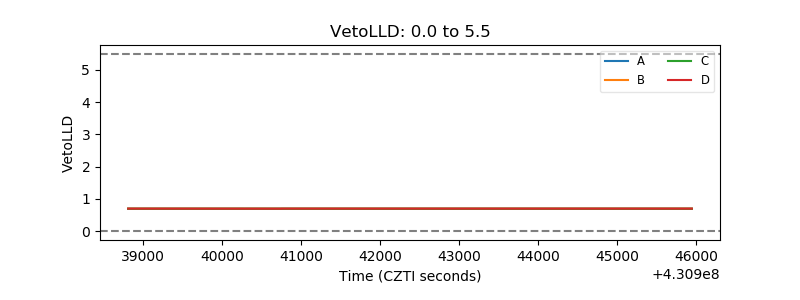 |
| Alpha Counter | 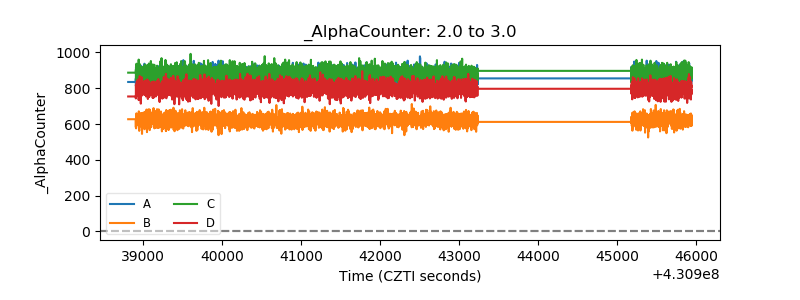 |
| _CPM_Rate | 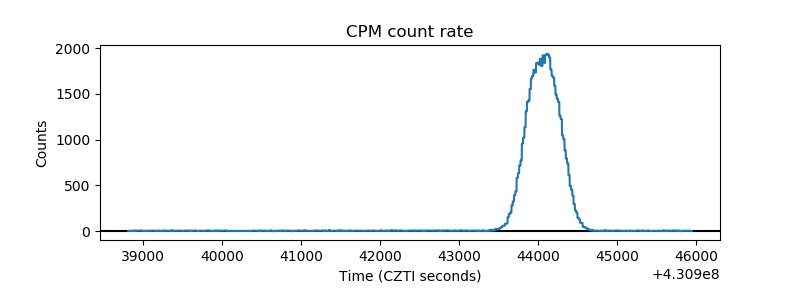 |
| CZT Counter | 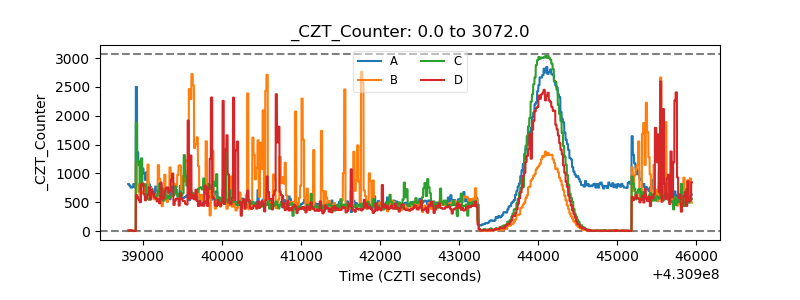 |
| +2.5 Volts monitor | 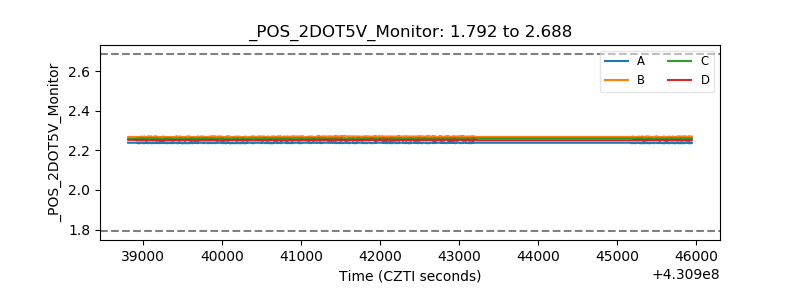 |
| +5 Volts monitor | 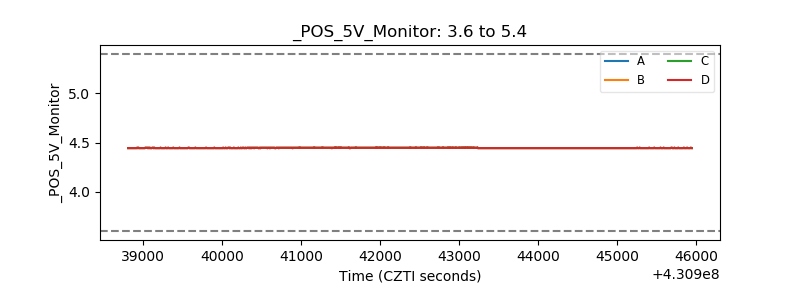 |
| _ROLL_ROT | 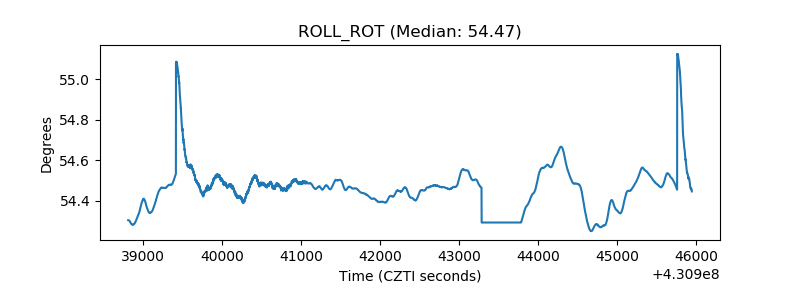 |
| _Roll_DEC | 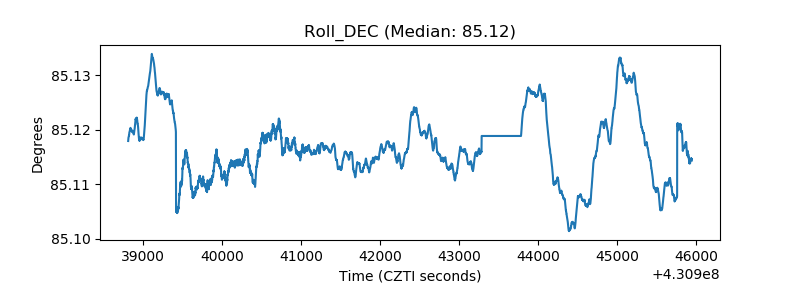 |
| _Roll_RA | 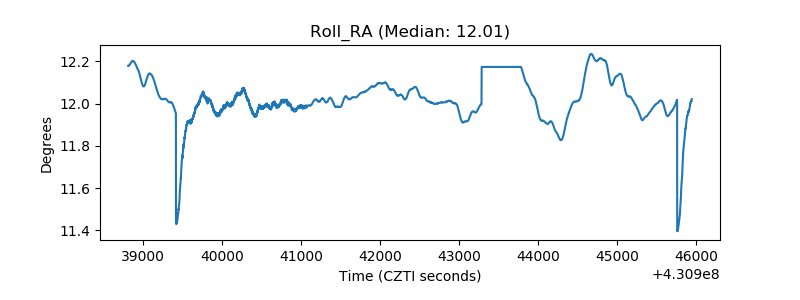 |
| Veto Counter | 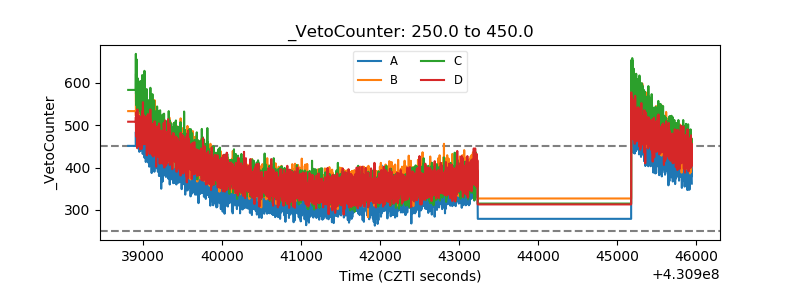 |