| Param | Original file | Final file |
|---|---|---|
| Filename | modeM0/AS1C06_010T01_9000005824_42807cztM0_level2.fits | modeM0/AS1C06_010T01_9000005824_42807cztM0_level2_quad_clean.evt |
| Size (bytes) | 347,863,680 | 89,464,320 |
| Size | 331.7 MB | 85.3 MB |
| Events in quadrant A | 2,885,820 | 602,920 |
| Events in quadrant B | 2,943,449 | 622,128 |
| Events in quadrant C | 3,201,370 | 593,481 |
| Events in quadrant D | 3,455,028 | 538,178 |
| Mode M9 | |||
|---|---|---|---|
| Quadrant | BADHDUFLAG | Total packets | Discarded packets |
| A | 0 | 34 | 0 |
| B | 0 | 35 | 0 |
| C | 0 | 35 | 0 |
| D | 0 | 35 | 0 |
| Mode M0 | |||
|---|---|---|---|
| Quadrant | BADHDUFLAG | Total packets | Discarded packets |
| A | 0 | 11700 | 2 |
| B | 0 | 12125 | 2 |
| C | 0 | 12706 | 2 |
| D | 0 | 13804 | 2 |
| Mode SS | |||
|---|---|---|---|
| Quadrant | BADHDUFLAG | Total packets | Discarded packets |
| A | 0 | 102 | 0 |
| B | 0 | 102 | 0 |
| C | 0 | 102 | 0 |
| D | 0 | 102 | 0 |
| Quadrant | Total seconds | Saturated seconds | Saturation percentage |
|---|---|---|---|
| A | 5026 | 19 | 0.378034% |
| B | 5026 | 120 | 2.387585% |
| C | 5026 | 133 | 2.646240% |
| D | 5026 | 207 | 4.118583% |
Noise dominated data is calculated using 1-second bins in cleaned event files. If a bin has >2000 counts, and if more than 50% of those come from <1% of pixels, then it is considered to be noise-dominated and hence unusable.
| Quadrant | # 1 sec bins | Bins with >0 counts | Bins with >2000 counts | High rate bins dominated by noise | Noise dominated (total time) | Noise dominated (detector-on time) | Marked lightcurve |
|---|---|---|---|---|---|---|---|
| A | 7089 | 5027 | 6 | 6 | 0.08% | 0.12% | 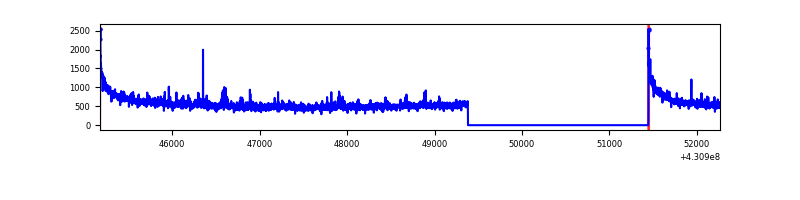 |
| B | 7089 | 5027 | 87 | 87 | 1.23% | 1.73% | 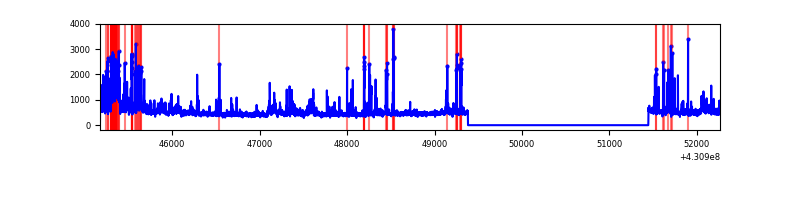 |
| C | 7089 | 5027 | 128 | 128 | 1.81% | 2.55% | 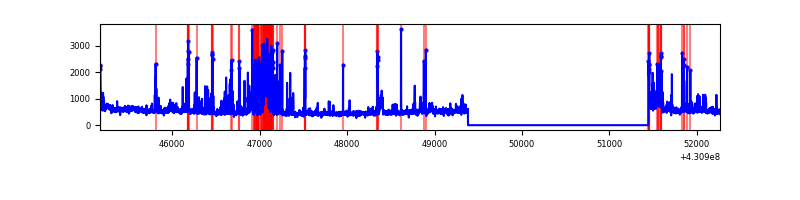 |
| D | 7089 | 5027 | 203 | 203 | 2.86% | 4.04% | 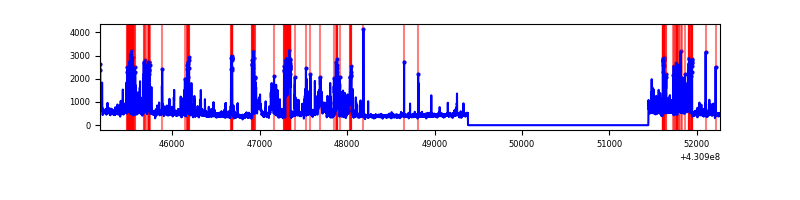 |
Top three noisy pixels from each quadrant. If the there are fewer than three noisy pixels in the level2.evt file, extra rows are filled as -1
| Pixel properties | Quadrant properties | ||||||
|---|---|---|---|---|---|---|---|
| Quadrant | DetID | PixID | Counts | Sigma | Mean | Median | Sigma |
| A | 10 | 83 | 590872 | 5255.34 | 552 | 542 | 112.3 |
| A | 12 | 189 | 115888 | 1026.85 | 552 | 542 | 112.3 |
| A | 2 | 79 | 15790 | 135.74 | 552 | 542 | 112.3 |
| B | 0 | 229 | 534746 | 5128.63 | 556 | 541 | 104.2 |
| B | 4 | 171 | 140105 | 1339.88 | 556 | 541 | 104.2 |
| B | 0 | 245 | 24626 | 231.23 | 556 | 541 | 104.2 |
| C | 4 | 254 | 619657 | 4900.78 | 548 | 552 | 126.3 |
| C | 15 | 214 | 201724 | 1592.46 | 548 | 552 | 126.3 |
| C | 8 | 79 | 96536 | 759.8 | 548 | 552 | 126.3 |
| D | 2 | 249 | 488303 | 3730.5 | 538 | 522 | 130.8 |
| D | 12 | 233 | 376191 | 2873.08 | 538 | 522 | 130.8 |
| D | 5 | 70 | 128483 | 978.63 | 538 | 522 | 130.8 |
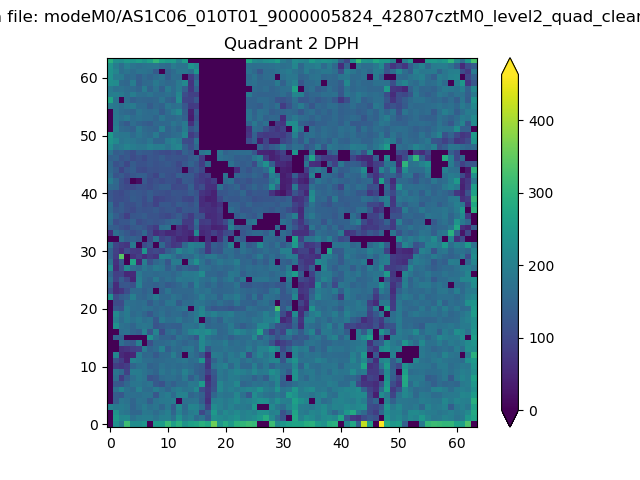
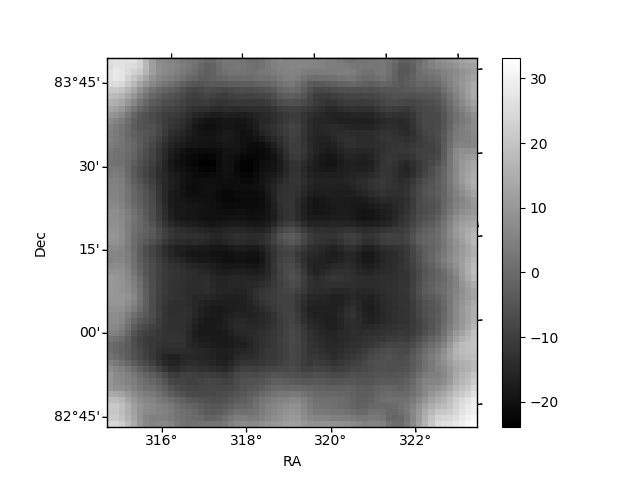
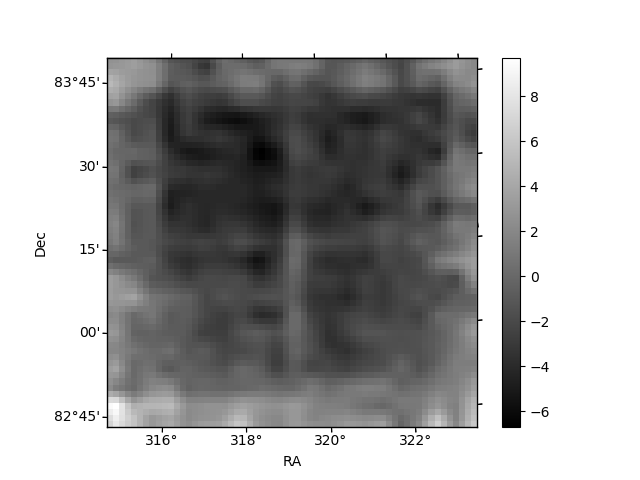
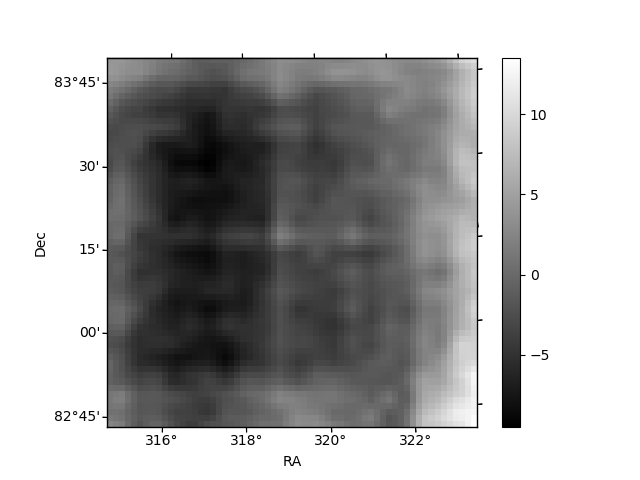
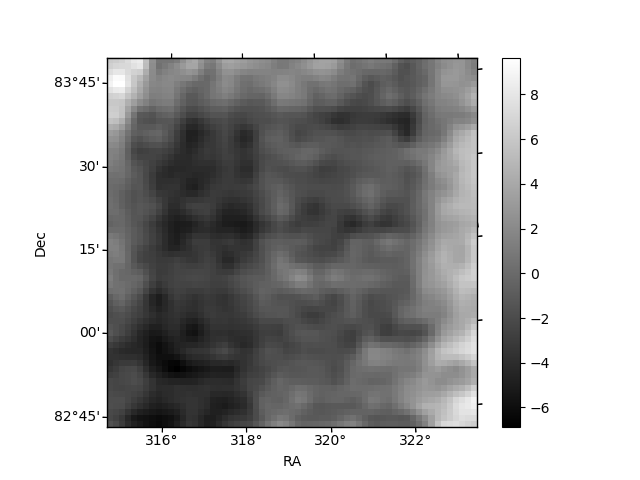
Histogram calculated using DETX and DETY for each event in the final _common_clean file
| Quadrant A | 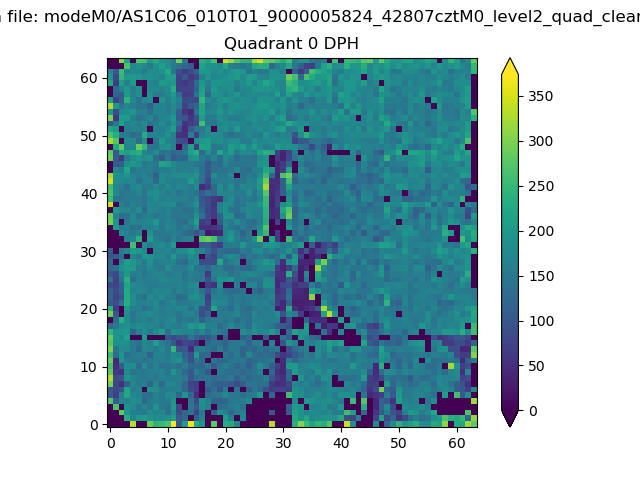 |
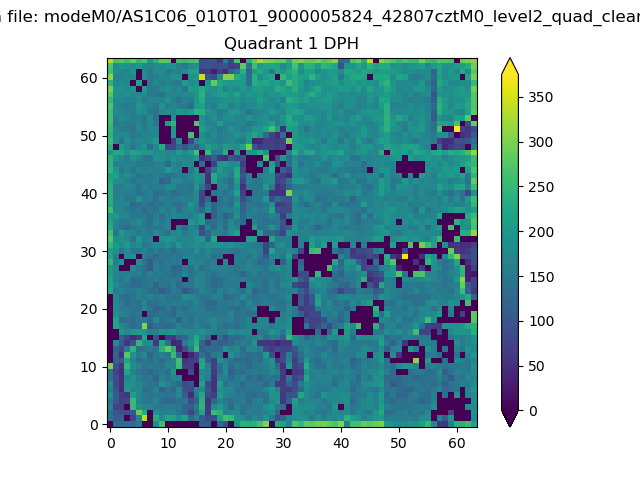 |
Quadrant B |
|---|---|---|---|
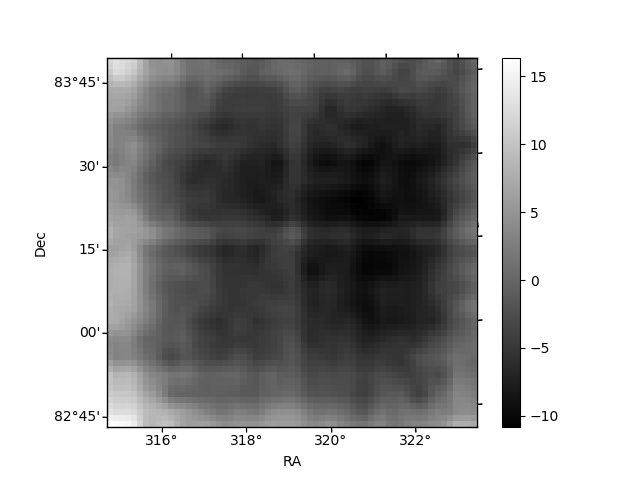
| Quadrant D | 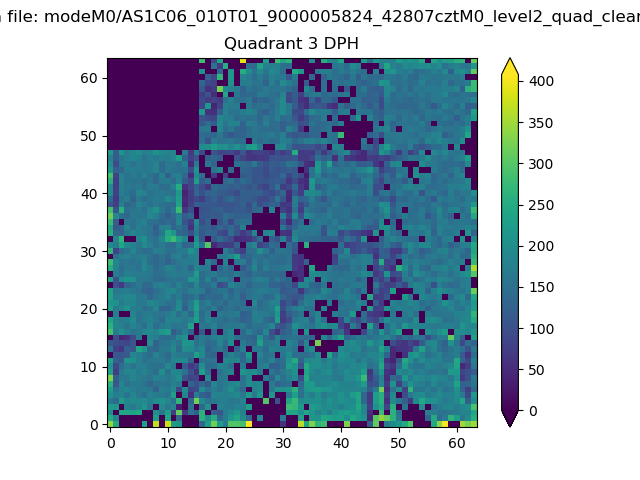 |
 |
Quadrant C |
| Plot type | Count rate plots | Images |
|---|---|---|
| Comparison with Poisson distribution Blue bars denote a histogram of data divided into 1 sec bins. Red curve is a Poisson curve with rate = median count rate of data. |
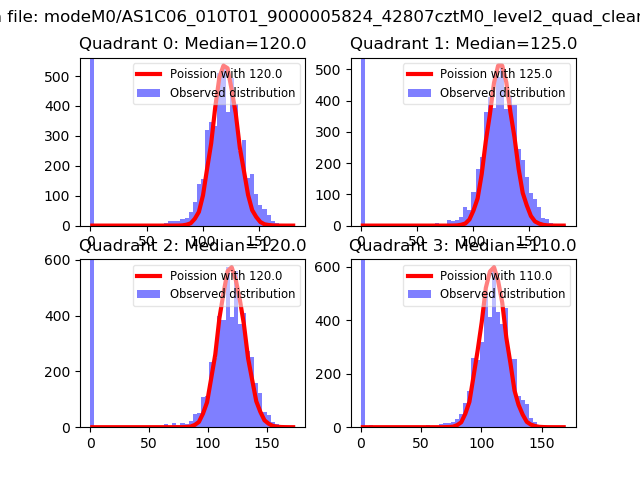 |
 |
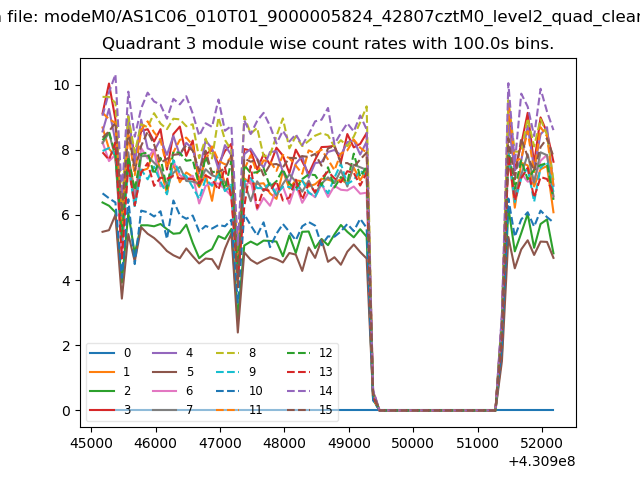
| Quadrant-wise count rates Data is divided into 100 sec bins |
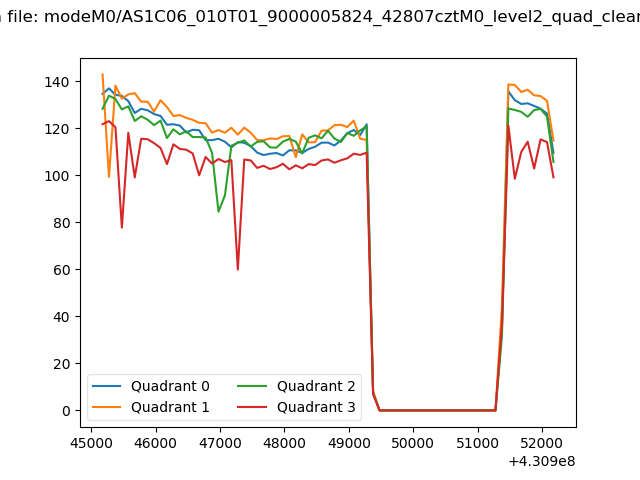 |
|
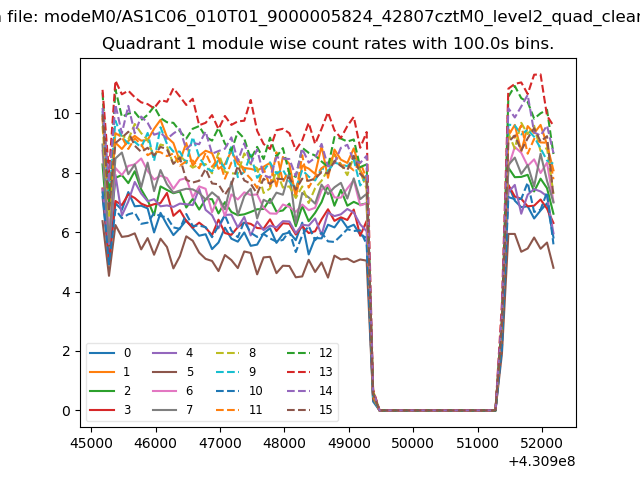
| Module-wise count rates for Quadrant A Data is divided into 100 sec bins |
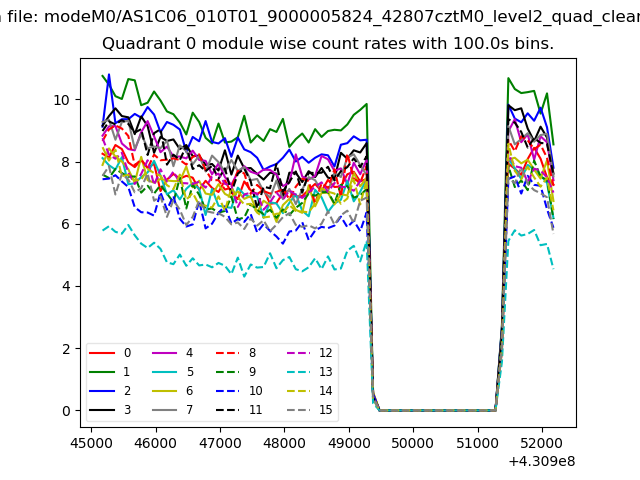 |
 |
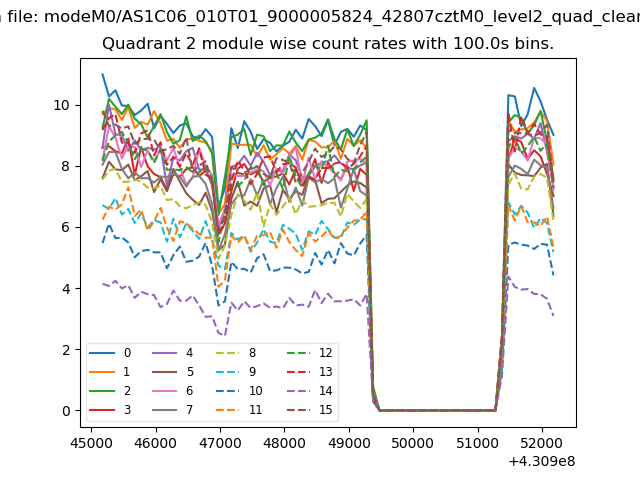
| Module-wise count rates for Quadrant B Data is divided into 100 sec bins |
 |
 |
| Module-wise count rates for Quadrant C Data is divided into 100 sec bins |
 |
 |
| Module-wise count rates for Quadrant D Data is divided into 100 sec bins |
 |
 |
| Parameter | Plot |
|---|---|
| CZT HV Monitor | 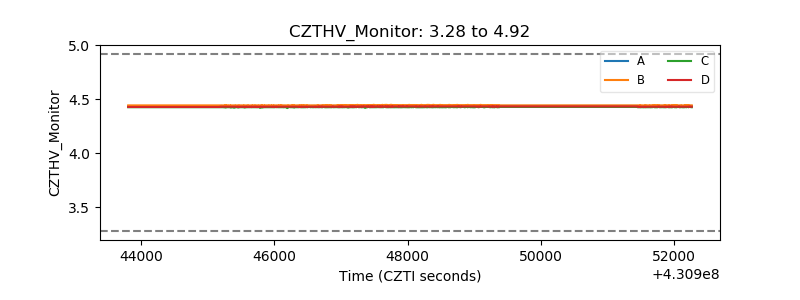 |
| D_VDD | 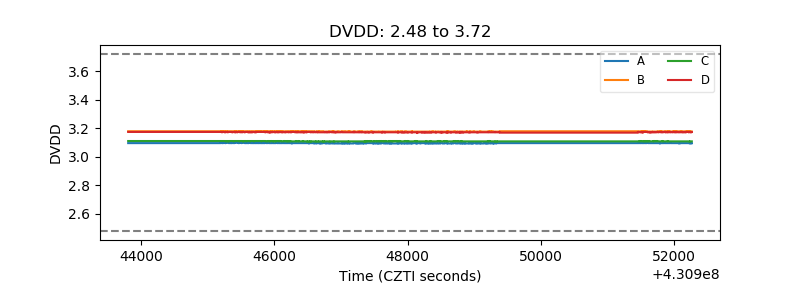 |
| Temperature 1 | 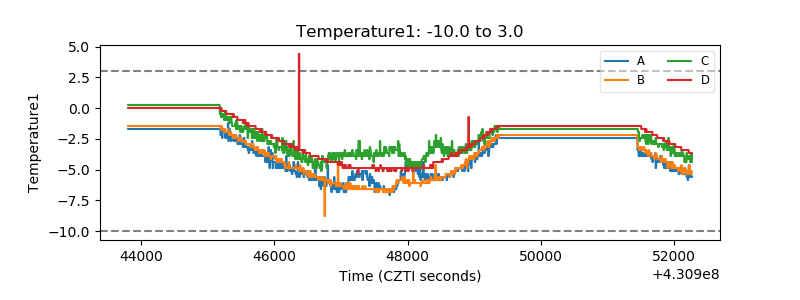 |
| Veto HV Monitor | 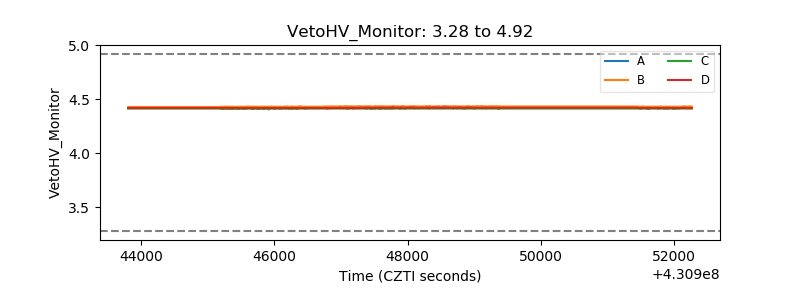 |
| Veto LLD | 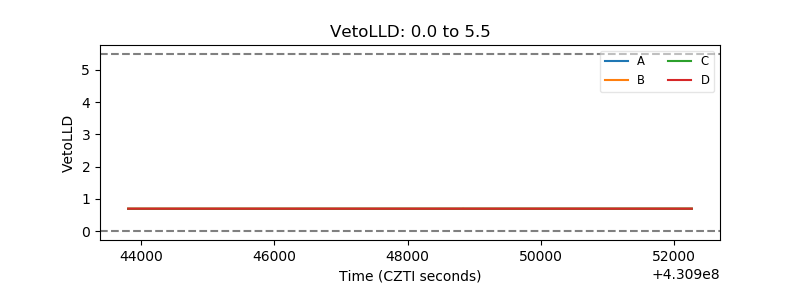 |
| Alpha Counter |  |
| _CPM_Rate | 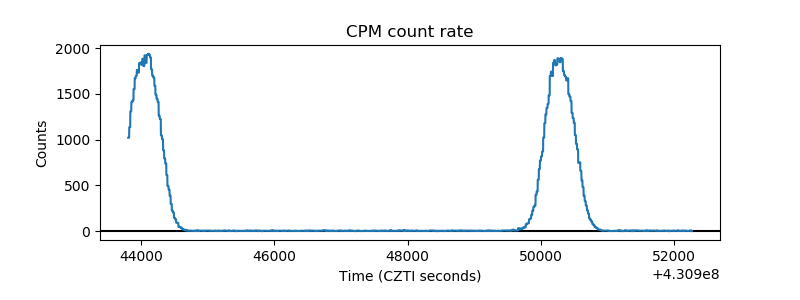 |
| CZT Counter | 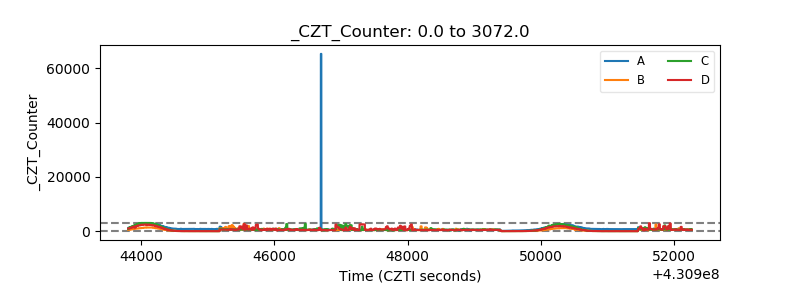 |
| +2.5 Volts monitor | 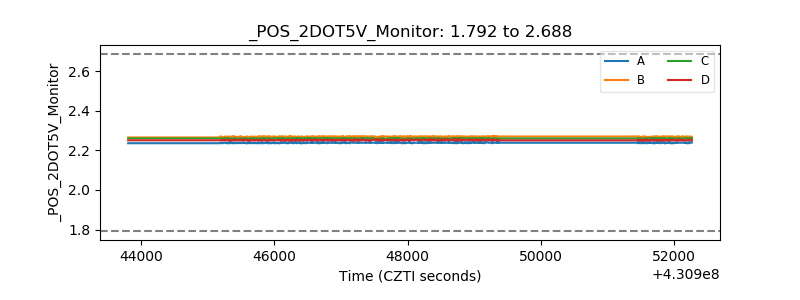 |
| +5 Volts monitor | 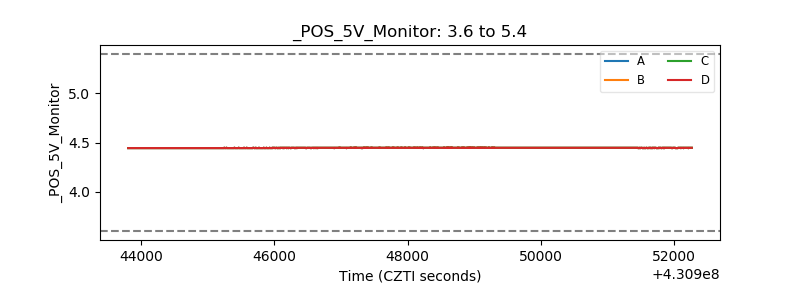 |
| _ROLL_ROT | 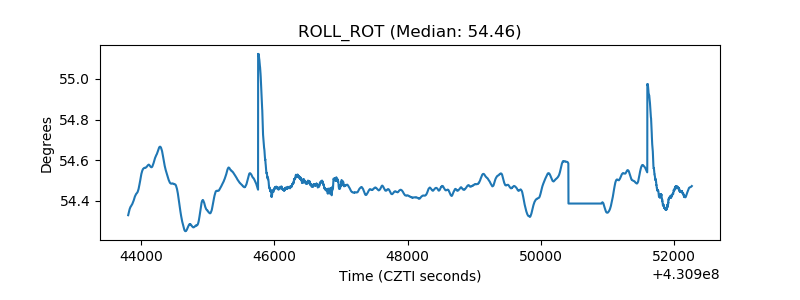 |
| _Roll_DEC | 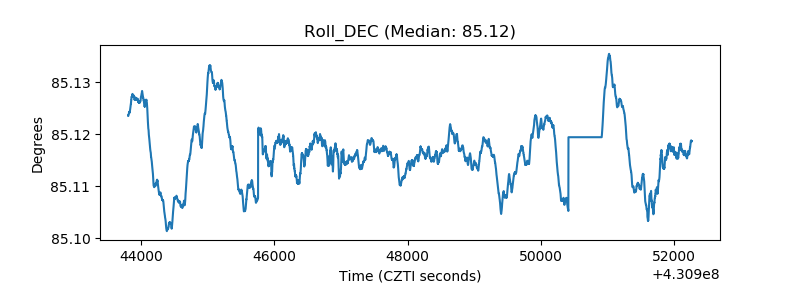 |
| _Roll_RA | 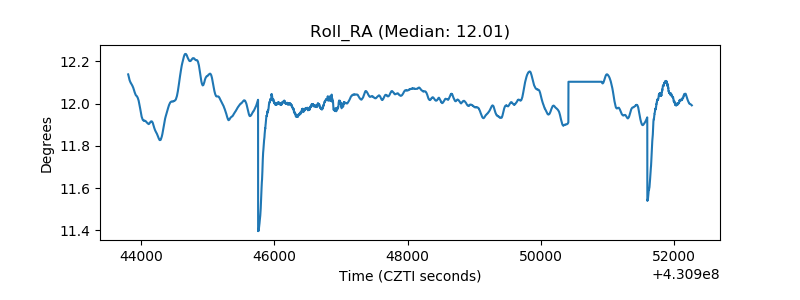 |
| Veto Counter | 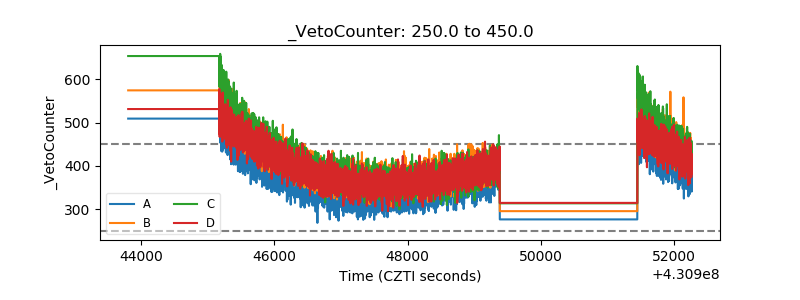 |