| Param | Original file | Final file |
|---|---|---|
| Filename | modeM0/AS1C06_010T01_9000005824_42808cztM0_level2.fits | modeM0/AS1C06_010T01_9000005824_42808cztM0_level2_quad_clean.evt |
| Size (bytes) | 64,048,320 | 15,713,280 |
| Size | 61.1 MB | 15.0 MB |
| Events in quadrant A | 563,381 | 106,247 |
| Events in quadrant B | 494,456 | 110,889 |
| Events in quadrant C | 585,329 | 102,847 |
| Events in quadrant D | 660,879 | 91,788 |
| Mode M9 | |||
|---|---|---|---|
| Quadrant | BADHDUFLAG | Total packets | Discarded packets |
| A | 0 | 4 | 0 |
| B | 0 | 5 | 0 |
| C | 0 | 5 | 0 |
| D | 0 | 5 | 0 |
| Mode M0 | |||
|---|---|---|---|
| Quadrant | BADHDUFLAG | Total packets | Discarded packets |
| A | 0 | 2222 | 1 |
| B | 0 | 1976 | 1 |
| C | 0 | 2242 | 1 |
| D | 0 | 2510 | 1 |
| Mode SS | |||
|---|---|---|---|
| Quadrant | BADHDUFLAG | Total packets | Discarded packets |
| A | 0 | 16 | 0 |
| B | 0 | 16 | 0 |
| C | 0 | 16 | 0 |
| D | 0 | 16 | 0 |
| Quadrant | Total seconds | Saturated seconds | Saturation percentage |
|---|---|---|---|
| A | 819 | 8 | 0.976801% |
| B | 819 | 12 | 1.465201% |
| C | 819 | 22 | 2.686203% |
| D | 819 | 50 | 6.105006% |
Noise dominated data is calculated using 1-second bins in cleaned event files. If a bin has >2000 counts, and if more than 50% of those come from <1% of pixels, then it is considered to be noise-dominated and hence unusable.
| Quadrant | # 1 sec bins | Bins with >0 counts | Bins with >2000 counts | High rate bins dominated by noise | Noise dominated (total time) | Noise dominated (detector-on time) | Marked lightcurve |
|---|---|---|---|---|---|---|---|
| A | 819 | 819 | 3 | 3 | 0.37% | 0.37% | 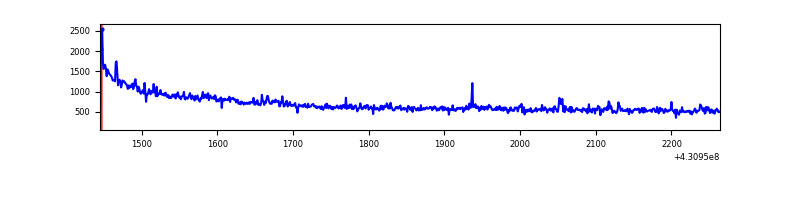 |
| B | 819 | 819 | 8 | 8 | 0.98% | 0.98% | 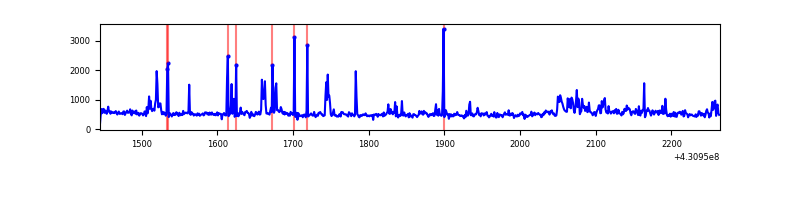 |
| C | 819 | 819 | 19 | 19 | 2.32% | 2.32% | 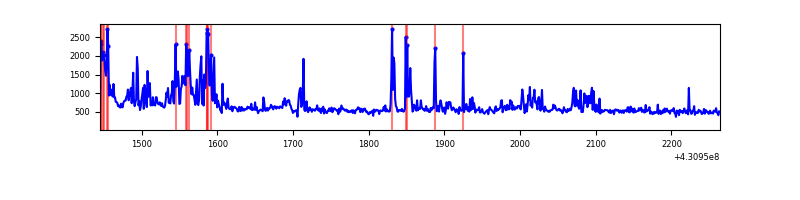 |
| D | 819 | 819 | 50 | 50 | 6.11% | 6.11% | 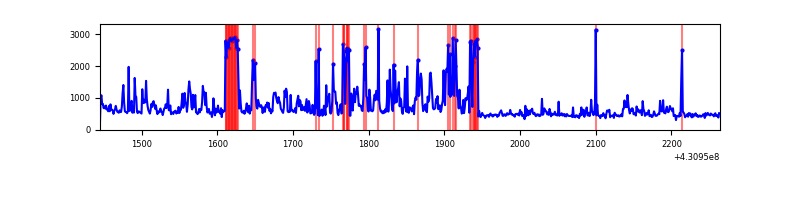 |
Top three noisy pixels from each quadrant. If the there are fewer than three noisy pixels in the level2.evt file, extra rows are filled as -1
| Pixel properties | Quadrant properties | ||||||
|---|---|---|---|---|---|---|---|
| Quadrant | DetID | PixID | Counts | Sigma | Mean | Median | Sigma |
| A | 10 | 83 | 171640 | 7992.21 | 95 | 93 | 21.5 |
| A | 12 | 189 | 14426 | 667.76 | 95 | 93 | 21.5 |
| A | 13 | 248 | 3001 | 135.48 | 95 | 93 | 21.5 |
| B | 0 | 229 | 69031 | 3364.29 | 97 | 95 | 20.5 |
| B | 4 | 171 | 24753 | 1203.39 | 97 | 95 | 20.5 |
| B | 0 | 245 | 6165 | 296.23 | 97 | 95 | 20.5 |
| C | 4 | 254 | 110608 | 4552.51 | 97 | 97 | 24.3 |
| C | 15 | 214 | 37067 | 1522.98 | 97 | 97 | 24.3 |
| C | 8 | 79 | 33101 | 1359.6 | 97 | 97 | 24.3 |
| D | 12 | 233 | 90755 | 3723.58 | 93 | 90 | 24.3 |
| D | 13 | 249 | 81867 | 3358.55 | 93 | 90 | 24.3 |
| D | 5 | 171 | 45515 | 1865.59 | 93 | 90 | 24.3 |
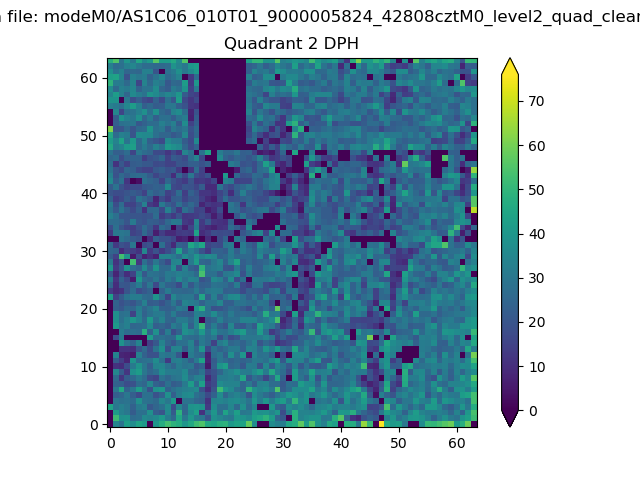
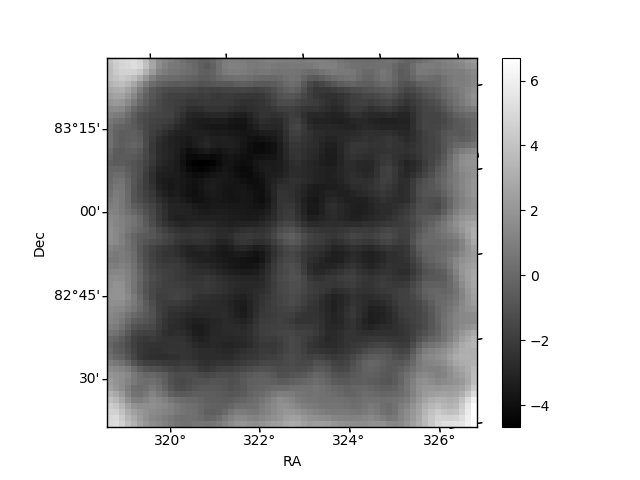
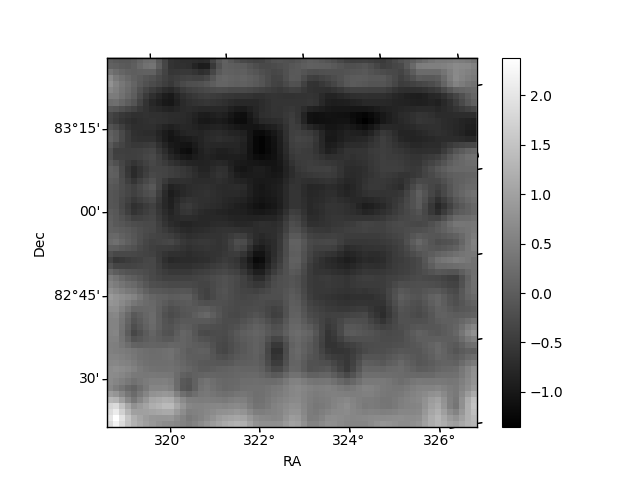
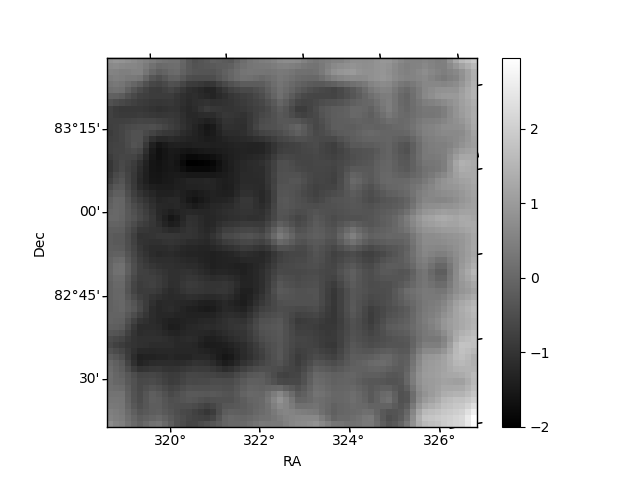
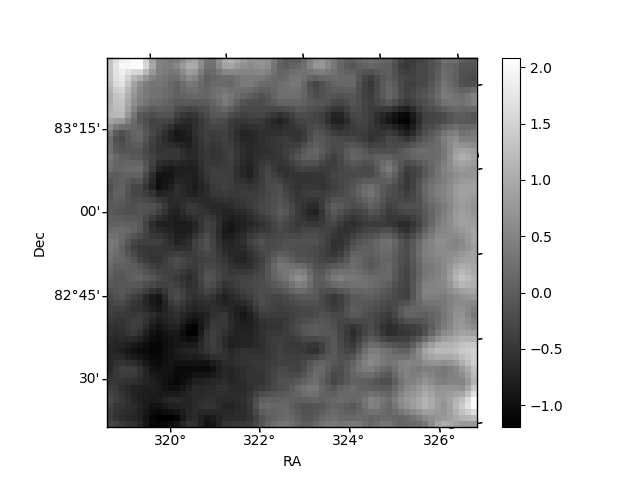
Histogram calculated using DETX and DETY for each event in the final _common_clean file
| Quadrant A | 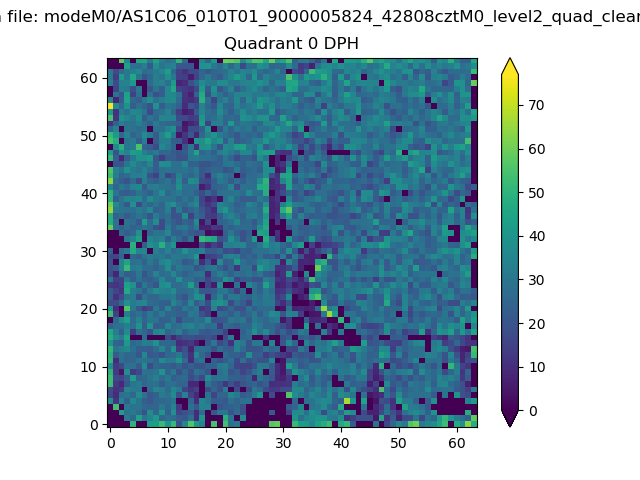 |
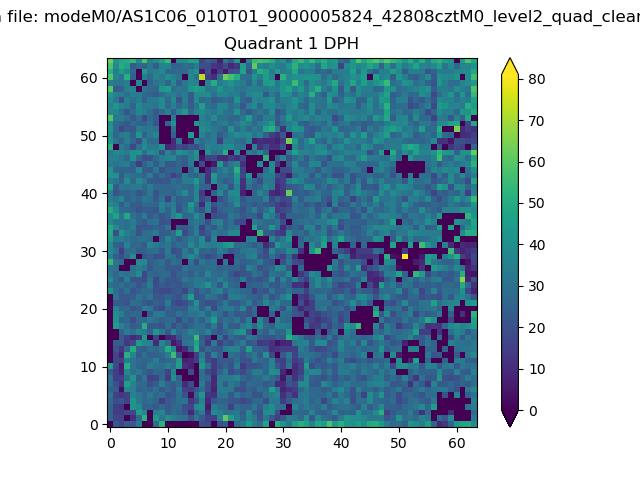 |
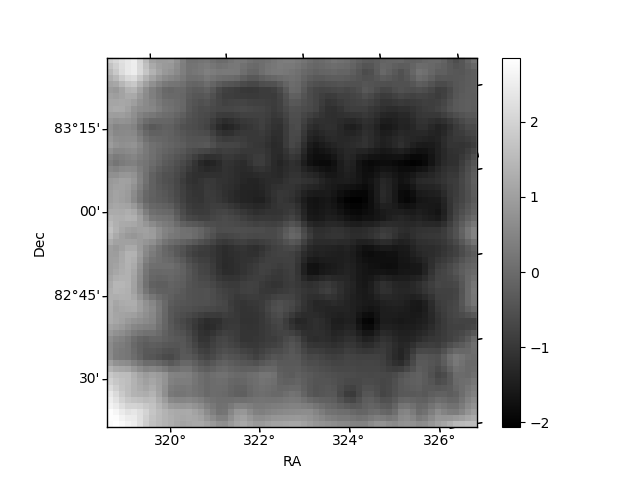
Quadrant B |
|---|---|---|---|
| Quadrant D | 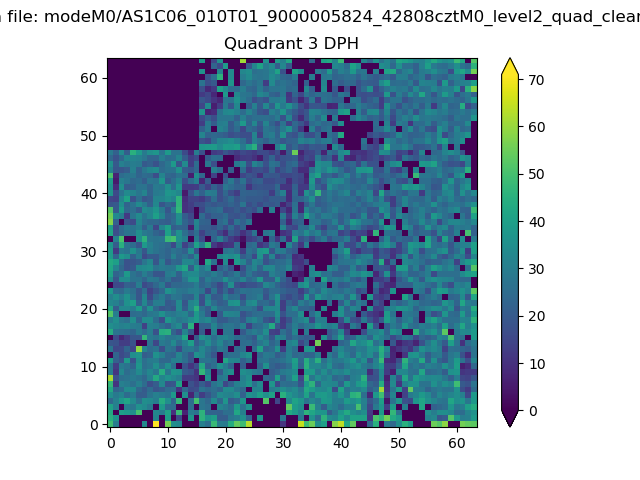 |
 |
Quadrant C |
| Plot type | Count rate plots | Images |
|---|---|---|
| Comparison with Poisson distribution Blue bars denote a histogram of data divided into 1 sec bins. Red curve is a Poisson curve with rate = median count rate of data. |
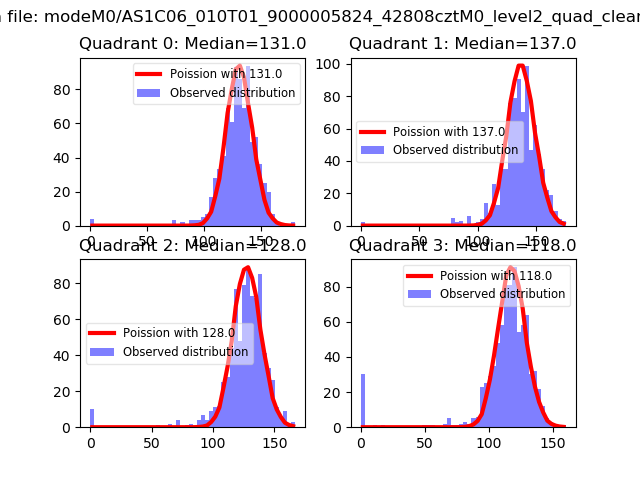 |
 |
| Quadrant-wise count rates Data is divided into 100 sec bins |
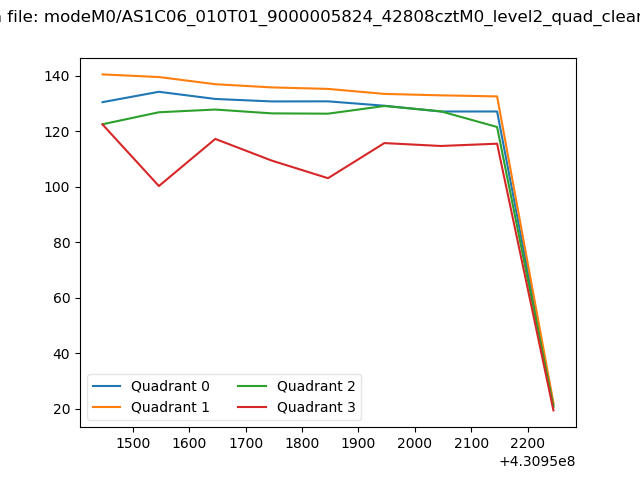 |
|
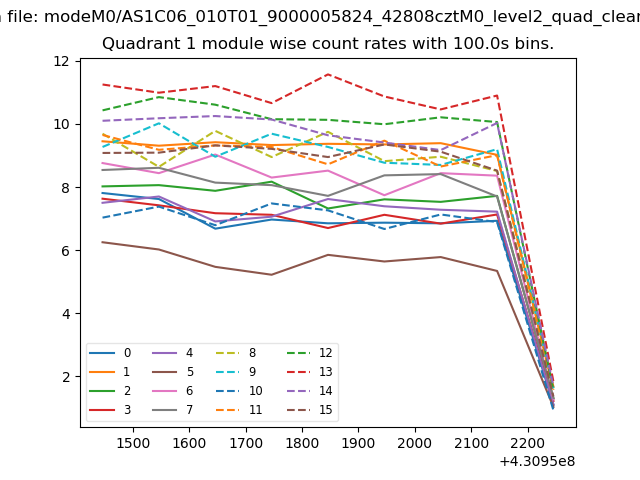
| Module-wise count rates for Quadrant A Data is divided into 100 sec bins |
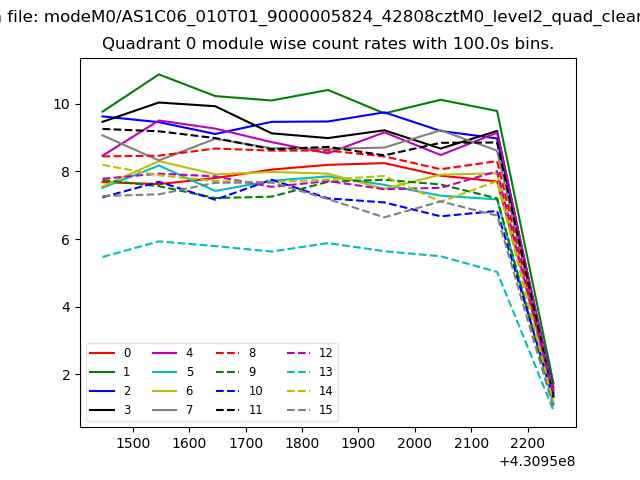 |
 |
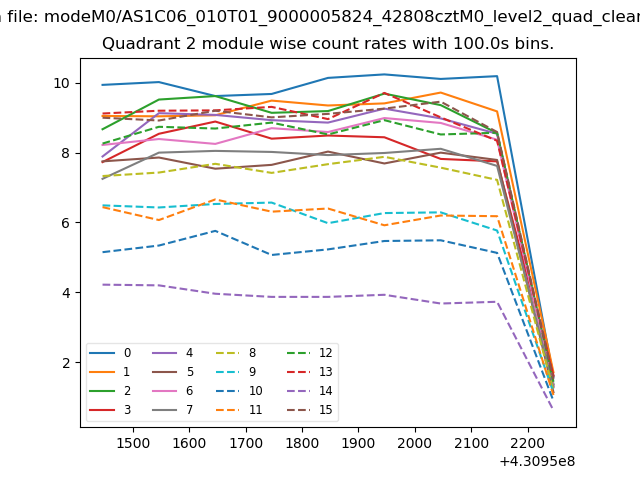
| Module-wise count rates for Quadrant B Data is divided into 100 sec bins |
 |
 |
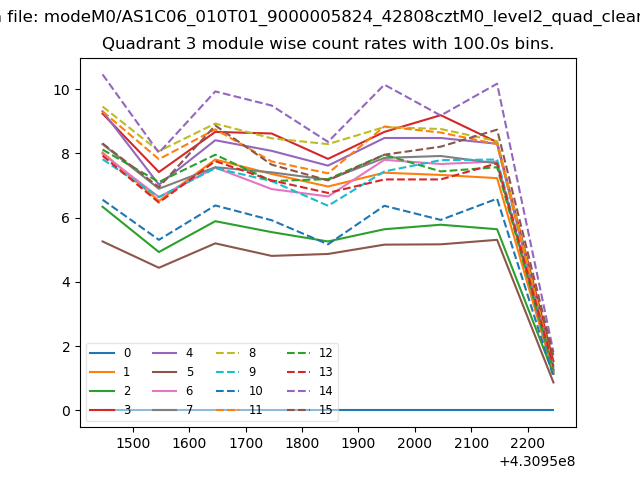
| Module-wise count rates for Quadrant C Data is divided into 100 sec bins |
 |
 |
| Module-wise count rates for Quadrant D Data is divided into 100 sec bins |
 |
 |
| Parameter | Plot |
|---|---|
| CZT HV Monitor |  |
| D_VDD | 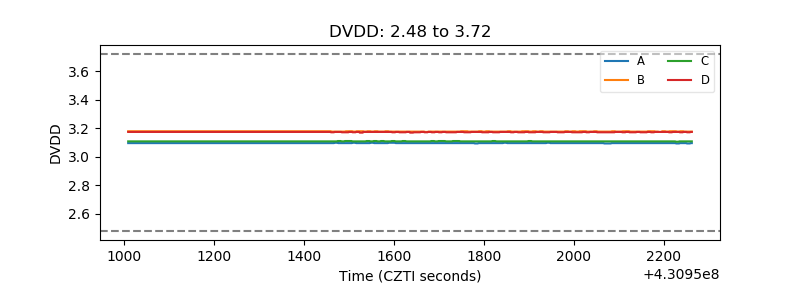 |
| Temperature 1 | 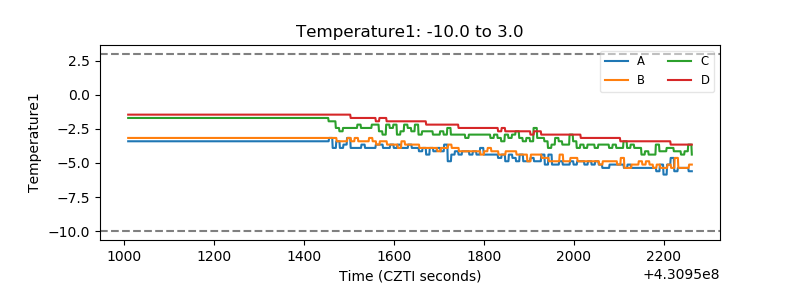 |
| Veto HV Monitor | 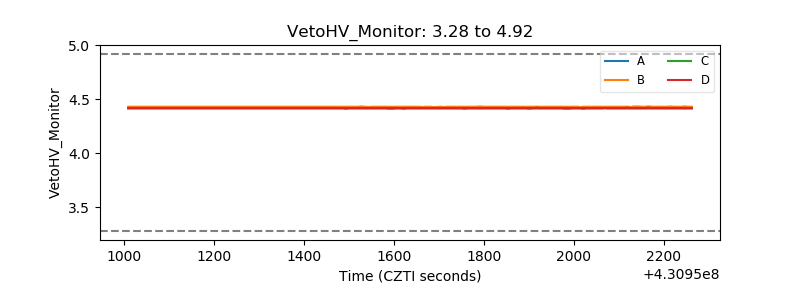 |
| Veto LLD | 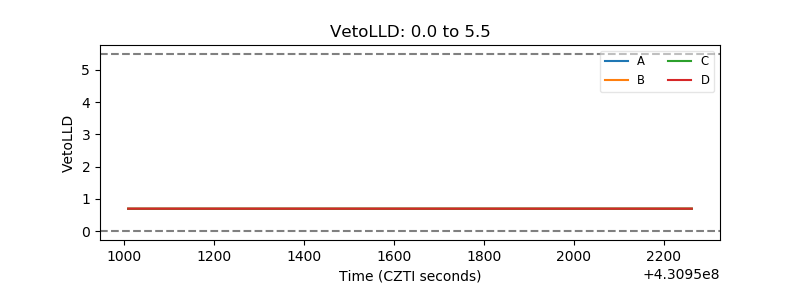 |
| Alpha Counter | 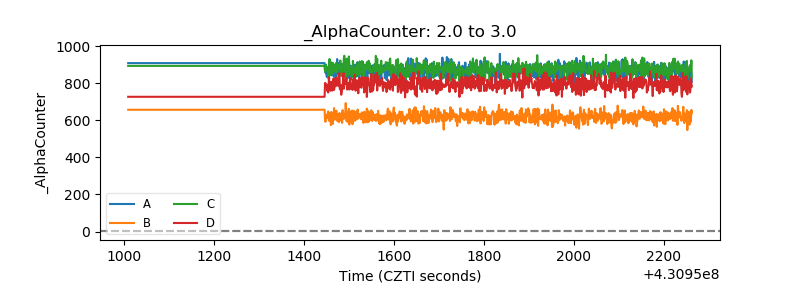 |
| _CPM_Rate | 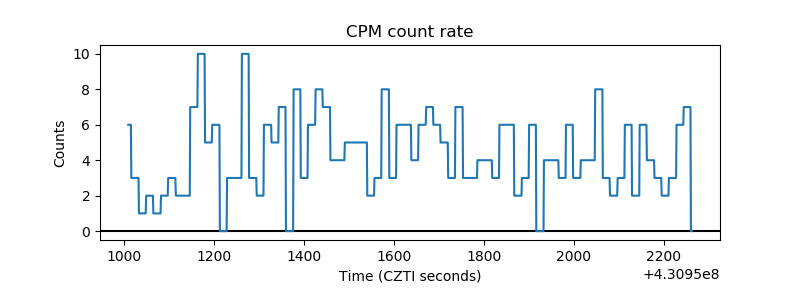 |
| CZT Counter | 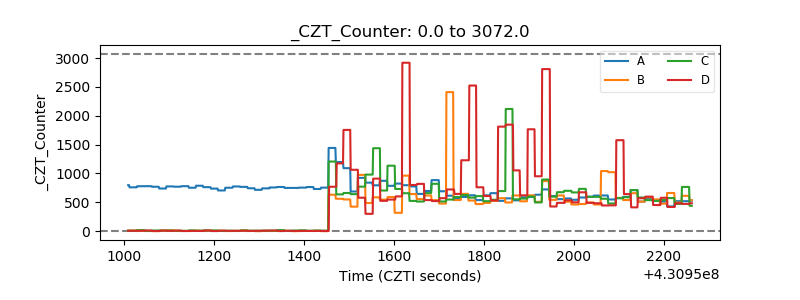 |
| +2.5 Volts monitor | 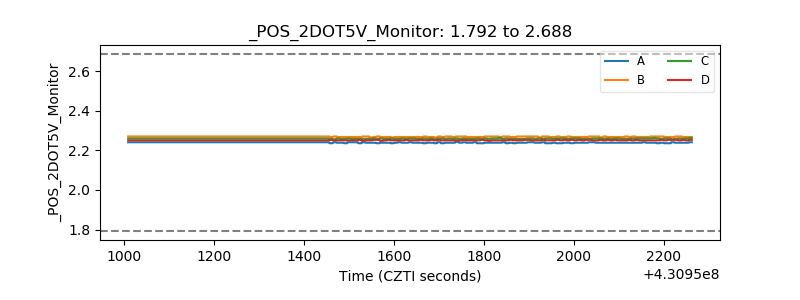 |
| +5 Volts monitor | 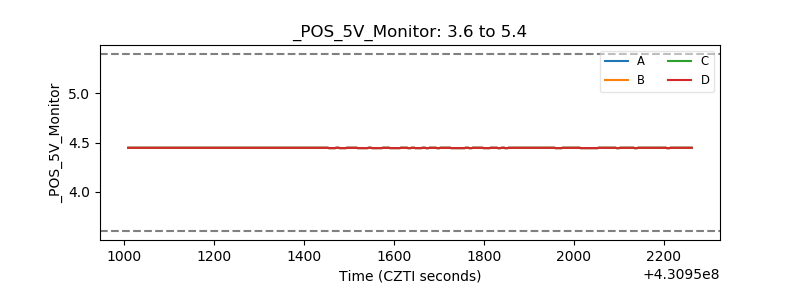 |
| _ROLL_ROT | 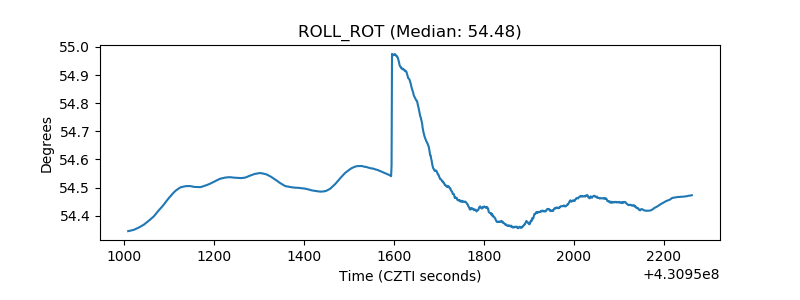 |
| _Roll_DEC | 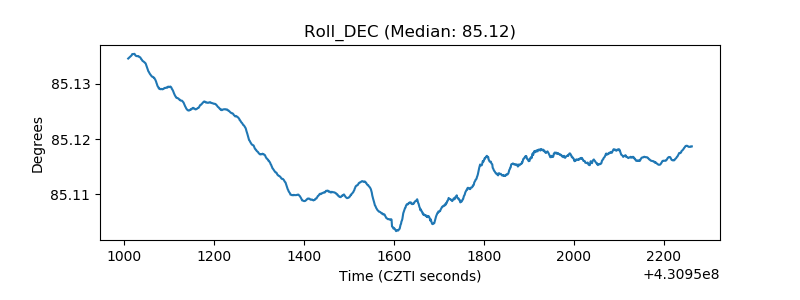 |
| _Roll_RA | 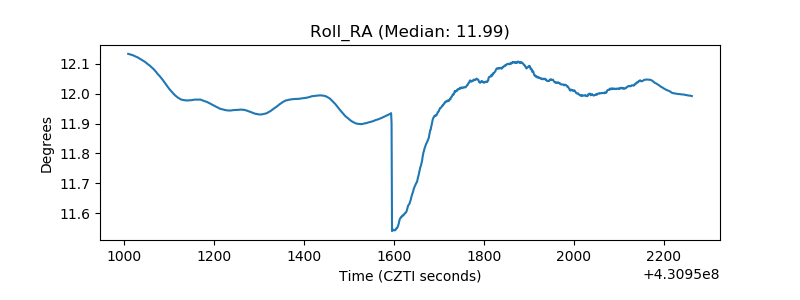 |
| Veto Counter | 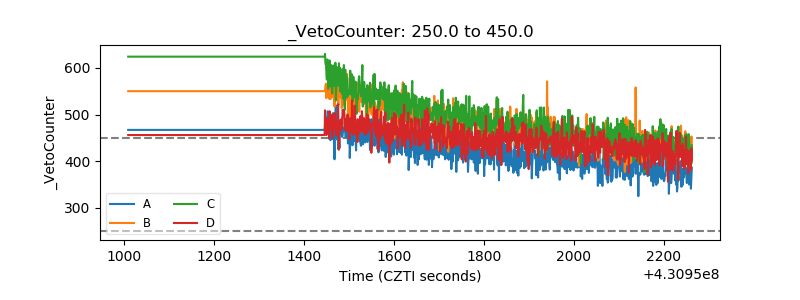 |